

Genome-Wide Comprehensive Analysis of the GASA Gene Family in Populus
- PMID: 34830215
- PMCID: PMC8624709
- DOI: 10.3390/ijms222212336
Genome-Wide Comprehensive Analysis of the GASA Gene Family in Populus
Abstract
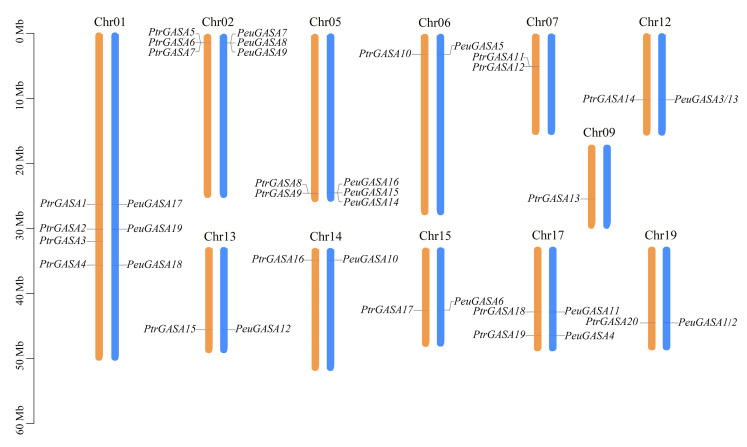
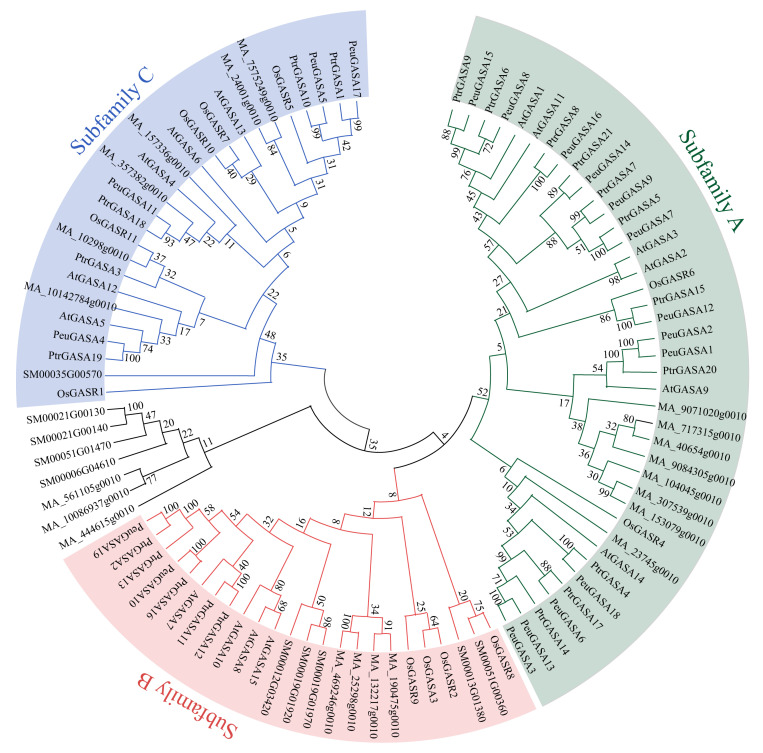
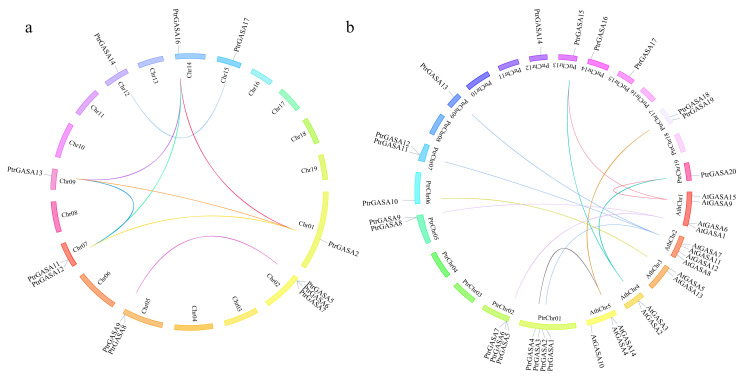
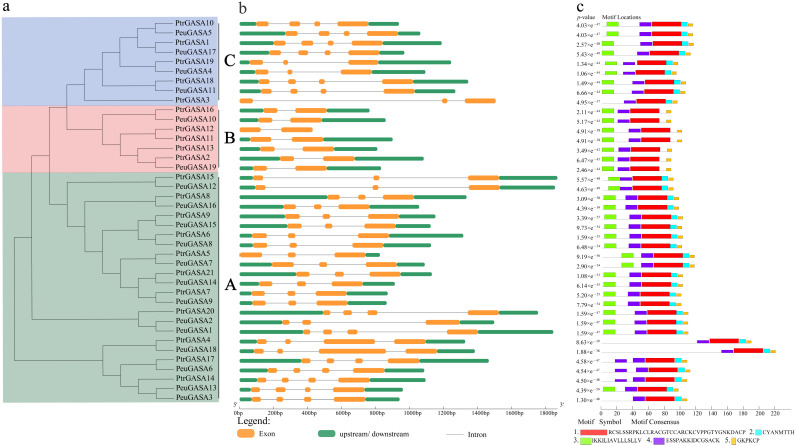
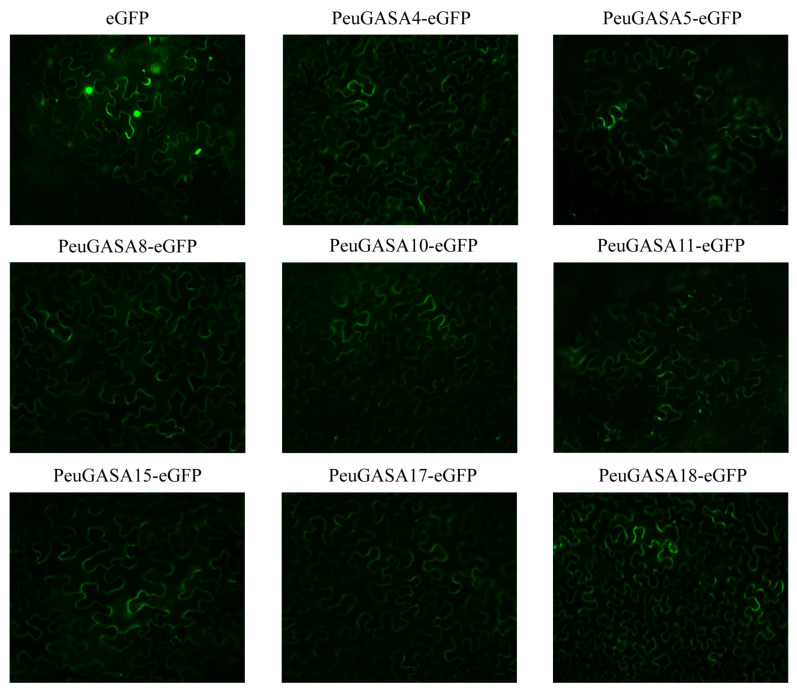
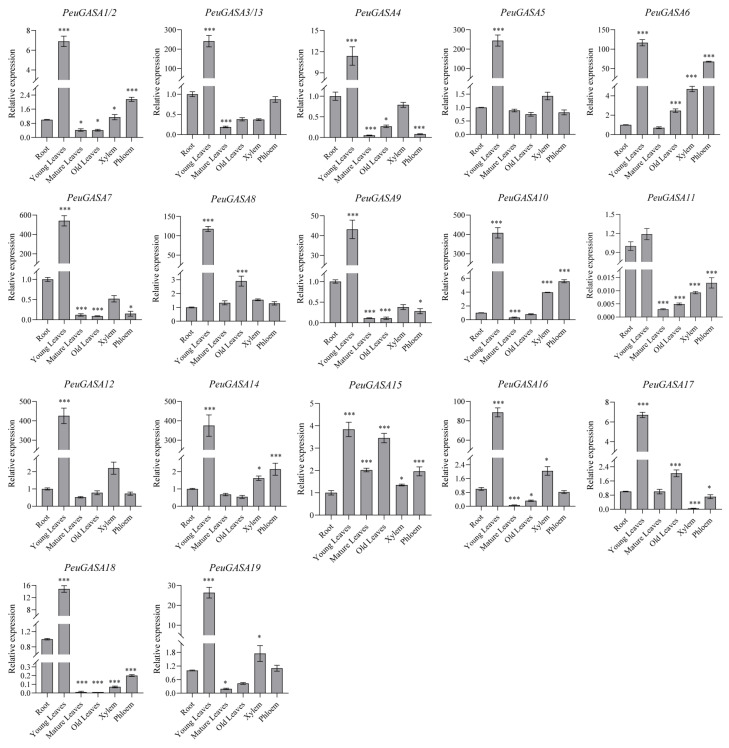
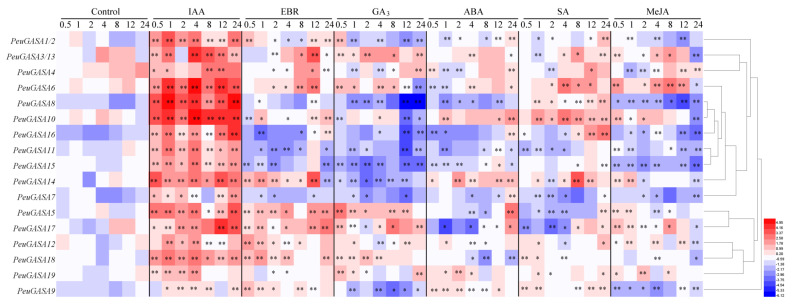
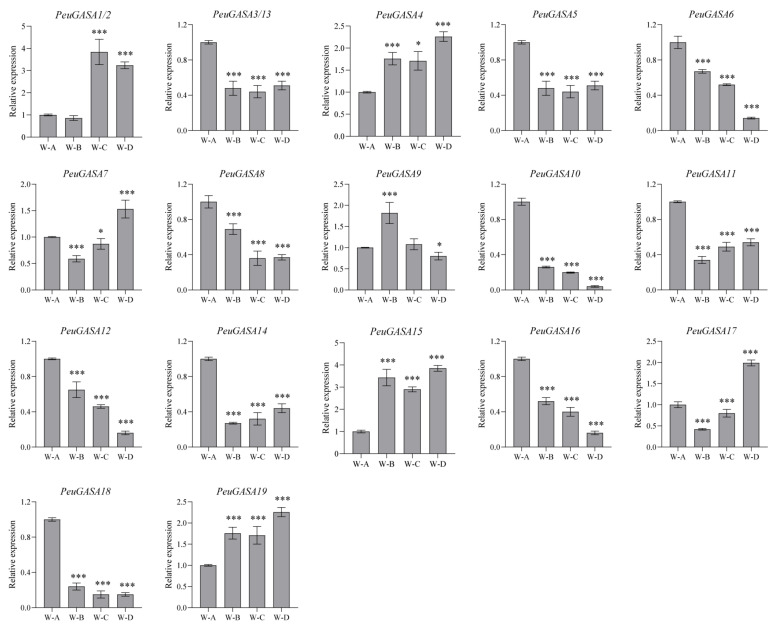
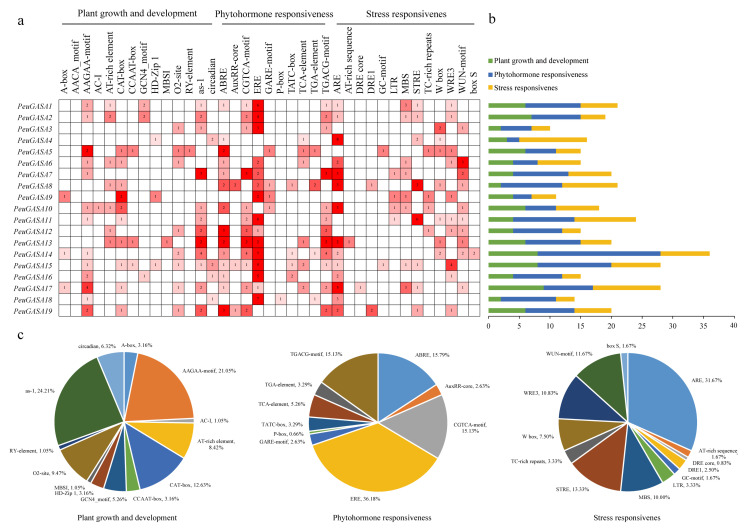
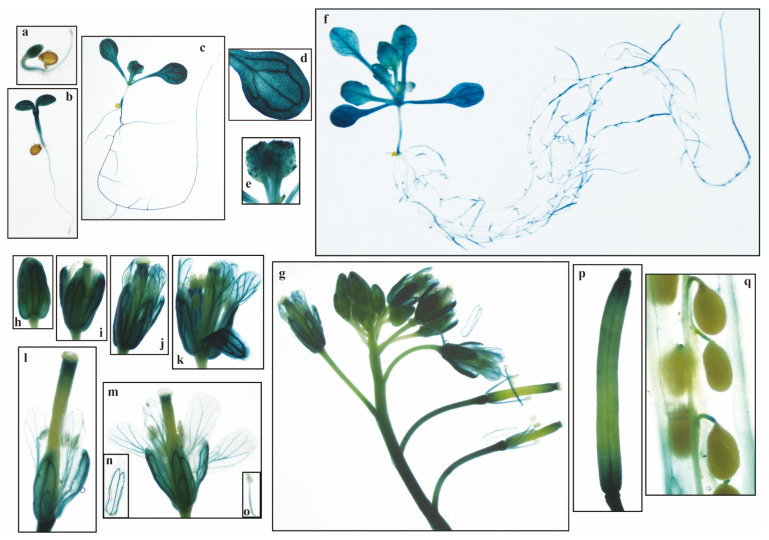
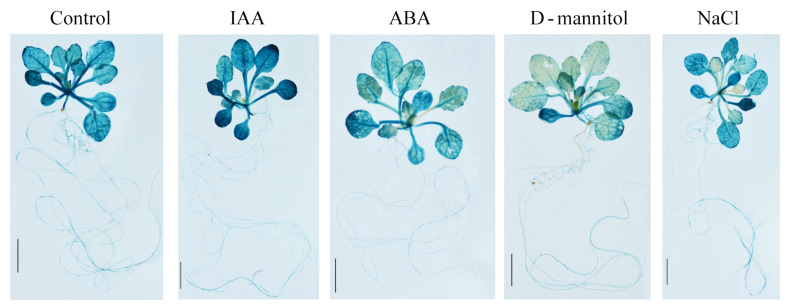
Gibberellic acid-stimulated Arabidopsis (GASA) proteins, as cysteine-rich peptides (CRPs), play roles in development and reproduction and biotic and abiotic stresses. Although the GASA gene family has been identified in plants, the knowledge about GASAs in Populus euphratica, the woody model plant for studying abiotic stress, remains limited. Here, we referenced the well-sequenced Populus trichocarpa genome, and identified the GASAs in the whole genome of P. euphratica and P. trichocarpa. 21 candidate genes in P. trichocarpa and 19 candidate genes in P. euphratica were identified and categorized into three subfamilies by phylogenetic analysis. Most GASAs with signal peptides were located extracellularly. The GASA genes in Populus have experienced multiple gene duplication events, especially in the subfamily A. The evolution of the subfamily A, with the largest number of members, can be attributed to whole-genome duplication (WGD) and tandem duplication (TD). Collinearity analysis showed that WGD genes played a leading role in the evolution of GASA genes subfamily B. The expression patterns of P. trichocarpa and P. euphratica were investigated using the PlantGenIE database and the real-time quantitative PCR (qRT-PCR), respectively. GASA genes in P. trichocarpa and P. euphratica were mainly expressed in young tissues and organs, and almost rarely expressed in mature leaves. GASA genes in P. euphratica leaves were also widely involved in hormone responses and drought stress responses. GUS activity assay showed that PeuGASA15 was widely present in various organs of the plant, especially in vascular bundles, and was induced by auxin and inhibited by mannitol dramatically. In summary, this present study provides a theoretical foundation for further research on the function of GASA genes in P. euphratica.
Keywords: GASA genes; Populus; bioinformatics; growth and development; phytohormone.
Conflict of interest statement
The authors declare no conflict of interest.
Figures
Similar articles
-
Identification and Expression Analysis of the Populus trichocarpa GASA-Gene Family.Int J Mol Sci. 2022 Jan 28;23(3):1507. doi: 10.3390/ijms23031507. Int J Mol Sci. 2022. PMID: 35163431 Free PMC article.
-
The Identification and Characterization of the PeGRF Gene Family in Populus euphratica Oliv. Heteromorphic Leaves Provide a Theoretical Basis for the Functional Study of PeGRF9.Int J Mol Sci. 2024 Dec 25;26(1):66. doi: 10.3390/ijms26010066. Int J Mol Sci. 2024. PMID: 39795925 Free PMC article.
-
Genome-Wide Analysis of Aquaporins Gene Family in Populus euphratica and Its Expression Patterns in Response to Drought, Salt Stress, and Phytohormones.Int J Mol Sci. 2024 Sep 23;25(18):10185. doi: 10.3390/ijms251810185. Int J Mol Sci. 2024. PMID: 39337672 Free PMC article.
-
GASA Proteins: Review of Their Functions in Plant Environmental Stress Tolerance.Plants (Basel). 2023 May 21;12(10):2045. doi: 10.3390/plants12102045. Plants (Basel). 2023. PMID: 37653962 Free PMC article. Review.
-
Progress in studying heteromorphic leaves in Populus euphratica: leaf morphology, anatomical structure, development regulation and their ecological adaptation to arid environments.Plant Signal Behav. 2021 Apr 3;16(4):1870842. doi: 10.1080/15592324.2020.1870842. Epub 2021 Jan 11. Plant Signal Behav. 2021. PMID: 33427562 Free PMC article. Review.
Cited by
-
Genome-wide characterization of the tomato GASA family identifies SlGASA1 as a repressor of fruit ripening.Hortic Res. 2022 Sep 28;10(1):uhac222. doi: 10.1093/hr/uhac222. eCollection 2023. Hortic Res. 2022. PMID: 36643743 Free PMC article.
-
Transcriptome and Low-Affinity Sodium Transport Analysis Reveals Salt Tolerance Variations between Two Poplar Trees.Int J Mol Sci. 2023 Mar 17;24(6):5732. doi: 10.3390/ijms24065732. Int J Mol Sci. 2023. PMID: 36982804 Free PMC article.
-
Genome-Wide Identification, Evolution, and Expression Analysis of GASA Gene Family in Prunus mume.Int J Mol Sci. 2022 Sep 18;23(18):10923. doi: 10.3390/ijms231810923. Int J Mol Sci. 2022. PMID: 36142832 Free PMC article.
-
Genome-Wide Identification and Analysis of the EPF Gene Family in Sorghum bicolor (L.) Moench.Plants (Basel). 2023 Nov 20;12(22):3912. doi: 10.3390/plants12223912. Plants (Basel). 2023. PMID: 38005809 Free PMC article.
-
Genome-Wide Identification and Comprehensive Analysis of the GASA Gene Family in Peanuts (Arachis hypogaea L.) under Abiotic Stress.Int J Mol Sci. 2023 Dec 4;24(23):17117. doi: 10.3390/ijms242317117. Int J Mol Sci. 2023. PMID: 38069439 Free PMC article.
References
MeSH terms
Substances
Grants and funding
LinkOut - more resources
Full Text Sources
Other Literature Sources
