Review
. 2021 Nov 17;22(22):12410.
doi: 10.3390/ijms222212410.

D-Xylose Sensing in Saccharomyces cerevisiae: Insights from D-Glucose Signaling and Native D-Xylose Utilizers

Affiliations
Review

D-Xylose Sensing in Saccharomyces cerevisiae: Insights from D-Glucose Signaling and Native D-Xylose Utilizers

Daniel P Brink et al. Int J Mol Sci. .

Abstract

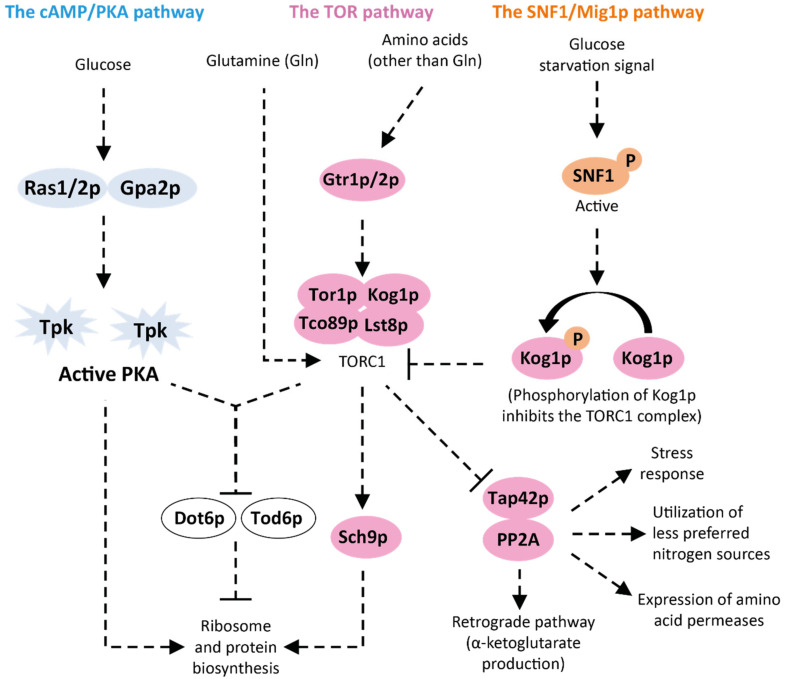
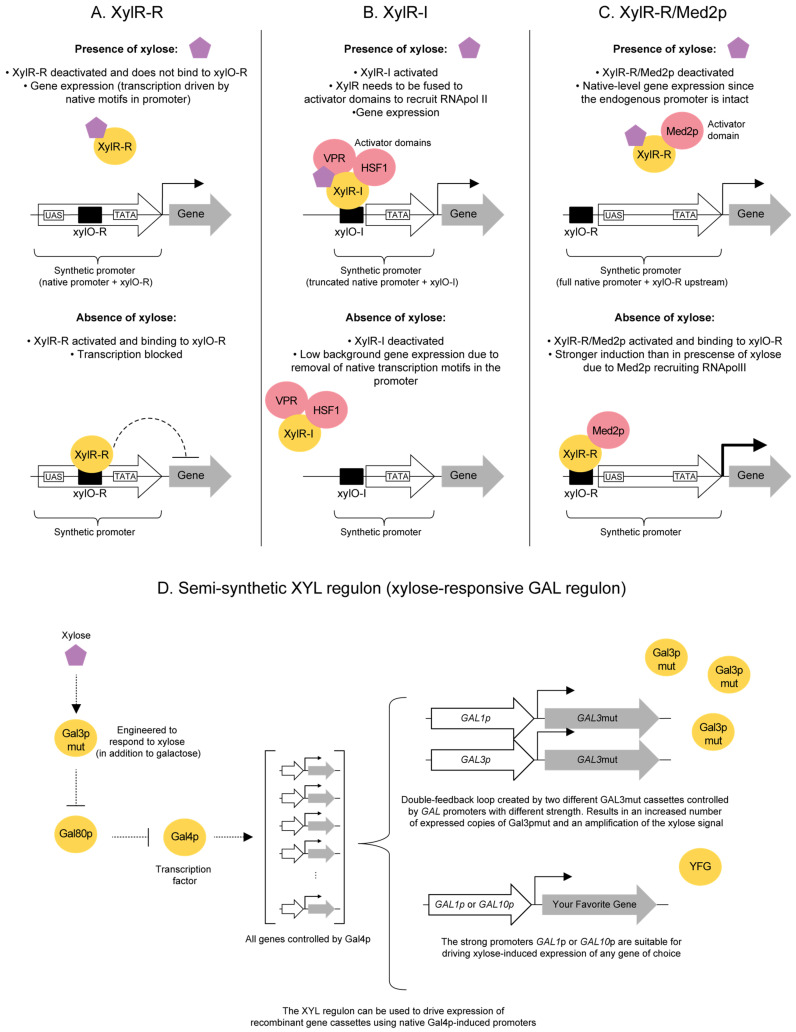
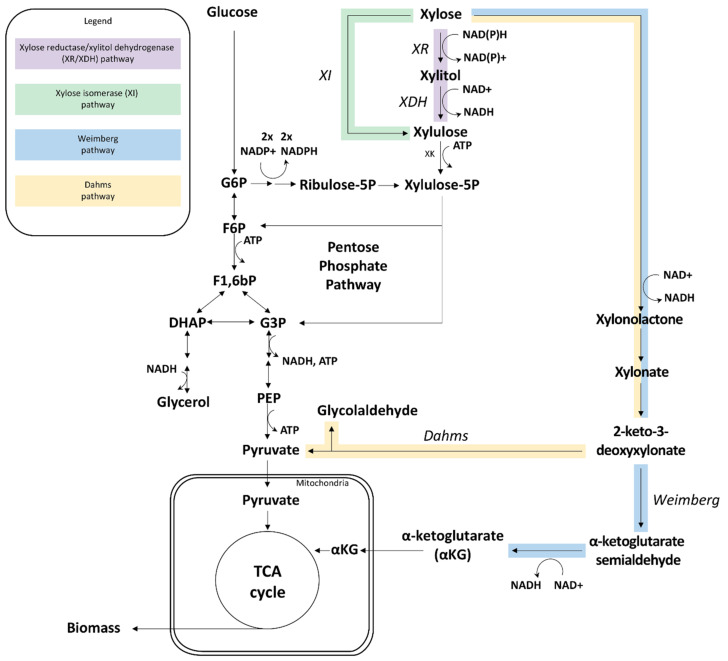
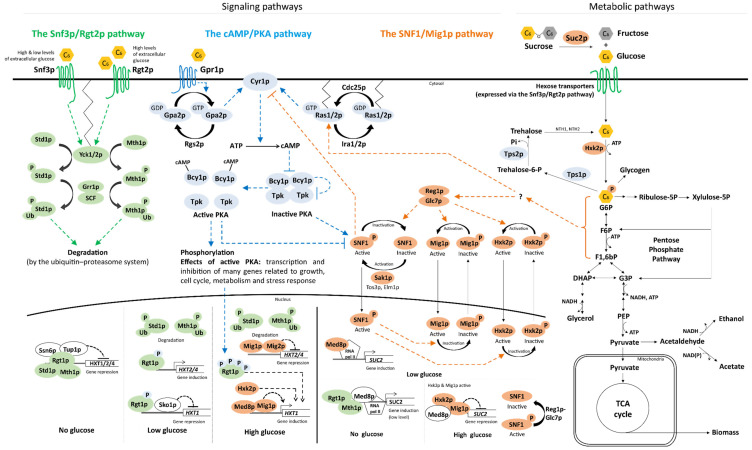
Extension of the substrate range is among one of the metabolic engineering goals for microorganisms used in biotechnological processes because it enables the use of a wide range of raw materials as substrates. One of the most prominent examples is the engineering of baker's yeast Saccharomyces cerevisiae for the utilization of d-xylose, a five-carbon sugar found in high abundance in lignocellulosic biomass and a key substrate to achieve good process economy in chemical production from renewable and non-edible plant feedstocks. Despite many excellent engineering strategies that have allowed recombinant S. cerevisiae to ferment d-xylose to ethanol at high yields, the consumption rate of d-xylose is still significantly lower than that of its preferred sugar d-glucose. In mixed d-glucose/d-xylose cultivations, d-xylose is only utilized after d-glucose depletion, which leads to prolonged process times and added costs. Due to this limitation, the response on d-xylose in the native sugar signaling pathways has emerged as a promising next-level engineering target. Here we review the current status of the knowledge of the response of S. cerevisiae signaling pathways to d-xylose. To do this, we first summarize the response of the native sensing and signaling pathways in S. cerevisiae to d-glucose (the preferred sugar of the yeast). Using the d-glucose case as a point of reference, we then proceed to discuss the known signaling response to d-xylose in S. cerevisiae and current attempts of improving the response by signaling engineering using native targets and synthetic (non-native) regulatory circuits.

Keywords: Saccharomyces cerevisiae; d-xylose; non-native substrate; signaling network engineering; sugar sensing; sugar signaling; synthetic signaling circuits.


Conflict of interest statement

The authors declare that they have no competing interests.

Figures

Figure 4
Figure 4
Overview of the S. cerevisiae TOR pathway that responds to nutrient availability and controls several biosynthetic and metabolic processes. The TOR pathway senses availability and the type of nitrogen (e.g., amino acids and inorganic nitrogen) and sends signals to induce the transcriptional machinery and nitrogen catabolic pathways. TOR acts in concert with the cAMP/PKA pathway to sense d-glucose and nitrogen availability and, if both signals are present, represses the Dot6p/Tod6p transcriptional machinery repressors. When d-glucose limitation is sensed by the SNF1/Mig1p pathway, cross-talk signals are sent to repress the TOR pathway. Arrows with arrowheads: induction; arrows with hammerheads: repression; dashed arrows: signaling. Blue shapes: cAMP/PKA pathway; pink shapes: TOR pathways; orange shapes: SNF1/Mig1p; white shapes: proteins from other pathways. Adapted from [87,184,189,190].
Figure 7
Figure 7
Schematic overview of strategies for synthetic d-xylose signaling circuits currently implemented in S. cerevisiae. (A) The repression-type XylR-R is used to block gene expression in the absence of d-xylose by binding to its operator xylO-R, which induces expression in the presence of d-xylose. Note that variations of the position of xylO-R in relation to the native elements can be used to tune the circuit strength [302]. (B) The yeast XylR-I strategy uses an E. coli activator-type XylR-I fused to activator domains. HSF1 is a mammalian heat shock factor 1 transactivation domain [308] and VPR is mammalian VP64-p65-Rta [309]. XylR-I is activated in the presence of d-xylose and binds to the xylO-I operator in the synthetic promoter and the activator domains recruit RNA polymerase II that initiates transcription. In the absence of d-xylose, XylR-I is inactivated and does not drive transcription. (C) The XylR-R/Med2p strategy combines elements from XylR-R and XylR-I by using a XylR-R fused to the Med2p activator domain. By positioning the xylO-R site upstream of the native promoter elements in the synthetic promoter, the circuit will be activated and drive gene expression in the absence of d-xylose. Presence of d-xylose will lead to XylR-R/Med2p deactivation and native levels of gene expression driven by the native operators of the promoter will occur. (D) The semi-synthetic XYL regulon utilizes a signaling protein (Gal3p) in the d-galactose regulon to respond to d-xylose (Gal3pmut). The native signaling in the regulon is kept intact but will now respond to d-xylose in addition to d-galactose. Solid arrows with arrowheads: induction; solid arrows with hammerheads: repression; dashed arrow with arrowhead: gene expression; orange pentagon: d-xylose. UAS: upstream activating sequence; TATA: TATA-box cis-regulatory element; YFG: Your Favorite Gene. Adapted from [259,302,303,306].
Figure 1
Figure 1
Overview of the four heterologous d-xylose pathways that have been introduced in S. cerevisiae to date, and their connections to glycolysis and the TCA cycle. G6P: glucose-6-phosphate; F6P: fructose-6-phosphate; F1,6bP: fructose-1,6-bisphosphate; DHAP: dihydroxyacetone phosphate; G3P: glyceraldehyde 3-phosphate; PEP: phosphoenolpyruvate; XK: Xylulokinase; TCA cycle: tricarboxylic acid cycle.
Figure 2
Figure 2
Overview of the key signal transduction events in three major sugar signaling pathways (Snf3p/Rgt2p, cAMP/PKA, SNF1/Mig1p) in S. cerevisiae and their connection to d-glucose and d-xylose metabolism. The XR/XDH and XI pathways are also shown in detail, whereas only the major connections are shown for the Weimberg and Dahms pathways. Three different carbon source availability cases are depicted: no d-glucose, low d-glucose and high d-glucose concentrations. Colored shapes: proteins under the control of the signaling pathway of the same color. Arrows with arrowheads: induction; arrows with hammerheads: repression; dashed arrows: signaling; solid arrows: metabolic or transport reactions; circles with P: phosphorylation (the color of the circle indicates which signaling pathway controls the phosphorylation); circles with Ub: ubiquitination; yellow hexagons: d-glucose; grey hexagons: d-fructose. Green shapes: Snf3p/Rgt2p pathway; blue shapes: cAMP/PKA pathway; orange shapes: SNF1/Mig1p pathway; white shapes (Ssn6p-Tup1p, Sko1p, Med8p): transcription factors involved with basal transcription machinery, high osmolarity/glycerol (HOG) pathway and Hxk2p-activated gene regulation, respectively. Zig-zag lines attached to Yck1/2p and Ras1/2p indicate membrane anchoring. See text in Section 3 for more details. Adapted from [77,78,79].
Figure 3
Figure 3
The High osmolarity/glycerol (HOG) pathway and the filamentous growth pathways respond to high d-glucose concentrations (high osmotic stress) and low d-glucose concentrations (nutrient starvation), respectively. The two pathways share many elements, due to Sho1p being involved in sensing both nutrient starvation and osmotic stress. Both pathways belong to the MAPK signaling pathways that transmit the regulatory signals through phosphorylation of target proteins. Note that all the MAPK pathway targets undergo activation and deactivation by phosphorylation, but that only Sko1p has been illustrated with these details in order to facilitate comparison with its activity in Figure 1. MAPK: mitogen activated protein kinase; MAPKK: mitogen activated protein kinase-kinase; MAPKKK: mitogen activated protein kinase-kinase-kinase. Arrows with arrowheads: induction; arrows with hammerheads: repression; dashed arrows: signaling. Yellow shapes: MAPK pathways (HOG1 and filamentous growth pathway); blue shapes: cAMP/PKA pathway elements; orange shapes: SNF1/Mig1p pathway elements; white shapes: proteins from other pathways. Adapted from [85,171,172].
Figure 5
Figure 5
Schematic view of the biosensors constructed by Brink et al. [194] and the comparison of the effect of high d-glucose, low d-glucose and high d-xylose condition in the biosensors (heat map). (A). Fluorescent biosensors were constructed to assay the transcriptional effect of the three main sugar signaling pathways in the presence of d-xylose or d-glucose by coupling the promoters of signaling pathway target genes with a green fluorescent protein (GFP). (B). By following and quantifying the fluorescence intensity of the biosensor strains over time with flow cytometry, the known repression and induction conditions of the chosen promoters during presence of d-glucose were confirmed [107,224,225,226] and subsequently used to analyze the response to d-xylose in XR/XDH engineering strains [77,222].
Figure 6
Figure 6
Model of d-xylose sensing and signaling in S. cerevisiae compared to known d-glucose signaling events. d-Xylose may be sensed by Snf3p, but not by Rgt2p or Gpr1p. d-Xylose metabolism has been shown to result in a decreased glycolytic flux when compared to d-glucose [238,239], which in turn will affect the concentration and signaling strength of the glycolytic intermediates G6P (glucose-6-phosphate), F6P (fructose-6-phosphate) and F1,6bP (fructose-1,6-bis-phosphate). Hxk2p is phosphorylated in two different positions depending on the origin of the signal: phosphorylated in Ser15 by SNF1, and autophosphorylated in Ser158, triggered by absence of d-glucose and presence of d-xylose, respectively [36]. Dashed purple arrows: d-xylose signaling; dashed orange arrows: d-glucose signaling; black dashed arrows: downstream signaling events (irrespective of sugar stimulus); arrows with arrowheads: induction or activation; arrows with hammerheads: repression or deactivation; solid arrows: metabolic or transport reactions; circles with P: phosphorylations (the color of the circle indicate which signaling pathway controls the phosphorylation); purple pentagons: d-xylose; yellow hexagons: d-glucose. Green shapes: Snf3p/Rgt2p pathway; blue shapes: cAMP/PKA pathway; orange shapes: cAMP/PKA pathway. Partially adapted from [79].

Similar articles

Cited by

References

    1. Abril M.A., Michan C., Timmis K.N., Ramos J.L. Regulator and Enzyme Specificities of the Tol Plasmid-Encoded Upper Pathway for Degradation of Aromatic-Hydrocarbons and Expansion of the Substrate Range of the Pathway. J. Bacteriol. 1989;171:6782–6790. doi: 10.1128/jb.171.12.6782-6790.1989. - DOI - PMC - PubMed
    1. Klemba M., Jakobs B., Wittich R.M., Pieper D. Chromosomal integration of tcb chlorocatechol degradation pathway genes as a means of expanding the growth substrate range of bacteria to include haloaromatics. Appl. Environ. Microbiol. 2000;66:3255–3261. doi: 10.1128/AEM.66.8.3255-3261.2000. - DOI - PMC - PubMed
    1. Müller J.E.N., Meyer F., Litsanov B., Kiefer P., Potthoff E., Heux S., Quax W.J., Wendisch V.F., Brautaset T., Portais J.C., et al. Engineering Escherichia coli for methanol conversion. Metab. Eng. 2015;28:190–201. doi: 10.1016/j.ymben.2014.12.008. - DOI - PubMed
    1. Löwe H., Schmauder L., Hobmeier K., Kremling A., Pfluger-Grau K. Metabolic engineering to expand the substrate spectrum of Pseudomonas putida toward sucrose. MicrobioliologyOpen. 2017;6:e00473. doi: 10.1002/mbo3.473. - DOI - PMC - PubMed
    1. Hong K.K., Nielsen J. Metabolic engineering of Saccharomyces cerevisiae: A key cell factory platform for future biorefineries. Cell. Mol. Life Sci. 2012;69:2671–2690. doi: 10.1007/s00018-012-0945-1. - DOI - PMC - PubMed

MeSH terms

LinkOut - more resources