. 2021 Nov 18;22(22):12461.
doi: 10.3390/ijms222212461.

Osteopontin Deficiency Ameliorates Prostatic Fibrosis and Inflammation

Affiliations

Osteopontin Deficiency Ameliorates Prostatic Fibrosis and Inflammation

Petra Popovics et al. Int J Mol Sci. .

Abstract

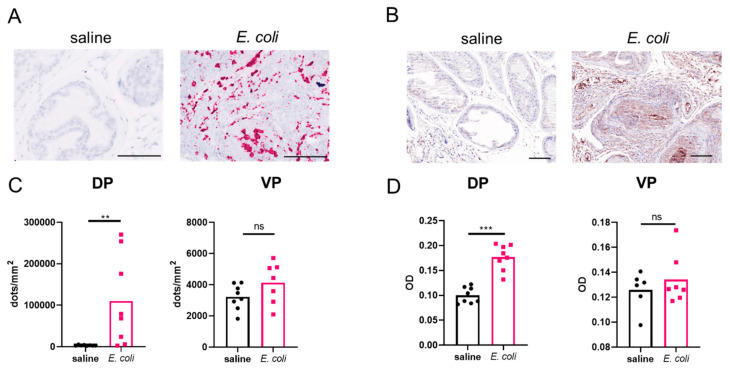
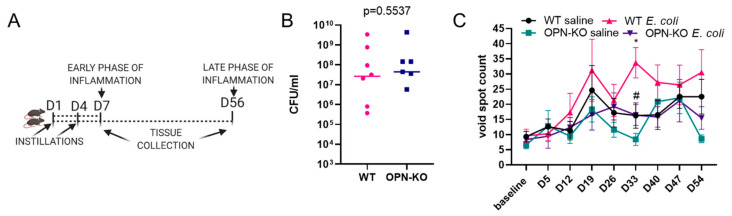
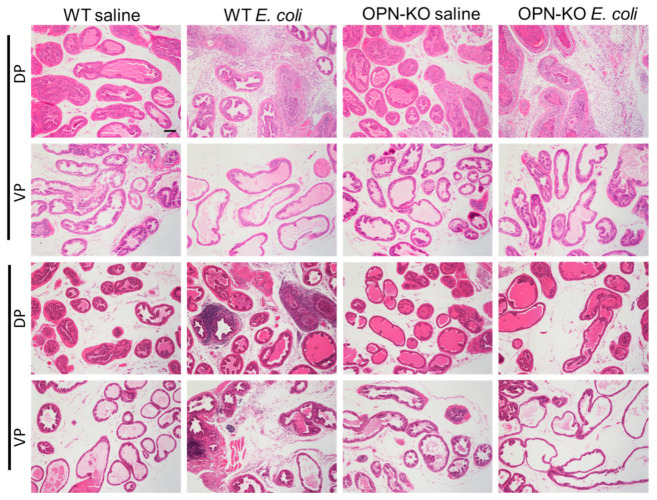
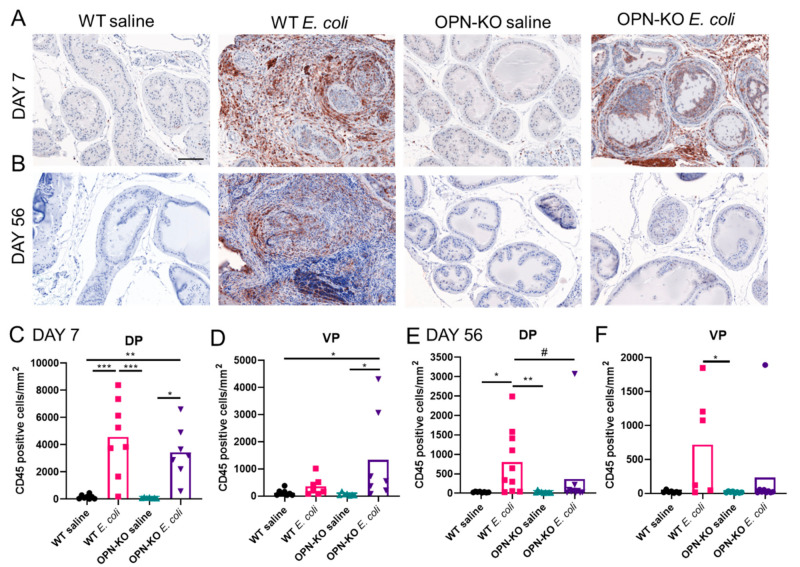
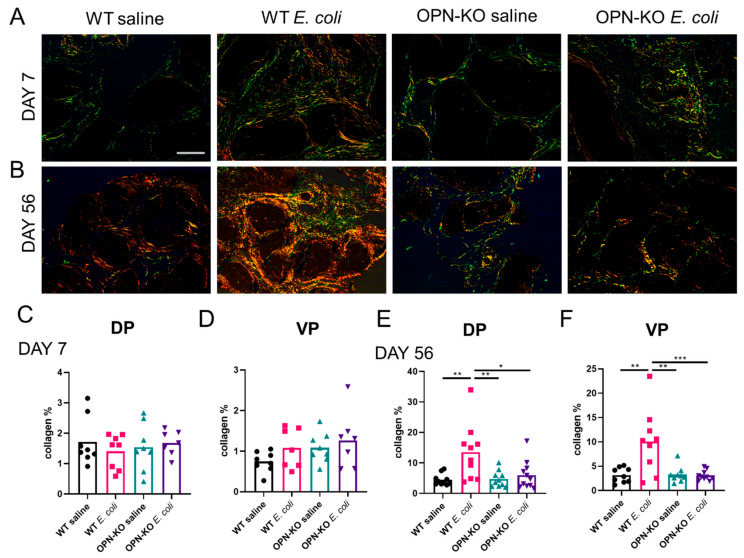
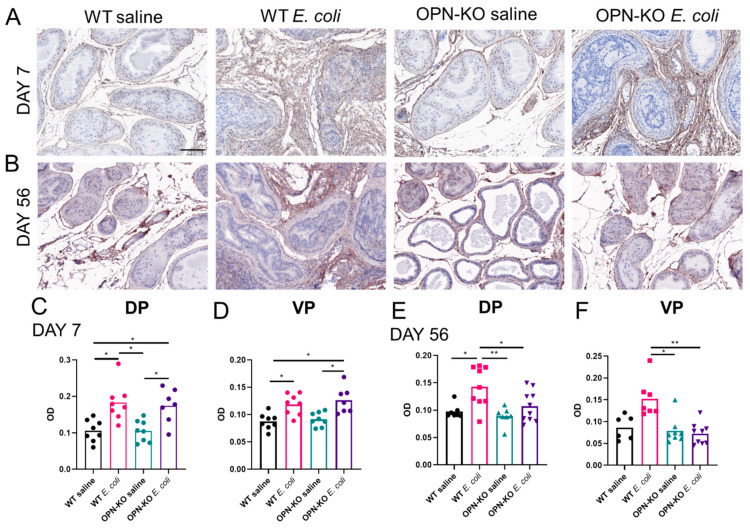
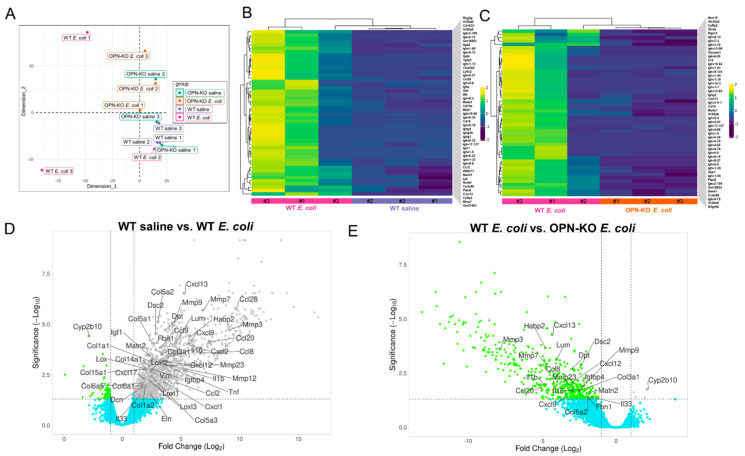
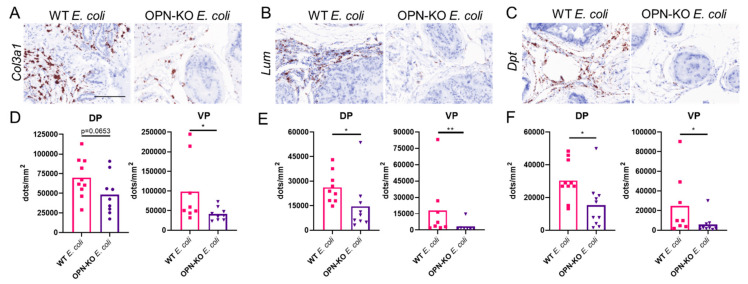
Fibrogenic and inflammatory processes in the prostate are linked to the development of lower urinary tract symptoms (LUTS) in men. Our previous studies identified that osteopontin (OPN), a pro-fibrotic cytokine, is abundant in the prostate of men with LUTS, and its secretion is stimulated by inflammatory cytokines potentially to drive fibrosis. This study investigates whether the lack of OPN ameliorates inflammation and fibrosis in the mouse prostate. We instilled uropathogenic E. coli (UTI89) or saline (control) transurethrally to C57BL/6J (WT) or Spp1tm1Blh/J (OPN-KO) mice and collected the prostates one or 8 weeks later. We found that OPN mRNA and protein expression were significantly induced by E. coli-instillation in the dorsal prostate (DP) after one week in WT mice. Deficiency in OPN expression led to decreased inflammation and fibrosis and the prevention of urinary dysfunction after 8 weeks. RNAseq analysis identified that E. coli-instilled WT mice expressed increased levels of inflammatory and fibrotic marker RNAs compared to OPN-KO mice including Col3a1, Dpt, Lum and Mmp3 which were confirmed by RNAscope. Our results indicate that OPN is induced by inflammation and prolongs the inflammatory state; genetic blockade of OPN accelerates recovery after inflammation, including a resolution of prostate fibrosis.

Keywords: benign prostatic hyperplasia; chronic inflammation; extracellular matrix; lower urinary tract symptoms; prostatic fibrosis.


Conflict of interest statement

The authors declare no conflict of interest.

Figures

Figure 1
Figure 1
Spp1 gene expression and osteopontin (OPN) protein levels are induced in bacterial prostatic inflammation. Both mRNA and protein expression significantly increase in response to bacterial instillation in the dorsal (DP) but not in the ventral prostate (VP). Panel (A,C) show RNAscope staining and signal quantification, respectively. Images were captured at 40× magnification. Panel (B,D) show immunohistochemistry staining and optical density, respectively (OD). RNAscope signal was normalized to tissue area, and OPN OD was quantified by inForm software. Images were captured at 20× magnification. Ns: not significant. Scale represents 100 µm. ** p < 0.01; *** p < 0.001.
Figure 2
Figure 2
E. coli-induced urinary dysfunction is ameliorated in osteopontin knockout (OPN-KO) mice. Panel (A) shows experimental set up for the acute and chronic inflammatory time points. Wild type (WT) or OPN-KO mice were transurethrally instilled with E. coli or saline two times, 3 days apart, and were euthanized at day 7 (acute inflammation) or 56 (chronic inflammation). Panel (B) shows that colony forming units (CFUs) in free-catch urine were not significantly different between WT and OPN-KO mice 24 h after instillation. One data point from each group was zero, and these were not added to the figure but were included in the statistical analysis. Panel (C) shows void spot counts sized 0–0.1 cm2 measured weekly throughout the course of the chronic experimental set up. Significant differences were found WT saline vs. WT E. coli (*) and WT E. coli vs. OPN-KO E coli (#) at day 33 using Mann–Whitney test. *,# p < 0.05.
Figure 3
Figure 3
Histological inflammation resolves in osteopontin knockout (OPN-KO) mice. Seven days after the first E. coli instillation, the stroma is occupied by inflammatory cells, and multiple layers of epithelial and smooth muscle cells develop in both wild type (WT) and OPN-KO mice in the dorsal prostate (DP). No visible inflammation is seen in the ventral prostate (VP). After 2 months, inflammatory cells persist in WT mice in the DP and also infiltrate the VP, but the normal prostate histology is restored in the majority of OPN-KO mice. Images were captured at 20× magnification. Scale represents 100 µm.
Figure 4
Figure 4
Inflammatory cell numbers decrease over time in osteopontin knockout (OPN-KO) mice. Panels (A,B) show representative images of CD45 staining 7 and 56 days after the first E. coli- or saline instillation. Panels (C,D) show comparison of CD45+ counts across experimental groups in the dorsal (DP) and the ventral prostate (VP) at day 7. Panels (E,F) show comparison of CD45+ cell numbers in saline and E. coli-instilled wild type (WT) and OPN-KO mice 56 days after the initiation of the experiment. CD45+ cells were identified using immunohistochemistry and were counted and normalized to tissue area. Images were captured at 20× magnification. Scale represents 100 µm. * multiple analysis with Kruskal–Wallis test, # pair-wise comparison with Mann–Whitney test between WT E. coli and OPN-KO E. coli mice. *,# p < 0.05; ** p < 0.01; *** p < 0.001.
Figure 5
Figure 5
The inflammation-induced surge in collagen abundance is suppressed in osteopontin knockout (OPN-KO) mice. Panel (A) shows that signs of an increase in collagen abundance were observed in the dorsal prostate (DP) one week after E. coli-instillation, but quantification of collagen % did not identify significant changes in either the DP or the ventral prostate (VP) (C,D). Panel (B) shows an example of the DP two months after infection, and Panels (E,F) identify significant increase in collagen content and reduction in OPN-KO mice in both the DP and the VP. Significance was calculated using One-way ANOVA with Tukey’s post-hoc test. Images were captured at 40× magnification. Scale represents 100 µm. * p < 0.05; ** p < 0.01; *** p < 0.001.
Figure 6
Figure 6
Inflammation-induced Col1a1 accumulation is ameliorated in osteopontin knockout (OPN-KO) mice. Panel (A) shows representative examples, and (C,D) demonstrate that Col1a1 optical density (OD) increases in both wild type (WT) and OPN-KO mice one week after bacterial instillation. Panel (B) demonstrates that Col1a1 abundance is visibly increased in WT mice, but not in OPN-KO mice 2 months after E. coli-instillation. Quantification of Col1a1 OD in the dorsal (DP) and the ventral prostate (VP) is shown in panels (E,F), respectively. Significance was tested using Kruskal–Wallis test. Images were captured at 20× magnification. Scale represents 100 µm. * p < 0.05; ** p < 0.01.
Figure 7
Figure 7
Osteopontin (OPN) deficiency obliterates the chronic inflammatory and pro-fibrotic gene expression signature related to E. coli infection. Panel (A) shows an unsupervised multidimensional scaling plot based on RNA-seq of triplicate samples from wild type (WT) saline, WT E. coli, osteopontin knockout (OPN-KO) saline and OPN-KO E.coli experimental groups. This plot demonstrates that two of the three WT E. coli samples differ greatly from the rest of the tissues. Similarly, hierarchical clustering analyses shown in Panels (B,C) with WT saline vs. WT E. coli and WT E. coli vs. OPN-KO E. coli contrasts demonstrate that 2 tissues of the WT E. coli group cluster differently, which is likely due to a more robust inflammation developed in these samples compared to the third tissue. Panel (D) shows a volcano plot with selected pro-inflammatory and pro-fibrotic DEGs that are significantly increased in response to bacterial instillation in WT mice. We also highlighted a gene, Cyp2b10, that is downregulated in this condition. Panel (E) identifies which of the selected genes are downregulated (or upregulated in the case of Cyp2b10) in OPN-KO E. coli mice.
Figure 8
Figure 8
The pro-fibrotic genes, Col3a1, Lum and Dpt, are suppressed by osteopontin (OPN) deficiency. Panels (AC) are representative images, and (DF) show quantification of RNAscope staining of Col3a1, Lum and Dpt, respectively, in the dorsal (DP) and the ventral prostate (VP) from E. coli-instilled wild type (WT) and osteopontin knockout (OPN-KO) mice. Significance was tested using Mann–Whitney test. Images were captured at 40× magnification. Scale represents 100 µm. * p < 0.05; ** p < 0.01.

Similar articles

Cited by

References

    1. Lepor H. Pathophysiology of lower urinary tract symptoms in the aging male population. Rev. Urol. 2005;7((Suppl. S7)):S3–S11. - PMC - PubMed
    1. Lee S.W.H., Chan E.M.C., Lai Y.K. The global burden of lower urinary tract symptoms suggestive of benign prostatic hyperplasia: A systematic review and meta-analysis. Sci. Rep. 2017;7:7984. doi: 10.1038/s41598-017-06628-8. - DOI - PMC - PubMed
    1. Parsons J.K. Benign Prostatic Hyperplasia and Male Lower Urinary Tract Symptoms: Epidemiology and Risk Factors. Curr. Bladder Dysfunct. Rep. 2010;5:212–218. doi: 10.1007/s11884-010-0067-2. - DOI - PMC - PubMed
    1. Taub D.A., Wei J.T. The economics of benign prostatic hyperplasia and lower urinary tract symptoms in the United States. Curr. Urol. Rep. 2006;7:272–281. doi: 10.1007/s11934-996-0006-0. - DOI - PubMed
    1. Vuichoud C., Loughlin K.R. Benign prostatic hyperplasia: Epidemiology, economics and evaluation. Can. J. Urol. 2015;22:1–6. - PubMed

MeSH terms