. 2021 Nov 22;22(22):12582.
doi: 10.3390/ijms222212582.

Pro-Inflammatory Serum Amyloid a Stimulates Renal Dysfunction and Enhances Atherosclerosis in Apo E-Deficient Mice

Affiliations

Pro-Inflammatory Serum Amyloid a Stimulates Renal Dysfunction and Enhances Atherosclerosis in Apo E-Deficient Mice

Antony Gao et al. Int J Mol Sci. .

Abstract

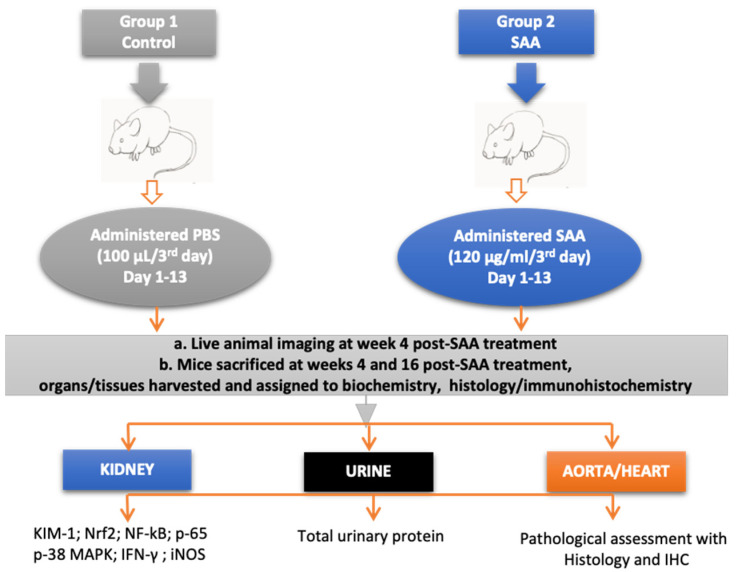
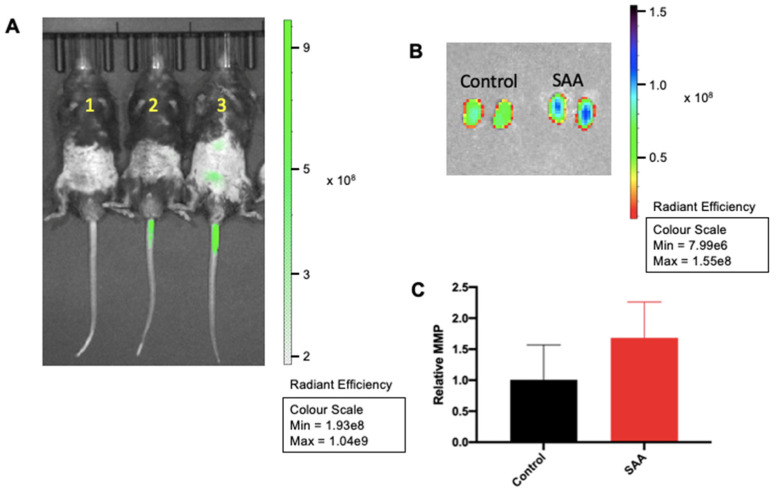
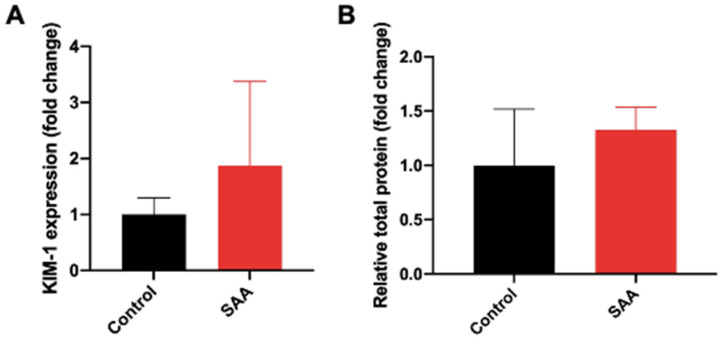
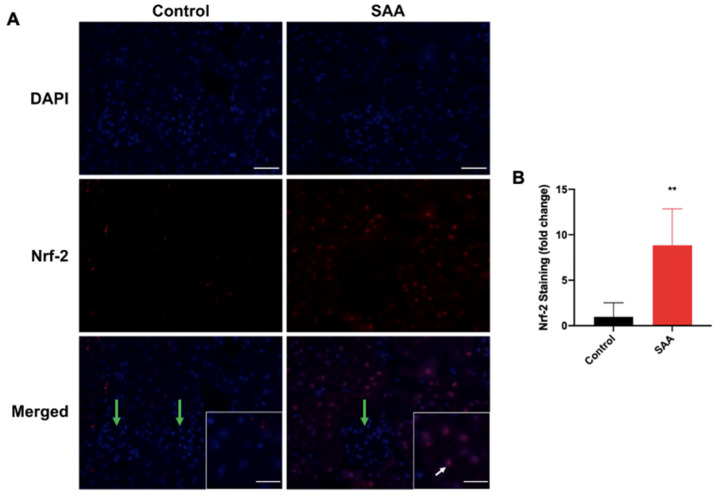
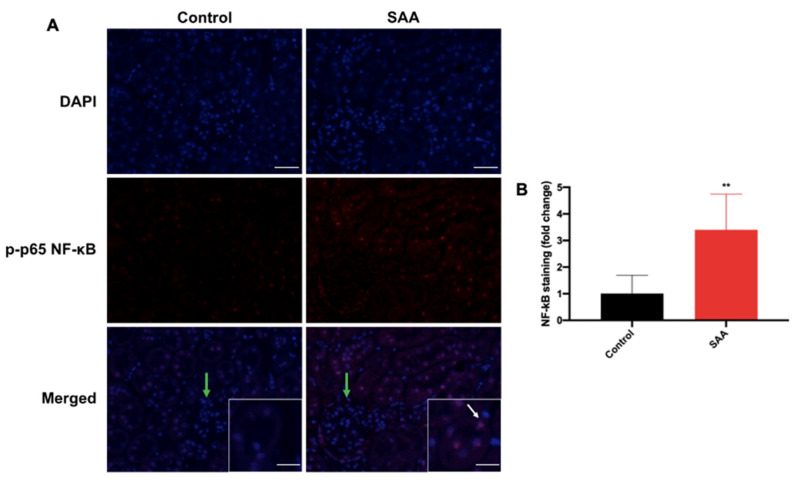
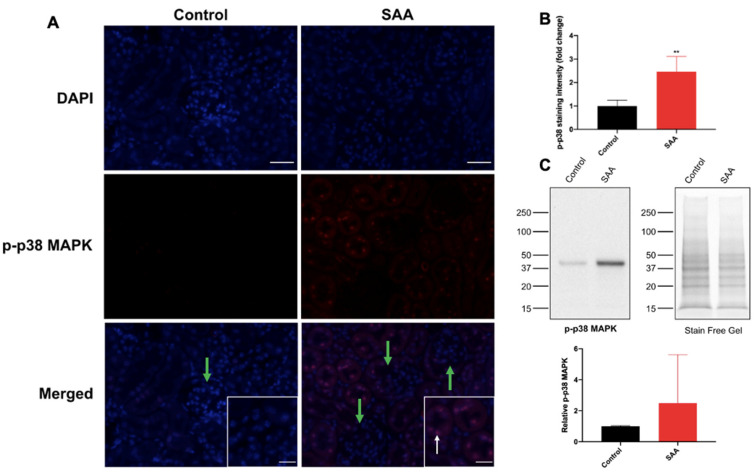
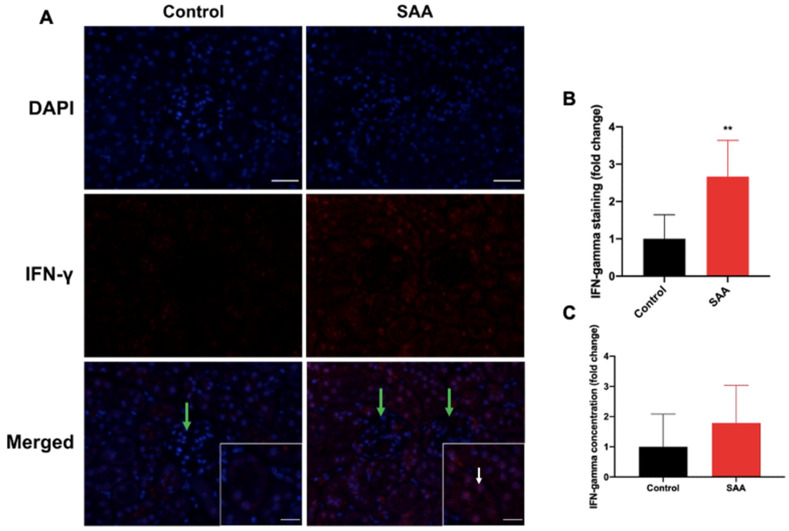
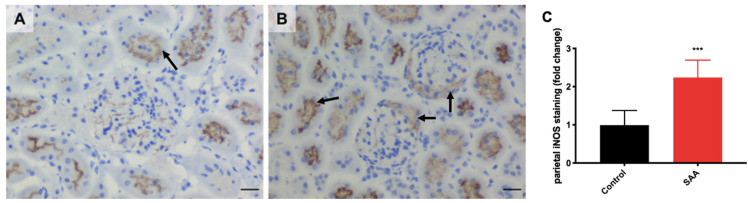
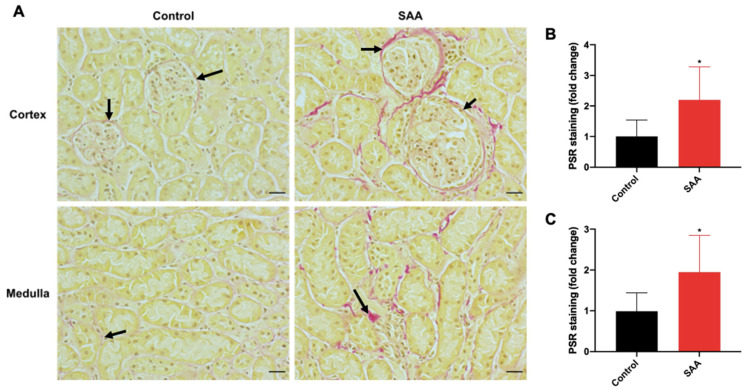
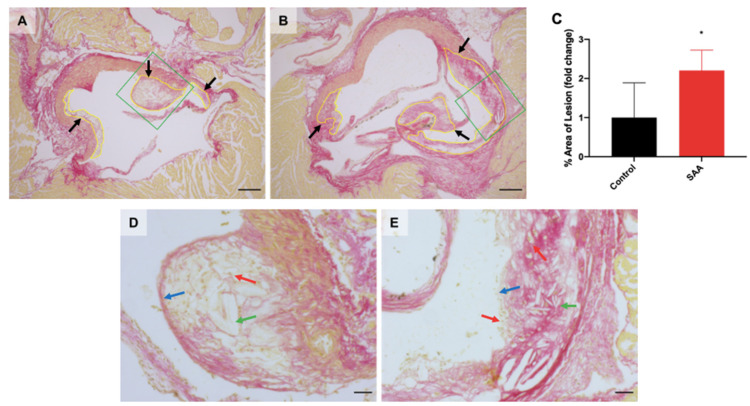
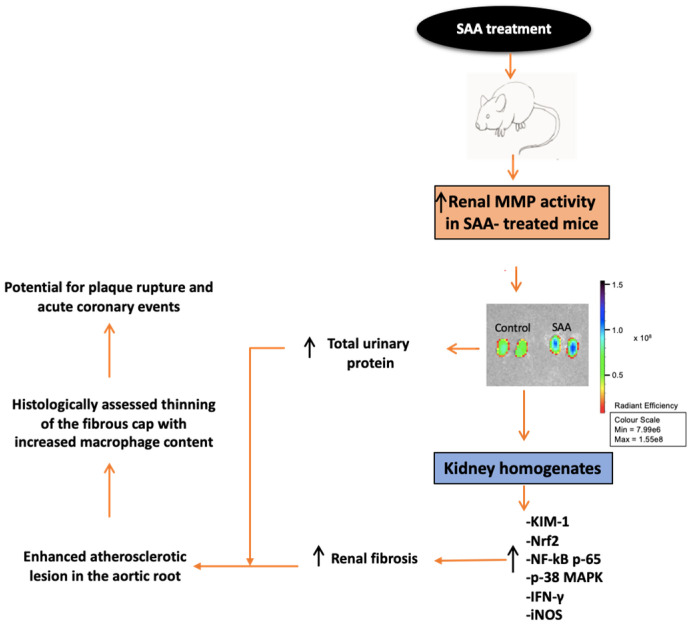
Acute serum amyloid A (SAA) is an apolipoprotein that mediates pro-inflammatory and pro-atherogenic pathways. SAA-mediated signalling is diverse and includes canonical and acute immunoregulatory pathways in a range of cell types and organs. This study aimed to further elucidate the roles for SAA in the pathogenesis of vascular and renal dysfunction. Two groups of male ApoE-deficient mice were administered SAA (100 µL, 120 µg/mL) or vehicle control (100 µL PBS) and monitored for 4 or 16 weeks after SAA treatment; tissue was harvested for biochemical and histological analyses at each time point. Under these conditions, SAA administration induced crosstalk between NF-κB and Nrf2 transcriptional factors, leading to downstream induction of pro-inflammatory mediators and antioxidant response elements 4 weeks after SAA administration, respectively. SAA treatment stimulated an upregulation of renal IFN-γ with a concomitant increase in renal levels of p38 MAPK and matrix metalloproteinase (MMP) activities, which is linked to tissue fibrosis. In the kidney of SAA-treated mice, the immunolocalisation of inducible nitric oxide synthase (iNOS) was markedly increased, and this was localised to the parietal epithelial cells lining Bowman's space within glomeruli, which led to progressive renal fibrosis. Assessment of aortic root lesion at the study endpoint revealed accelerated atherosclerosis formation; animals treated with SAA also showed evidence of a thinned fibrous cap as judged by diffuse collagen staining. Together, this suggests that SAA elicits early renal dysfunction through promoting the IFN-γ-iNOS-p38 MAPK axis that manifests as the fibrosis of renal tissue and enhanced cardiovascular disease.

Keywords: atherosclerosis; dysfunction; pro-inflammatory; renal; serum amyloid A.


Conflict of interest statement

The authors declare no conflict of interest.

Figures

Figure 1
Figure 1
Schematic figure summarising the experimental design and analytical approach to assess tissue isolated from control and SAA-stimulated mice.
Figure 2
Figure 2
SAA administration activates MMPsense activity in vivo. Male ApoE−/− mice were randomly allocated to vehicle control (administered 100 µL PBS every 3 days for 2 weeks) and the SAA group (administered 12 µg SAA protein every 3 days for 2 weeks). MMPsense (2 nmol–150 uL) was injected via tail vein 24 h prior and animals were imaged using IVIS® SpectrumCT (PerkinElmer). (A) In vivo mouse images after MMPsense injection (n = 3/group); mouse (1) control without MMP injection; (2) control with MMPsense injection and (3) SAA-treated with MMPsense injection. (B) Representative images of isolated kidneys from control and SAA group. After imaging, animals were sacrificed and organs harvested. Kidneys were isolated and imaged using IVIS® SpectrumCT (PerkinElmer) for MMS sense activity. (C) MMPsense signal intensity in mice images was quantified using Living Image® (PerkinElmer) data analysis software.
Figure 3
Figure 3
Assessment of renal function following SAA administration. (A) Male ApoE−/− mice were randomly allocated to vehicle control (administered 100 µL PBS every 3 days for 2 weeks) and the SAA group (administered 12 µg SAA protein every 3 days for 2 weeks). Kidney tissue was harvested 4 weeks after cessation of treatment, and a portion of renal tissue was homogenised for biochemical analyses. An immunoassay ELISA kit to quantify renal KIM-1 expression was utilised to assess renal dysfunction. Reagents, standards and samples were prepared and assayed by ELISA as per the manufacturer’s instructions (Abcam). Absorbance values were measured at 450 nm with values for concentration calculated from the standard curve generated. (B) Total urinary protein concentration; all data shown as relative mean ± SD.
Figure 4
Figure 4
SAA administration stimulates Nrf2 expression in the renal cortical tissue. (A) Male ApoE−/− mice were randomly allocated to vehicle control (administered 100 µL PBS every 3 days for 2 weeks) and the SAA group (administered 12 µg SAA protein every 3 days for 2 weeks). Kidney tissue was harvested 4 weeks after cessation of treatment and fixed in situ before embedding and sectioning (5 µm). Renal sections were dewaxed and rehydrated before undergoing heat-induced antigen retrieval. Cortical Nrf2 expression was assessed using immunofluorescence microscopy. Slides were visualised at 40× magnification (scale bar = 20 μm); images are representative of at least 4 fields of view for each sample. Nuclei were stained with DAPI (blue) and Nrf2 with an appropriate Opal fluorophore (red). White arrows show regions of relatively high tubular Nrf2+ immunostaining. Green arrows show regions of relatively low glomerular Nrf2+ immunostaining. Insets show higher magnification images (scale bar = 10 μm), Nrf2+ staining was mixed with Nrf2 colocalised to nuclei with residual cytoplasmic staining. Representative images show cortical fields from n = 5 (Control), n = 6 (SAA). (B) Immunostaining was quantified using a mean staining intensity for each field of view and averaged for each sample. Data shown as relative mean ± SD. ** Relative to control group; p < 0.05.
Figure 5
Figure 5
SAA administration stimulates NF-kB p-p65 in the renal cortical tissue. Male ApoE−/− mice were randomly allocated to vehicle control (administered 100 µL PBS every 3 days for 2 weeks) and the SAA group (administered 12 µg SAA protein every 3 days for 2 weeks). Kidney tissue was harvested 4 weeks after cessation of treatment and fixed in situ before embedding and sectioning (5 µm). Renal sections were dewaxed then rehydrated before undergoing heat-induced antigen retrieval. (A) NF-kB p-p65 expression was assessed using immunofluorescence microscopy. Slides were visualised at 40× magnification (scale bar = 20 µm); images are representative of at least 4 fields of view for each sample. Nuclei were stained with DAPI (blue) and NF-kB p-p65 with an appropriate Opal fluorophore (red). White arrows show NF-kB+ staining localised to renal epithelial cells and not in the glomerular endothelium (glomeruli indicated by green arrow). Insets show higher magnification (scale bar = 10 µm) images of renal tubular epithelial cells with NF-kB p-p65+ staining largely colocalised to nuclei with some residual cytoplasmic staining. Representative images show cortical fields from n = 5 (control), n = 6 (SAA). (B) Immunostaining was quantified using a mean staining intensity for each field of view and averaged for each sample. Data shown as relative mean ± SD. ** Different to the control group; p < 0.001.
Figure 6
Figure 6
SAA administration stimulates p-p38 MAPK expression in the renal cortical tissue. (A) Male ApoE−/− mice were randomly allocated to vehicle control (administered 100 µL PBS every 3 days for 2 weeks) and the SAA group (administered 12 µg SAA protein every 3 days for 2 weeks). Kidneys were harvested 4 weeks after treatment cessation and fixed in situ before embedding and sectioning (5 µm). Renal sections were dewaxed then rehydrated before undergoing heat-induced antigen retrieval. NF-kB p-p65 expression was assessed using immunofluorescence microscopy. Slides were visualised at 40× magnification (scale bar = 20 µm); images are representative of at least 4 fields of view for each sample. Nuclei were stained with DAPI (blue) and p-p38 MAPK with an appropriate Opal fluorophore (red). White arrow indicates p-p38 MAPK+ staining localised to renal epithelial cells, which was absent in glomerular endothelium (glomeruli indicated by green arrow). Insets show higher magnification (scale bar = 10 µm) images of renal tubular epithelial cells with p-p38 MAPK+ staining colocalised to nuclei with some cytoplasmic staining. Representative images show cortical fields from n = 5 (control), n = 6 (SAA). (B) Immunostaining was quantified using a mean staining intensity for each field of view and averaged for each sample; data shown as relative mean ± SD. ** Different to control group; p < 0.001. (C) Western blot analyses of p-p38 MAPK were performed as described in the methods section. Homogenised renal tissue (20 µg protein) from the control and SAA groups were separated by SDS-PAGE. Proteins were transferred onto a membrane, blocked, then incubated with the appropriate antibodies. Membranes were imaged, and bands at 38 kD corresponding to p-p38 MAPK were identified and quantified using densitometry (ImageLab, version 6.0.1). All density data were normalised with total protein loading determined from corresponding stain free gel images. Data shown as relative mean ± SD.
Figure 7
Figure 7
SAA administration stimulates IFN-γ expression in the renal cortical tissue. (A) Male ApoE−/− mice were randomly allocated to vehicle control (administered 100 µL PBS every 3 days for 2 weeks) and the SAA group (administered 12 µg SAA protein every 3 days for 2 weeks). Kidney tissue was harvested 4 weeks after cessation of treatment and fixed in situ before embedding and sectioning (5 µm). Renal sections were dewaxed then rehydrated before undergoing heat-induced antigen retrieval. IFN-γ localisation was assessed using immunofluorescence microscopy. Slides were visualised at 40× magnification (scale bar = 20 µm); images are representative of at least 4 fields of view for each sample. Nuclei were stained with DAPI (blue) and IFN-γ with an appropriate Opal fluorophore (red). White arrow indicates IFN-γ staining primarily localised to renal epithelial cells and minimally in the glomerular endothelium (glomeruli indicated by green arrow). Insets show higher magnification (scale bar = 10 µm) images of renal tubular epithelial cells with IFN-γ staining largely colocalised to nuclei with some residual cytoplasmic staining. Representative images show cortical fields from n = 5 (control), n = 6 (SAA). (B) Immunostaining was quantified using a mean staining intensity for each field of view and averaged for each sample. Data shown as relative mean ± SD. ** Different to the control group; p < 0.001. (C) An ELISA kit was utilised to quantify renal IFN-γ as described in the methods section. Results shown as relative mean ± SD.
Figure 8
Figure 8
SAA administration stimulates iNOS expression in the renal cortical tissue. Male ApoE−/− mice were randomly allocated to (A) the vehicle control group (administered 100 µL PBS every 3 days for 2 weeks) and (B) the SAA group (administered 12 µg SAA protein every 3 days for 2 weeks). Kidney tissue was harvested 4 weeks after cessation of treatment and fixed in situ before embedding and sectioning (5 µm). Renal sections were dewaxed then rehydrated before undergoing heat-induced antigen retrieval. iNOS expression was assessed using immunohistochemistry and light microscopy. Slides were visualised using an Axio Scope.A1 light microscope at 40× magnification (scale bar = 20 µm); images are representative of at least 4 fields of view for each sample. For all images shown, nuclei are stained with haematoxylin (appearing as blue), and iNOS with DAB (appearing as brown). Black arrows indicate iNOS+ immunostaining (DAB positive) localised to epithelial cell brush borders and to the parietal epithelial cells lining the inner surface of Bowman’s space in the SAA group. Representative images show iNOS+ immunostaining in renal cortical fields from n = 5 (control), n = 6 (SAA). (C) Parietal iNOS+ staining within the glomeruli was quantified using mean grey value and an optical density calculation for each field of view and averaged for each sample. Data shown as relative mean ± SD. *** Different to the control group; p < 0.0001.
Figure 9
Figure 9
SAA administration causes long-term fibrotic changes in kidneys. (A) Male ApoE−/− mice were randomly allocated to vehicle control (administered 100 µL PBS every 3 days for 2 weeks) and the SAA group (administered 12 µg SAA protein every 3 days for 2 weeks). Kidney tissue was harvested 14 weeks after cessation of treatment and fixed in situ before embedding and sectioning (5 µm). Renal sections were dewaxed then rehydrated before staining with haematoxylin and picrosirius red (PSR) solution. Renal fibrosis was assessed using the PSR stain for collagen. Slides were visualised using an Axio Scope.A1 light microscope at 40× magnification (scale bar = 20 µm); images are representative of at least 4 fields of view for each sample. For all images shown, nuclei are stained with haematoxylin (brown), and collagen with PSR (red). Black arrows indicate PSR staining localised to the parietal epithelial cells lining the outer surface of Bowman’s space and the interstitial spaces in the SAA group. Representative images show PSR+ staining in renal cortical and medullary fields from n = 8 (control), n = 6 (SAA). PSR staining in the (B) cortical and (C) medullary regions were quantified using thresholding tools for each field of view and averaged for each sample. Data shown as relative mean ± SD. * Different to the control group; p < 0.05.
Figure 10
Figure 10
SAA administration causes atherosclerotic lesion development at aortic valve leaflets. Male ApoE−/− mice were randomly allocated to (A) the vehicle control (administered 100 µL PBS every 3 days for 2 weeks) and (B) the SAA group (administered 12 µg SAA protein every 3 days for 2 weeks). The aortic sinus from each mouse was harvested 16 weeks after cessation of SAA treatment and fixed in situ before embedding and sectioning (5 µm). Aortic sections were dewaxed then rehydrated before staining with haematoxylin and picrosirius red (PSR) solution. Slides were visualised using an Axio Scope.A1 light microscope at 5× magnification (scale bar = 200 µm). For all images shown, cardiac muscle tissue is stained with haematoxylin (brown) and collagen with PSR (red). The black arrows and yellow outlines indicate lesion formation localised at the root of the valve leaflets. The green polygons indicate the field of view magnified at 20×. Representative images show atherosclerotic lesion formation from n = 5 (control), n = 7 (SAA). (C) The total lesion size for each sample was quantified using a freehand drawing tool (ImageJ, version 2.0) and calculated as percentage of total area. Data shown as relative mean ± SD. * Different to the control group; p < 0.05. High magnification (20×, scale bar = 40 µm) images of atherosclerotic lesions at the aortic roots in the vehicle control (D) and SAA groups (E) were obtained at the fibrous caps (blue arrows) where foam cells (red arrows) and cholesterol clefts (green arrows) can be visualised.
Figure 11
Figure 11
Schematic flow chart summarising the biological implications to kidney and vasculature in mice stimulated with pathological amounts of SAA that simulated an acute phase response over 2 weeks, with follow up at 4 and 16 weeks after cessation of the 2-week period of SAA administration in mice.

Similar articles

Cited by

References

    1. Thomas S.R., Witting P.K., Drummond G.R. Redox control of endothelial function and dysfunction: Molecular mechanisms and therapeutic opportunities. Antioxid. Redox Signal. 2008;10:1713–1765. doi: 10.1089/ars.2008.2027. - DOI - PubMed
    1. Jourde-Chiche N., Fakhouri F., Dou L., Bellien J., Burtey S., Frimat M., Jarrot P.-A., Kaplanski G., Quintrec M.L., Pernin V., et al. Endothelium structure and function in kidney health and disease. Nat. Rev. Nephrol. 2019;15:87–108. doi: 10.1038/s41581-018-0098-z. - DOI - PubMed
    1. Deanfield J.E., Halcox J.P., Rabelink T.J. Endothelial function and dysfunction: Testing and clinical relevance. Circulation. 2007;115:1285–1295. doi: 10.1161/CIRCULATIONAHA.106.652859. - DOI - PubMed
    1. Hashimoto K., Kataoka N., Nakamura E., Tsujioka K., Kajiya F. Oxidized LDL specifically promotes the initiation of monocyte invasion during transendothelial migration with upregulated PECAM-1 and downregulated VE-cadherin on endothelial junctions. Atherosclerosis. 2007;194:e9–e17. doi: 10.1016/j.atherosclerosis.2006.11.029. - DOI - PubMed
    1. Maguire E.M., Pearce S.W.A., Xiao Q. Foam cell formation: A new target for fighting atherosclerosis and cardiovascular disease. Vasc. Pharmacol. 2019;112:54–71. doi: 10.1016/j.vph.2018.08.002. - DOI - PubMed

MeSH terms