. 2021 Nov 11;13(22):5632.
doi: 10.3390/cancers13225632.

The Large GTPase, GBP-2, Regulates Rho Family GTPases to Inhibit Migration and Invadosome Formation in Breast Cancer Cells

Affiliations

The Large GTPase, GBP-2, Regulates Rho Family GTPases to Inhibit Migration and Invadosome Formation in Breast Cancer Cells

Geoffrey O Nyabuto et al. Cancers (Basel). .

Abstract

Breast cancer is the most common cancer in women. Despite advances in early detection and treatment, it is predicted that over 43,000 women will die of breast cancer in 2021. To lower this number, more information about the molecular players in breast cancer are needed. Guanylate-Binding Protein-2 has been correlated with better prognosis in breast cancer. In this study, we asked if the expression of GBP-2 in breast cancer merely provided a biomarker for improved prognosis or whether it actually contributed to improving outcome. To answer this, the 4T1 model of murine breast cancer was used. 4T1 cells themselves are highly aggressive and highly metastatic, while 67NR cells, isolated from the same tumor, do not leave the primary site. The expression of GBP-2 was examined in the two cell lines and found to be inversely correlated with aggressiveness/metastasis. Proliferation, migration, and invadosome formation were analyzed after altering the expression levels of GBP-2. Our experiments show that GBP-2 does not alter the proliferation of these cells but inhibits migration and invadosome formation downstream of regulation of Rho GTPases. Together these data demonstrate that GBP-2 is responsible for cell autonomous activities that make breast cancer cells less aggressive.

Keywords: GTPase; Guanylate-Binding Protein; Rho; breast cancer; cytoskeleton; invadosome; migration.


Conflict of interest statement

The authors declare that they have no conflict of interest.

Figures

Figure 1
Figure 1
GBP-2 correlates with better recurrence-free (RFS), overall survival (OS), and distance metastasis-free survival (DMFS) in human breast cancers. (A) The probability of RFS versus time for breast cancers of all types, stages, and grades was plotted for those tumors with high and low levels of GBP-2 expression. (B) The OS of patients of patients with all subtypes, stages, and grades was plotted for those tumors with high versus low GBP-2 expression versus time. (C) RNA seq data was used to confirm the array data for GBP-2 and RFS. (D) RNA seq data was used to confirm the array data for GBP-2 and OS. (E) The correlation between GBP-2 expression and DMSF was plotted.
Figure 2
Figure 2
mGBP-2 expression inversely correlates with migration and proliferation in murine TNBC cell lines. (A) Lysates from 4T1 and 67NR cells (20 μg) were analyzed for mGBP-2 and actin by western immunoblot (WB). A representative blot is shown (n = 3). mGBP-2 does not inhibit 4T1 or 67NR cell proliferation. (B) 4T1 cells (1 × 10⁶) were treated with 100 U/mL IFN-γ for the times indicated. Cells lysates (20 μg) were analyzed for mGBP-2 and actin by WB. A representative blot is shown (n = 3). (C) 4T1 cells (1.5 × 10⁴ cells/coverslip) were treated with IFN-γ (0, 100, 250, and 500 U/mL). After 72 h, Click-it chemistry was performed as described in Materials and Methods. The graph depicts the average percentage of EdU positive cells ± SD (p = 0.7165, n = 3). (D) 4T1 cells (1 × 10³ cells/dish) were treated with IFN-γ for 96 h. Cells were stained with crystal violet. Representative photomicrographs are shown. (E) All of the colonies with 50 or more cells were counted per plate and represented as average number of colonies per condition + SD (p = 0.3559, n = 2). (F) Lysates (20 μg) from 67NR cells expressing mGBP-2 shRNA (3A, 3B, and 3C) or control shRNA (sheGFP 2A and 2B) were analyzed for mGBP-2 and α-tubulin by WB. A representative gel is shown (n = 3). Data was analyzed as described and the ratio of mGBP-2 and α-tubulin densitometric values were represented as the average mGBP-2 expression ± S.D relative to control shRNA (shEGFP 2B) (****, p < 0.0001, n = 3). (G) 67NR cells containing sh eGFP 2A and two clones of mGBP-2 shRNA 3 (mGBP-2 shRNA 3B and mGBP-2 shRNA 3C) (3 × 10⁵ cells/coverslip) were cultured in duplicates in 6-well dishes analyzed for EdU incorporation as described. The graph depicts the average percentage of EdU positive cells ± SD (p = 0.0741, n = 3). n.s.= not signficant.
Figure 3
Figure 3
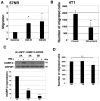
mGBP-2 inhibits 67NR cell migration but is not required for IFN-γ-mediated inhibition of migration. (A) Control, KD #1 and KD #2 67NR cells were seeded on Boyden chamber inserts coated with fibronectin. FBS (20%) in DMEM was added to the bottom well. Cells were allowed to migrate for 5 h. Membranes were processed and analyzed as described. All migrated cells were counted manually using ImageJ cell counter software. The graph presents the average migrated cells ± S.D. relative to control shRNA (sh eGFP 2A, which was assigned an arbitrary value of 1 (*, p < 0.05, n = 3). The number of control cells that migrated ranged between 573 and 2167. (B) 4T1 cells were pretreated with or without 100 U/mL IFN-γ for 24 h. They were then plated onto Boyden chambers in the presence or absence of IFN-γ and analyzed as described. The average number of migrated cells ± SD are shown (*, p < 0.05, n = 3). (C) Lysates from 4T1 cells expressing mGBP-2 shRNA or control shRNA (sh eGFP) and treated with 100 U/mL IFN-γ for 24 h, were analyzed for mGBP-2 and GAPDH. A representative blot is shown (n = 2). The ratio of mGBP-2 and GAPDH densitometric values were calculated and represented on the graph as the average mGBP-2 expression ± S.D relative to control shRNA (sh eGFP 2A), which was assigned an arbitrary value of 100 (***, p < 0.001, ****, p < 0.0001, n = 2). (D) 4T1 cells containing sh eGFP 2A, sh eGFP 2B, and two clones of mGBP-2 shRNA 3 (mGBP-2 shRNA 3A and mGBP-2 shRNA 3B) (5 × 10⁴) were pretreated with or without 100 U/mL IFN-γ for 24 h. The cells were plated onto Boyden chambers, allowed to migrate for 5 h, and analyzed as described. All migrated cells were counted using ImageJ software. The average number of migrated cells ± SD are shown (p = 0.5775, n = 2). n.s. = not significant.
Figure 4
Figure 4
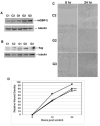
GBP-2 inhibits 4T1 cell migration. 4T1 cells were infected with lentivirus expressing flag-tagged GBP-2 as described in Methods. Cell lysates from two cell lines with control lentivirus (C1 and C2) and three lines (G1, G2, G3) with flag-tagged mGBP-2 were probed with either a polyclonal antisera (1851) against GBP-2 (panel A) or anti-Flag (panel B) and anti-α-tubulin. Representative images are shown (n = 2). (C). 4T1 cells ± GBP-2 were analyzed by wound healing assay for changes in migration, as described in Methods. Representative photomicrographs of wounds generated by scratch in C2, G2, and G3 cell monolayers at 0 and 24 h post scratch are shown at 10× magnification. (D). Results are presented as mean relative wound density ± SEM (n = 2; ***, p < 0.001). A square designates C2, a circle designates G2, and a triangle designates G3.
Figure 5
Figure 5
mGBP-2 alters the morphology of 67NR cells in vitro. (A). Control, KD #1, and KD #2 67NR cells were serum starved for 3 h. Cells were then incubated with warm 20% FBS in DMEM for 30 min. Cells were fixed, permeabilized, stained with Alexa fluor 594 phalloidin and 150 nM DAPI. Random fields were imaged on an EVOS FL Inverted Microscope at 40× using DAPI and Texas Red filters. Representative images are shown (Scale bars = 100 μm). (B). The number of projections of 100 control, KD #1, and KD #2 67NR cells were counted. The graph represents the average number of projections per cell + SEM (****, p < 0.0001 compared to control cells, n = 3). (C). The length of projections of 100 control, KD #1, and KD #2 67NR cells were measured. The graph represents the average length of projections per cell + SEM (****, p < 0.0001 compared to control cells, n = 3). (D). The elongation ratios of 100 control, KD #1, and KD #2 67NR cells were measured. The graph depicts the average percentage of cells with an elongation >2 + SEM (*, p < 0.05; **, p < 0.01 compared to control cells, n = 3).
Figure 6
Figure 6
mGBP-2 inhibits the activation of Rac1 and promotes the activation of CDC42 and RhoA. (A) Control, KD #1, and KD #2 67NR cells were serum starved for 12 h and then incubated with 20% FBS in DMEM for 30 min, lysed, and analyzed for active Rac1, CDC42, and RhoA as described in Methods. (BD) Immunoblots from PBD pulldowns were quantified and results for levels of each active Rho protein were normalized to their total cellular level and then set to 1 for control 67NR cells (*, p < 0.05; **, p < 0.01; ***, p < 0.001 compared to control cells; n = 3). Representative western blots are shown. (E) Control, KD #1, and KD #2 67NR cells were serum-starved for 18 h and then incubated with 20% FBS in DMEM for 30 min. Cell lysates were analyzed for phospho-Akt and total Akt. A representative blot is shown. (F) Scanned X-ray films were uploaded into Image J to measure densitometric values of pAkt and total Akt. The ratio of pAkt and total Akt densitometric values were calculated and represented on the graph as the average pAkt ± SD relative to control, which was assigned an arbitrary value of 1 (p = 0.7617 compared to control cells, n = 2). n.s.= not signficant.
Figure 7
Figure 7
mGBP-2 inhibits invadopodia formation. Cells plated on coverslips and allowed to adhere overnight, were treated with 1 μM PDBu for 30 min, fixed, and stained for cortactin, actin, and DAPI as described in Materials and Methods. (A) Images of invadipodia in the cell lines. (B) The percentage of cells containing invadipodia were determined for each cell type and represented as the mean ± SD (*, p < 0.05; ***, p < 0.001 compared to control cells; n = 3). Size bar = 10 µm.

References

    1. Breastcancer.org. U.S. Breast Cancer Statistics. [(accessed on 3 January 2019)]. Available online: www.breastcancer.org/symptoms/understand_bc/statistics2018.
    1. Siegel R.L., Miller K.D., Fuchs H.E., Jemal A. Cancer Statistics, 2021. CA Cancer J. Clin. 2021;71:7–33. doi: 10.3322/caac.21654. - DOI - PubMed
    1. Vestal D.J., Jeyaratnam J.A. The Guanylate-Binding Proteins: Emerging Insights into the Biochemical Properties and Functions of This Family of Large Interferon-Induced Guanosine Triphosphatase. J. Interf. Cytokine Res. 2011;31:89–97. doi: 10.1089/jir.2010.0102. - DOI - PMC - PubMed
    1. Britzen-Laurent N., Lipnik K., Ocker M., Naschberger E., Schellerer V.S., Croner R.S., Vieth M., Waldner M., Steinberg P., Hohenadl C., et al. GBP-1 acts as a tumor suppressor in colorectal cancer cells. Carcinogenesis. 2012;34:153–162. doi: 10.1093/carcin/bgs310. - DOI - PubMed
    1. Lipnik K., Naschberger E., Gonin-Laurent N., Kodajova P., Petznek H., Rungaldier S., Astigiano S., Ferrini S., Sturzl M., Hohenadl C. Interferon g-induced human guanylate-binding protein 1 inhibits mammary tumor growth in mice. Mol. Med. 2010;16:177–187. doi: 10.2119/molmed.2009.00172. - DOI - PMC - PubMed

Grants and funding