

Raman Imaging and Fluorescence Lifetime Imaging Microscopy for Diagnosis of Cancer State and Metabolic Monitoring
- PMID: 34830837
- PMCID: PMC8616063
- DOI: 10.3390/cancers13225682
Raman Imaging and Fluorescence Lifetime Imaging Microscopy for Diagnosis of Cancer State and Metabolic Monitoring
Abstract
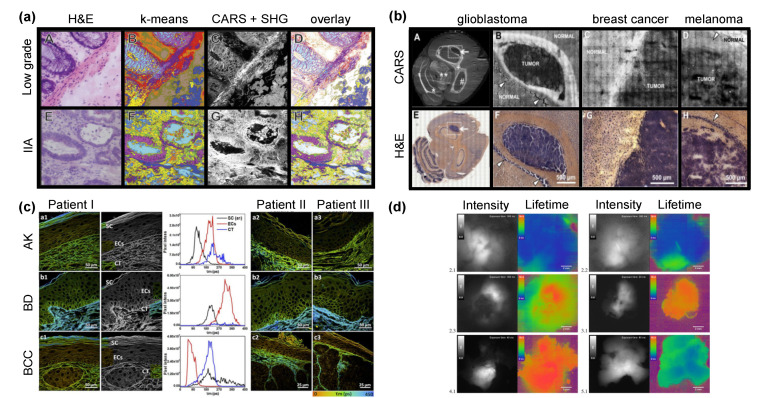
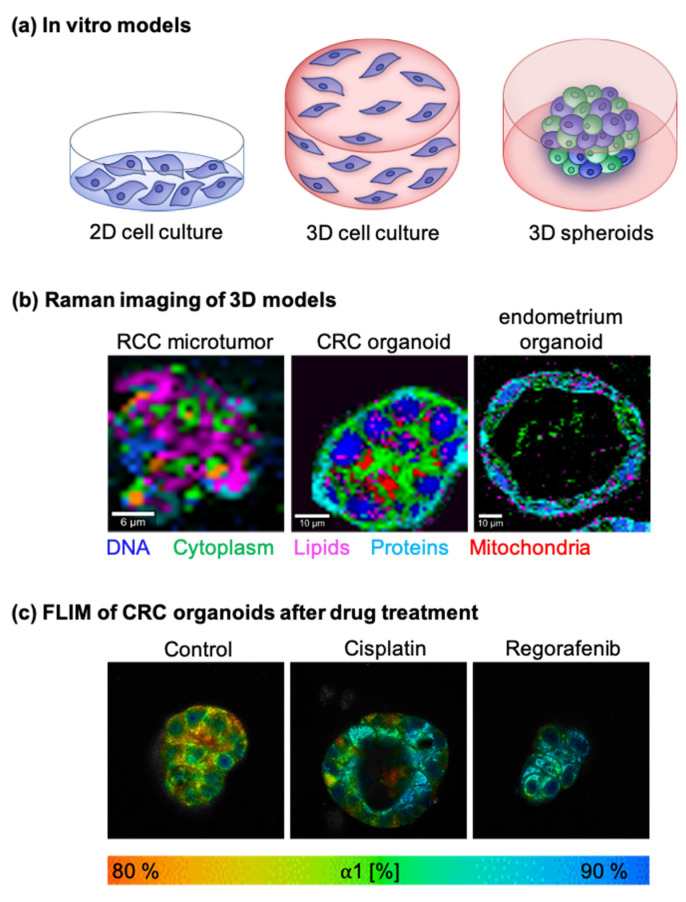
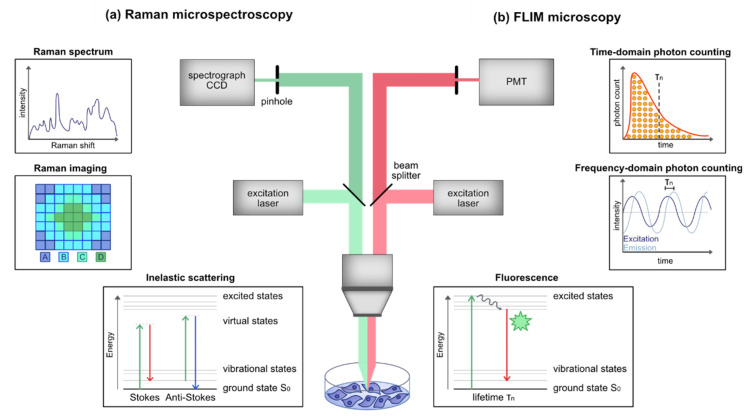
Hurdles for effective tumor therapy are delayed detection and limited effectiveness of systemic drug therapies by patient-specific multidrug resistance. Non-invasive bioimaging tools such as fluorescence lifetime imaging microscopy (FLIM) and Raman-microspectroscopy have evolved over the last decade, providing the potential to be translated into clinics for early-stage disease detection, in vitro drug screening, and drug efficacy studies in personalized medicine. Accessing tissue- and cell-specific spectral signatures, Raman microspectroscopy has emerged as a diagnostic tool to identify precancerous lesions, cancer stages, or cell malignancy. In vivo Raman measurements have been enabled by recent technological advances in Raman endoscopy and signal-enhancing setups such as coherent anti-stokes Raman spectroscopy or surface-enhanced Raman spectroscopy. FLIM enables in situ investigations of metabolic processes such as glycolysis, oxidative stress, or mitochondrial activity by using the autofluorescence of co-enzymes NADH and FAD, which are associated with intrinsic proteins as a direct measure of tumor metabolism, cell death stages and drug efficacy. The combination of non-invasive and molecular-sensitive in situ techniques and advanced 3D tumor models such as patient-derived organoids or microtumors allows the recapitulation of tumor physiology and metabolism in vitro and facilitates the screening for patient-individualized drug treatment options.
Keywords: 3D in vitro models; Raman microspectroscopy; fluorescence lifetime imaging microscopy; in situ imaging; tissue diagnostics; tumor metabolism.
Conflict of interest statement
The authors declare no conflict of interest.
Figures
Similar articles
-
Data-Driven Identification of Biomarkers for In Situ Monitoring of Drug Treatment in Bladder Cancer Organoids.Int J Mol Sci. 2022 Jun 23;23(13):6956. doi: 10.3390/ijms23136956. Int J Mol Sci. 2022. PMID: 35805961 Free PMC article.
-
Fast vibrational imaging of single cells and tissues by stimulated Raman scattering microscopy.Acc Chem Res. 2014 Aug 19;47(8):2282-90. doi: 10.1021/ar400331q. Epub 2014 May 28. Acc Chem Res. 2014. PMID: 24871269 Free PMC article.
-
Clinical label-free biochemical and metabolic fluorescence lifetime endoscopic imaging of precancerous and cancerous oral lesions.Oral Oncol. 2020 Jun;105:104635. doi: 10.1016/j.oraloncology.2020.104635. Epub 2020 Apr 2. Oral Oncol. 2020. PMID: 32247986 Free PMC article.
-
Types of advanced optical microscopy techniques for breast cancer research: a review.Lasers Med Sci. 2018 Dec;33(9):1849-1858. doi: 10.1007/s10103-018-2659-6. Epub 2018 Oct 11. Lasers Med Sci. 2018. PMID: 30311083 Review.
-
Non-invasive Imaging Techniques: From Histology to In Vivo Imaging : Chapter of Imaging in Oncology.Recent Results Cancer Res. 2020;216:795-812. doi: 10.1007/978-3-030-42618-7_25. Recent Results Cancer Res. 2020. PMID: 32594407 Review.
Cited by
-
Data-Driven Identification of Biomarkers for In Situ Monitoring of Drug Treatment in Bladder Cancer Organoids.Int J Mol Sci. 2022 Jun 23;23(13):6956. doi: 10.3390/ijms23136956. Int J Mol Sci. 2022. PMID: 35805961 Free PMC article.
-
Monitoring the macrophage response towards biomaterial implants using label-free imaging.Mater Today Bio. 2023 Jun 13;21:100696. doi: 10.1016/j.mtbio.2023.100696. eCollection 2023 Aug. Mater Today Bio. 2023. PMID: 37361552 Free PMC article.
-
Delineation and detection of breast cancer using novel label-free fluorescence.BMC Med Imaging. 2023 Sep 16;23(1):132. doi: 10.1186/s12880-023-01095-2. BMC Med Imaging. 2023. PMID: 37716994 Free PMC article.
-
Advancements in Dermatological Imaging Modalities.Indian Dermatol Online J. 2024 Feb 28;15(2):278-292. doi: 10.4103/idoj.idoj_852_23. eCollection 2024 Mar-Apr. Indian Dermatol Online J. 2024. PMID: 38550821 Free PMC article. No abstract available.
References
Publication types
Grants and funding
- EXC 2180 - 390900677/Deutsche Forschungsgemeinschaft
- GRK 2543/1/Deutsche Forschungsgemeinschaft
- INST 2388/64-1/Deutsche Forschungsgemeinschaft
- 33-729.55-3/214/Ministry of Science, Research and the Arts of Baden-Württemberg
- SI-BW 01222-91/Ministry of Science, Research and the Arts of Baden-Württemberg
LinkOut - more resources
Full Text Sources
