. 2021 Nov 15;13(22):5718.
doi: 10.3390/cancers13225718.

Blood Cytokine Analysis Suggests That SARS-CoV-2 Infection Results in a Sustained Tumour Promoting Environment in Cancer Patients

Affiliations

Blood Cytokine Analysis Suggests That SARS-CoV-2 Infection Results in a Sustained Tumour Promoting Environment in Cancer Patients

Fien H R De Winter et al. Cancers (Basel). .

Abstract

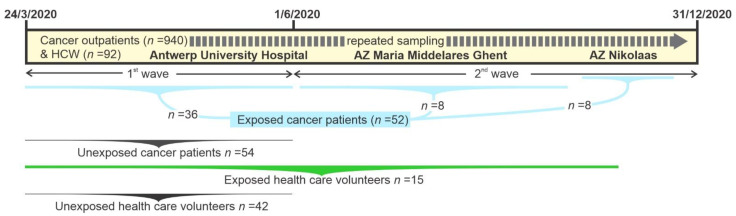
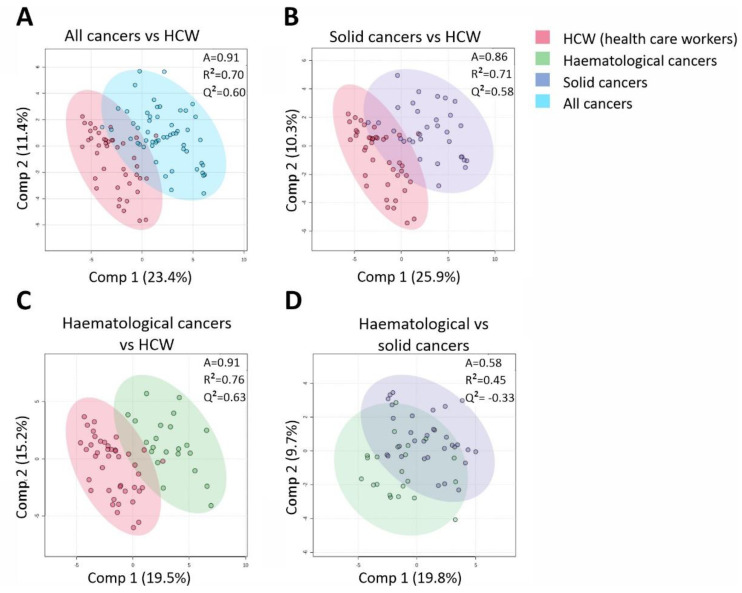
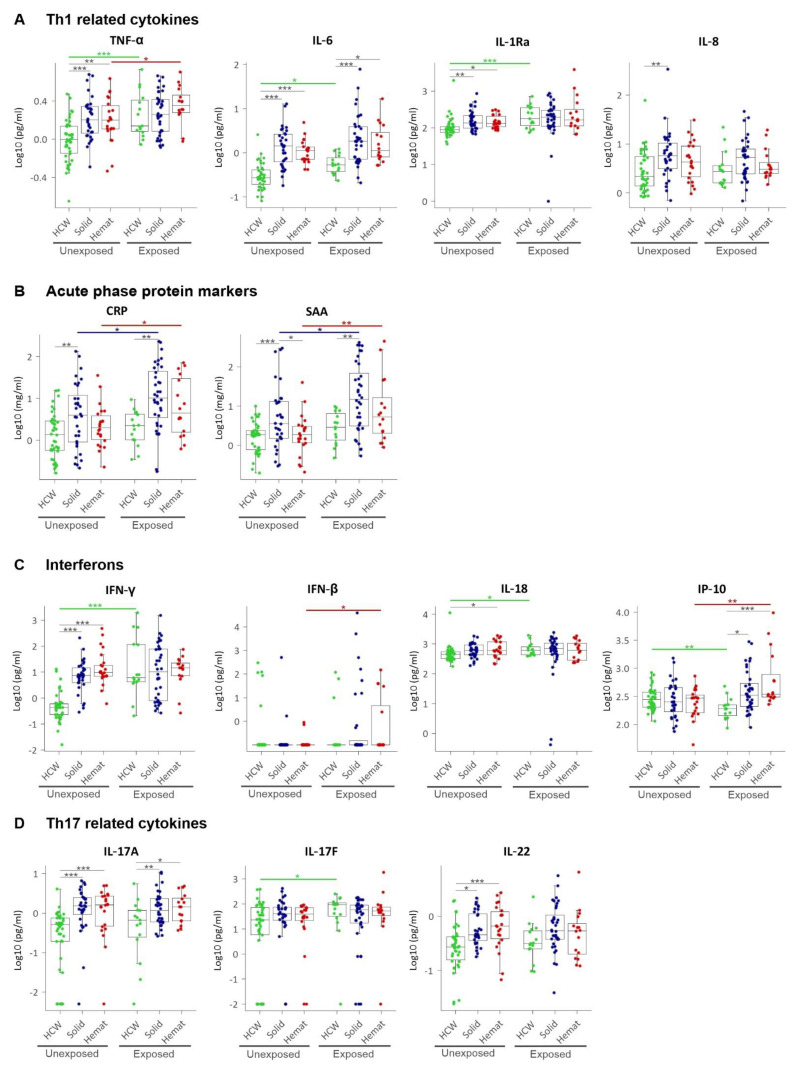
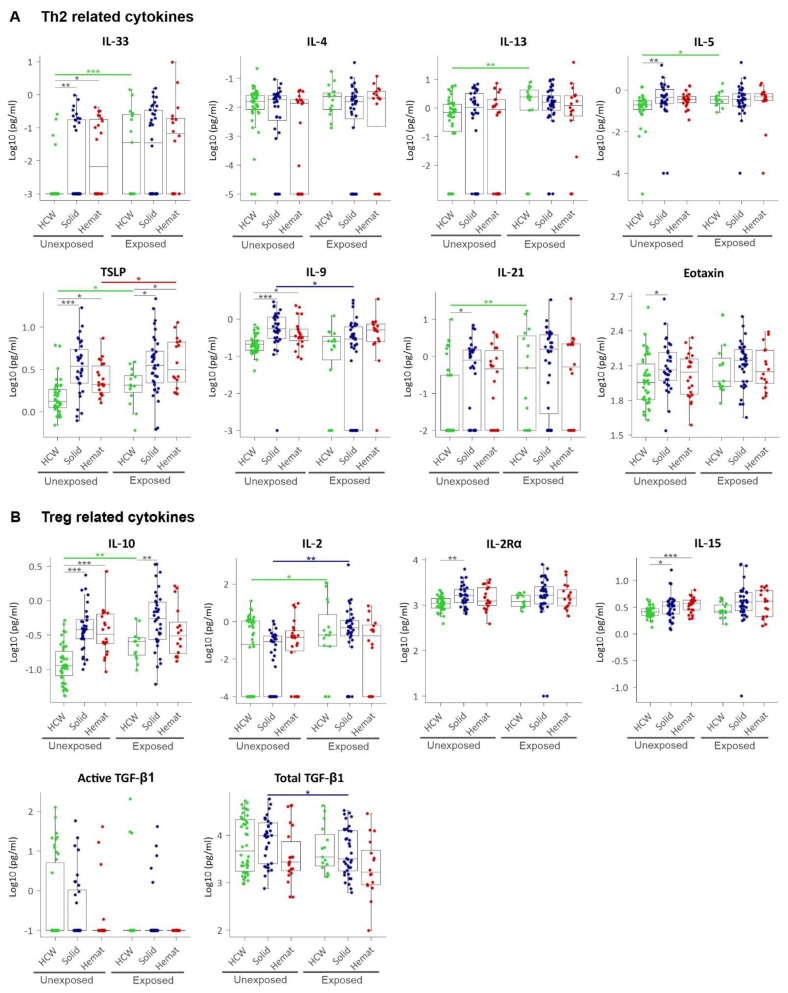
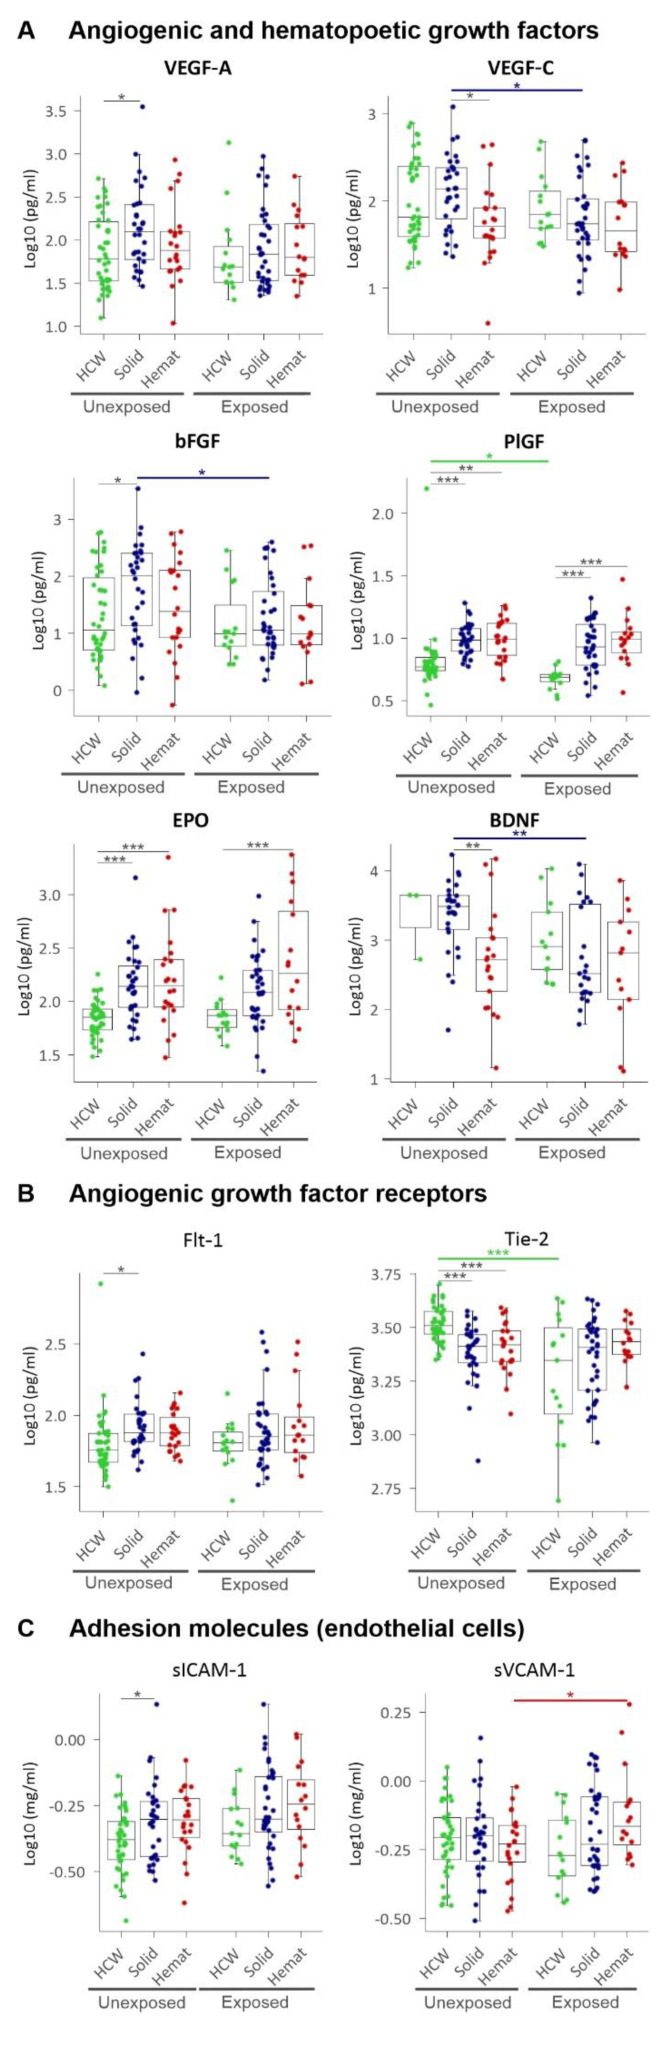
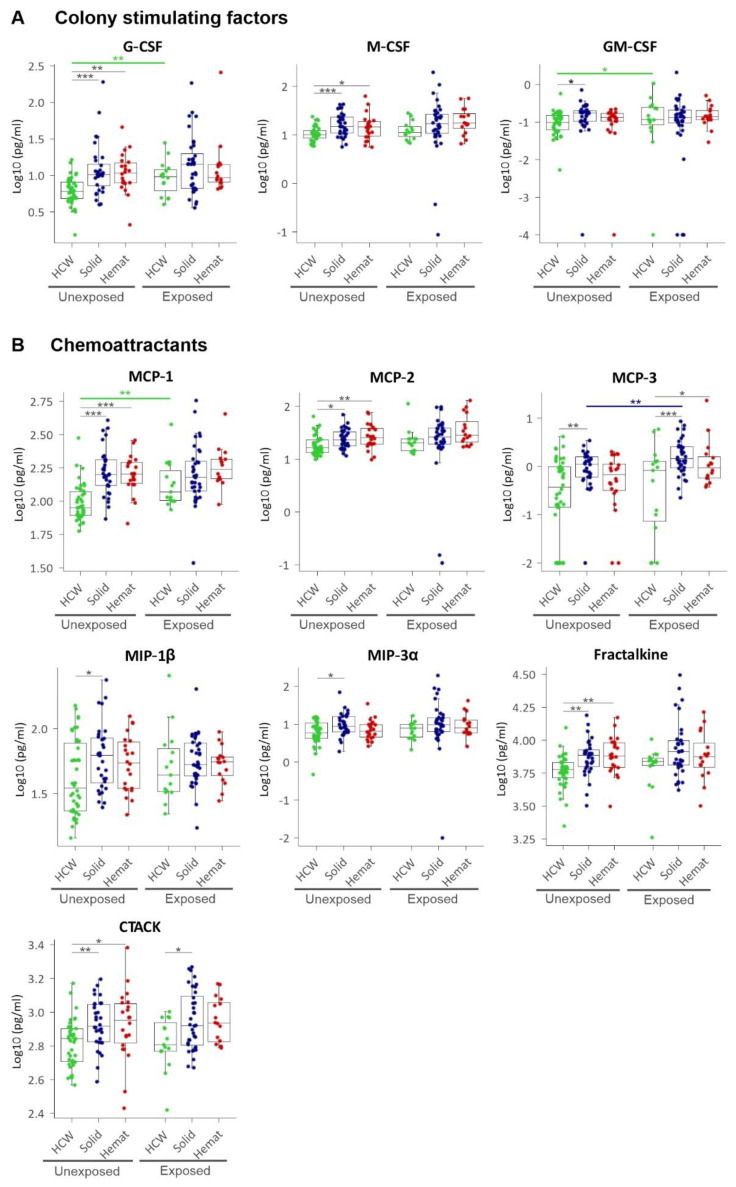
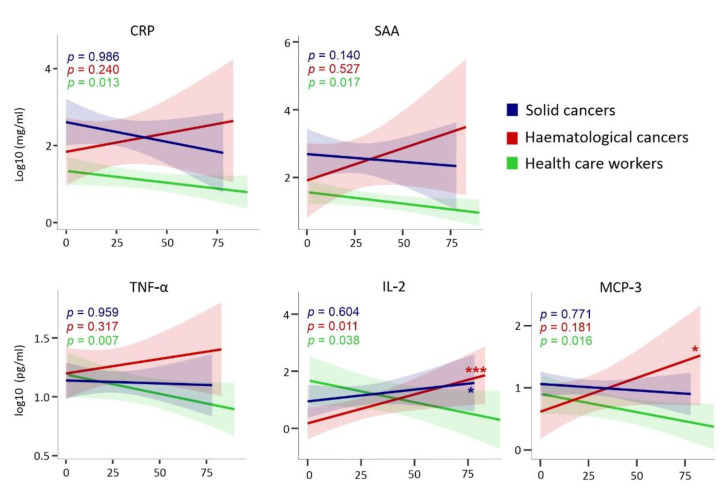
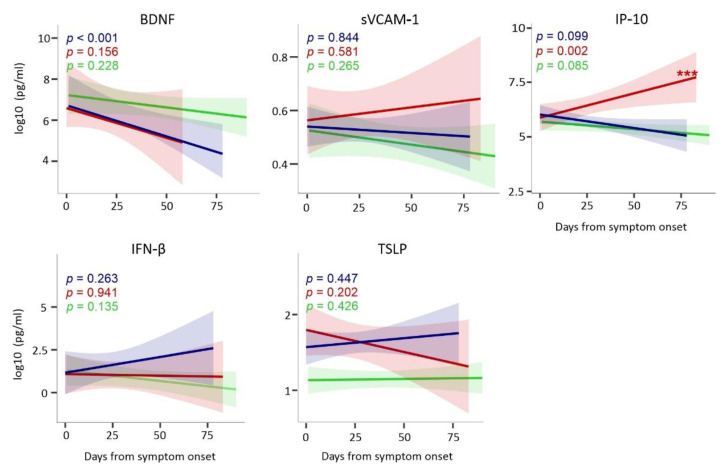
Cytokines, chemokines, and (angiogenic) growth factors (CCGs) have been shown to play an intricate role in the progression of both solid and haematological malignancies. Recent studies have shown that SARS-CoV-2 infection leads to a worse outcome in cancer patients, especially in haematological malignancy patients. Here, we investigated how SARS-CoV-2 infection impacts the already altered CCG levels in solid or haematological malignancies, specifically, whether there is a protective effect or rather a potentially higher risk for major COVID-19 complications in cancer patients due to elevated CCGs linked to cancer progression. Serially analysing immune responses with 55 CCGs in cancer patients under active treatment with or without SARS-CoV-2 infection, we first showed that cancer patients without SARS-CoV-2 infection (n = 54) demonstrate elevated levels of 35 CCGs compared to the non-cancer, non-infected control group of health care workers (n = 42). Of the 35 CCGs, 19 were common to both the solid and haematological malignancy groups and comprised previously described cytokines such as IL-6, TNF-α, IL-1Ra, IL-17A, and VEGF, but also several less well described cytokines/chemokines such as Fractalkine, Tie-2, and T cell chemokine CTACK. Importantly, we show here that 7 CCGs are significantly altered in SARS-CoV-2 exposed cancer patients (n = 52). Of these, TNF-α, IFN-β, TSLP, and sVCAM-1, identified to be elevated in haematological cancers, are also known tumour-promoting factors. Longitudinal analysis conducted over 3 months showed persistence of several tumour-promoting CCGs in SARS-CoV-2 exposed cancer patients. These data demonstrate a need for increased vigilance for haematological malignancy patients as a part of long COVID follow-up.

Keywords: COVID-19; Th1; Th17; Th2; anti-inflammatory; haematological cancers; immune response; pro-inflammatory; solid cancers.


Conflict of interest statement

The authors declare no conflict of interest.

Figures

Figure 1
Figure 1
Study design. Cancer outpatients were enrolled and additional blood samples were taken with every clinically indicated blood draw. SARS-CoV-2 exposure was tested and patients were divided in groups accordingly, where unexposed patients and health care workers were matched with the exposed ones. HCW, health care workers.
Figure 2
Figure 2
Cluster analysis of CCGs in unexposed individuals with partial least-squares discriminant analysis (PLS-DA) reveals larger differences between health care workers (HCWs) and cancer as a group or individually as solid and haematological groups, than between the two cancer groups. (A) The comparison of HCWs with the two different cancer types pooled. (B) The comparison of the HCWs with patients with solid tumours (C) and with haematological malignancies (D) Comparison of haematological versus solid cancer patients. A, accuracy.
Figure 3
Figure 3
Plasma levels of pro-inflammatory CCGs as (A) Th1 related cytokines, (B) acute phase proteins, (C) interferons and interferon-related cytokines, and (D) Th17 related cytokines. HCW, health care workers (green); solid, patients with solid tumours (blue); hemat, patients with haematological malignancies (red). Each dot represents the sample closest to exposure in the case of exposed patients, and an average of multiple timepoints, when available, for unexposed patients. * p < 0.05, ** p < 0.01, *** p < 0.001.
Figure 4
Figure 4
Plasma levels of (A) Th2 related (anti-inflammatory) cytokines and (B) Treg-related (immunomodulatory) cytokines. HCW, health care workers (green); solid, patients with solid tumours (blue); hemat, patients with haematological malignancies (red). Each dot represents the sample closest to exposure in the case of exposed patients, and an average of multiple timepoints, when available, for unexposed patients. * p < 0.05, ** p < 0.01, *** p < 0.001.
Figure 5
Figure 5
Plasma levels of (A) angiogenic and haematopoietic growth factors, (B) angiogenic growth factor receptors, and (C) adhesion molecules expressed by endothelial cells. HCW, health care workers (green); solid, patients with solid tumours (blue); hemat, patients with haematological malignancies (red). Each dot represents the sample closest to exposure in the case of exposed patients and an average of multiple timepoints, when available, for unexposed patients. * p < 0.05, ** p < 0.01, *** p < 0.001.
Figure 6
Figure 6
Plasma levels of (A) colony stimulating factors (CSFs) and (B) monocyte chemoattracting proteins (MCPs), macrophage inflammatory proteins (MIPs) and other chemokines. HCW, health care workers (green); solid, patients with solid tumours (blue); hemat, patients with haematological malignancies (red). Each dot represents the sample closest to exposure in the case of exposed patients and an average of multiple timepoints, when available, for unexposed patients. * p < 0.05, ** p < 0.01, *** p < 0.001.
Figure 7
Figure 7
Temporal evolution of CCGs altered in exposed cancer patients. HCW, health care workers (green); solid, patients with solid tumours (blue); hemat, patients with haematological malignancies (red). Time is represented as days since symptom onset (day 0). p-values in the graph refer to significance of the slope from the 3 separate regression lines. The asterisks represent the significance of the pairwise comparison between the slope (p-value for interaction) in haematological malignancy versus HCW (red) and solid malignancy versus HCW (blue). *p < 0.05, *** p < 0.001.
Figure 7
Figure 7
Temporal evolution of CCGs altered in exposed cancer patients. HCW, health care workers (green); solid, patients with solid tumours (blue); hemat, patients with haematological malignancies (red). Time is represented as days since symptom onset (day 0). p-values in the graph refer to significance of the slope from the 3 separate regression lines. The asterisks represent the significance of the pairwise comparison between the slope (p-value for interaction) in haematological malignancy versus HCW (red) and solid malignancy versus HCW (blue). *p < 0.05, *** p < 0.001.

References

    1. Mantovani A., Allavena P., Sica A., Balkwill F. Cancer-related inflammation. Nature. 2008;454:436–444. doi: 10.1038/nature07205. - DOI - PubMed
    1. Grivennikov S.I., Greten F.R., Karin M. Immunity, Inflammation, and Cancer. Cell. 2010;140:883–899. doi: 10.1016/j.cell.2010.01.025. - DOI - PMC - PubMed
    1. Lan T., Chen L., Wei X. Inflammatory Cytokines in Cancer: Comprehensive Understanding and Clinical Progress in Gene Therapy. Cells. 2021;10:100. doi: 10.3390/cells10010100. - DOI - PMC - PubMed
    1. Johnson D.E., O’Keefe R.A., Grandis J.R. Targeting the IL-6/JAK/STAT3 signalling axis in cancer. Nat. Rev. Clin. Oncol. 2018;15:234–248. doi: 10.1038/nrclinonc.2018.8. - DOI - PMC - PubMed
    1. Balkwill F. TNF-alpha in promotion and progression of cancer. Cancer Metastasis Rev. 2006;25:409–416. doi: 10.1007/s10555-006-9005-3. - DOI - PubMed