. 2021 Oct 23;10(11):2859.
doi: 10.3390/cells10112859.

Changes in Cell Morphology and Actin Organization in Embryonic Stem Cells Cultured under Different Conditions

Affiliations

Changes in Cell Morphology and Actin Organization in Embryonic Stem Cells Cultured under Different Conditions

Younes F Barooji et al. Cells. .

Abstract

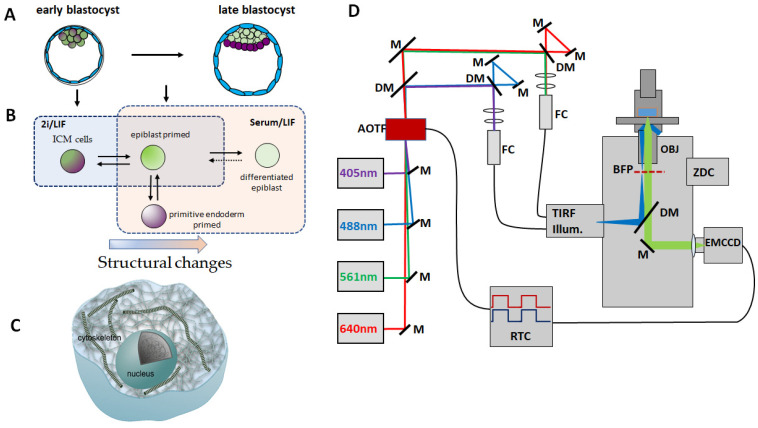
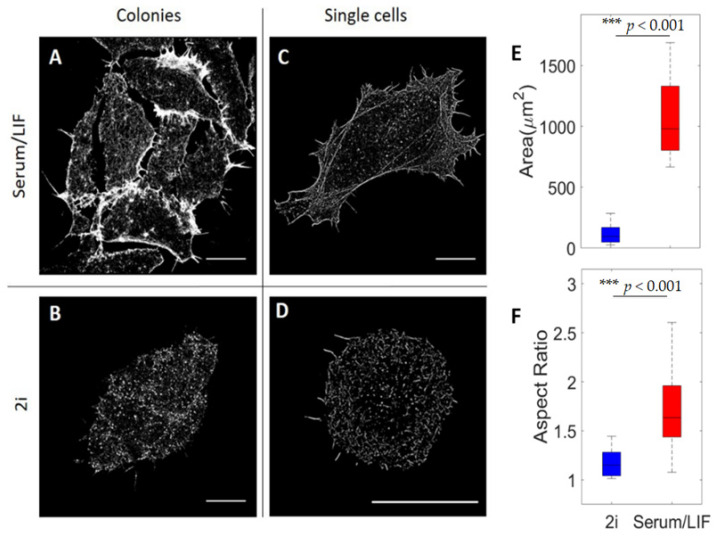
The cellular cytoskeleton provides the cell with a mechanical rigidity that allows mechanical interaction between cells and the extracellular environment. The actin structure plays a key role in mechanical events such as motility or the establishment of cell polarity. From the earliest stages of development, as represented by the ex vivo expansion of naïve embryonic stem cells (ESCs), the critical mechanical role of the actin structure is becoming recognized as a vital cue for correct segregation and lineage control of cells and as a regulatory structure that controls several transcription factors. Naïve ESCs have a characteristic morphology, and the ultrastructure that underlies this condition remains to be further investigated. Here, we investigate the 3D actin cytoskeleton of naïve mouse ESCs using super-resolution optical reconstruction microscopy (STORM). We investigate the morphological, cytoskeletal, and mechanical changes in cells cultured in 2i or Serum/LIF media reflecting, respectively, a homogeneous preimplantation cell state and a state that is closer to embarking on differentiation. STORM imaging showed that the peripheral actin structure undergoes a dramatic change between the two culturing conditions. We also detected micro-rheological differences in the cell periphery between the cells cultured in these two media correlating well with the observed nano-architecture of the ESCs in the two different culture conditions. These results pave the way for linking physical properties and cytoskeletal architecture to cell morphology during early development.

Keywords: actin cytoskeleton; cell culturing; embryonic stem cells; micro-rheology; optical tweezers; primed embryonic stem cells; super-resolution microscopy (STORM).


Conflict of interest statement

The authors declare no conflict of interest.

Figures

Figure 1
Figure 1
Embryonic stem cell development and the super-resolution imaging platform used to image the actin organization during early development. (A) Schematic illustration of the early and late stage blastocyst. (B) Overview of how the differentiation stage of embryonic stem cells can be modulated by culturing in different media. Cells cultured in 2i/LIF recapitulate the early preimplantation epiblast, and ICM. ESCs cultured in Serum/LIF represent a slightly later stage of development, where heterogeneous culture captures a metastable pluripotent epiblast state that exhibits reversible priming toward extra-embryonic endoderm and more differentiated epiblast [19]. (C) Schematics showing the cytoskeletal structure of a cell. The ultrastructure of actin is not constant during development. (D) Description of the TIRF/STORM setup used to image actin organization in embryonic stem cells. Optical elements and light path in the TIRF/STORM setup: M, mirror; DM, dichroic mirror; AOTF, acousto-optical tunable filter; FC, fiber coupler; TIRF Illumination, motorized TIRF illumination module; BFP, back focal plane; OBJ, objective; ZDC, real-time z-drift compensation module; EMCCD, electron-multiplying CCD camera; RTC, real-time controller. See Figure S1 for more details. Panels A and B are adapted with permission from [12].
Figure 2
Figure 2
Confocal images and analysis of the shape of ESC colonies grown in 2i versus Serum/LIF. (A,B) Upper panels: images in the lateral plane (x,y) taken near the surface. Lower panels: images from a side view (x,z) of typical cell colonies of cells grown in Serum/LIF medium (A) or 2i medium (B), respectively. The contact angle of the colony to the substrate is marked in white. The scale bar is 10 μm in all images. (C) Contact angle between an ESC colony and the surface when cultured in 2i (blue) or in Serum/LIF (red), respectively, extracted from side-view images as shown in (A,B). n = 5 colonies for each condition, colonies grown in 2i exhibit significantly larger contact angles than those cultured in Serum/LIF. Error bars denote one standard deviation, and the horizontal line represents the mean values. P value was found using a standard t-test. *** indicates p < 0.001.
Figure 3
Figure 3
Super-resolution-based analysis of actin cytoskeleton organization in stem cells near the substrate. (AD) STORM images of the actin network under different conditions: (A) a colony of cells grown in Serum/LIF media, (B) a colony of cells grown in 2i media, (C) a single cell grown in Serum/LIF media, and (D) a single cell grown in 2i media. All scale bars are 10 µm. (E) Boxplot of the surface spreading area of ESCs grown in either 2i (blue) or Serum/LIF (red) media, respectively. There is a significantly larger spreading of cells grown in Serum/LIF media than in 2i (n = 16, for each condition). (F) Boxplot of measured aspect ratios of ESCs grown in 2i (blue) or Serum/LIF (red) media, respectively (n = 16, for each condition). Cells cultured in Serum/LIF are significantly more elongated than those in 2i. Box edges indicate 25th and 75th percentiles, and whiskers extend to the most extreme data points not considered as outliers. *** indicates p < 0.001.
Figure 4
Figure 4
3D STORM imaging of single cells for resolving actin and stress fiber organization in ESCs grown in Serum/LIF or 2i media, respectively. (A) 3D visualization of actin filaments in stem cells grown in Serum/LIF. (B) 3D visualization of actin filaments of cells cultured in 2i. The z-positions are color-coded (violet indicating the substrate). Lower panels show side views of the boxed regions in the images above. The images indicate a dorsal type of stress fibers extending out from the surface at the edge of the cells to be present (only) in cells grown in Serum/LIF. In contrast, actin fibers in cells grown in 2i appear to extend away from the substrate close to the cell’s periphery. Scale bars in upper panels 10 μm, in lower panels 500 nm.
Figure 5
Figure 5
Characterization of actin filament orientation in ESCs near the surface. (A,B) Orientation of actin filaments in ESCs, color code indicates orientation with respect to the cell’s major axis (white arrow), (A) shows an ESC grown in Serum/LIF and (B) an ESC grown in 2i media. Scale bars: 10 µm. (C,D) Angular plots showing the direction (blue) of the actin filaments with (C) corresponding to image (A), and (D) corresponding to image (B), respectively. The red lines indicate the orientation of the cells’ major axes found by fitting an ellipse to the adherent area. (E) Boxplot of the actin filament orientation order parameter S=cos(2θ), where θ is the angle between fiber orientation and the orientation of the cell’s major axis, Box edges indicate 25th and 75th percentiles, and whiskers extend to the most extreme data points not considered outliers. n = 16 cells for each of the 2i (blue) and Serum/LIF (red) categories. ** indicates p < 0.01 using t test.
Figure 6
Figure 6
Characterization of viscoelastic properties of ESCs grown in 2i or Serum/LIF at the sub-cellular level close to the cortex of the cell. (A,B) (i) Schematic of observed cell geometry, (ii) bright field image, trapped granule marked by black arrow, (iii) confocal images of same area as shown in (ii) with F-actin labeled by a SIR-actin. In (A), cells were grown in 2i; in (B), cells were grown in Serum/LIF. (C) Representative power spectrum of the positions visited by a lipid granule close to the periphery of an ESC cultured in Serum/LIF. The red line shows the fit of Equation (1) to data in the frequency interval 300–3000 Hz, returning α = 0.41 for this experiment. (D) α-values from lipid granule trapping measurements in 2i or Serum/LIF, respectively. Box plot of 25th to 75th percentile, * indicates p < 0.05 using t-test. n = 26 cells for each condition. (E) Loss modulus, G′, for cells cultivated in Serum/LIF or 2i/LIF. (F) Storage modulus, G″, of cells cultivated in Serum/LIF or 2i/LIF. The magnitude of the storage modulus is significantly higher for Serum/LIF cultivated cells than for cells cultivated in 2i/LIF for all investigated frequencies, indicating that primed cells are more elastic, thus confirming the results from (D).

References

    1. Bongiorno T., Gura J., Talwar P., Chambers D., Young K.M., Arafat D., Wang G., Jackson-Holmes E.L., Qiu P., McDevitt T.C., et al. Biophysical subsets of embryonic stem cells display distinct phenotypic and morphological signatures. PLoS ONE. 2018;13:e0192631. doi: 10.1371/journal.pone.0192631. - DOI - PMC - PubMed
    1. Urbanska M., Winzi M., Neumann K., Abuhattum S., Rosendahl P., Muller P., Taubenberger A., Anastassiadis K., Guck J. Single-cell mechanical phenotype is an intrinsic marker of reprogramming and differentiation along the mouse neural lineage. Development. 2017;144:4313–4321. doi: 10.1242/dev.155218. - DOI - PubMed
    1. Engler A.J., Sen S., Sweeney H.L., Discher D.E. Matrix elasticity directs stem cell lineage specification. Cell. 2006;126:677–689. doi: 10.1016/j.cell.2006.06.044. - DOI - PubMed
    1. Han Y.L., Pegoraro A.F., Li H., Li K., Yuan Y., Xu G., Gu Z., Sun J., Hao Y., Gupta S.K., et al. Cell swelling, softening and invasion in a three-dimensional breast cancer model. Nat. Phys. 2020;16:101–108. doi: 10.1038/s41567-019-0680-8. - DOI - PMC - PubMed
    1. Wullkopf L., West A.K.V., Leijnse N., Cox T.R., Madsen C.D., Oddershede L.B., Erler J.T. Cancer cells’ ability to mechanically adjust to extracellular matrix stiffness correlates with their invasive potential. Mol. Biol. Cell. 2018;29:2378–2385. doi: 10.1091/mbc.E18-05-0319. - DOI - PMC - PubMed

Publication types

LinkOut - more resources