. 2021 Nov 7;10(11):3065.
doi: 10.3390/cells10113065.

PI3K Pathway Inhibition with NVP-BEZ235 Hinders Glycolytic Metabolism in Glioblastoma Multiforme Cells

Affiliations

PI3K Pathway Inhibition with NVP-BEZ235 Hinders Glycolytic Metabolism in Glioblastoma Multiforme Cells

Shreya Udawant et al. Cells. .

Abstract

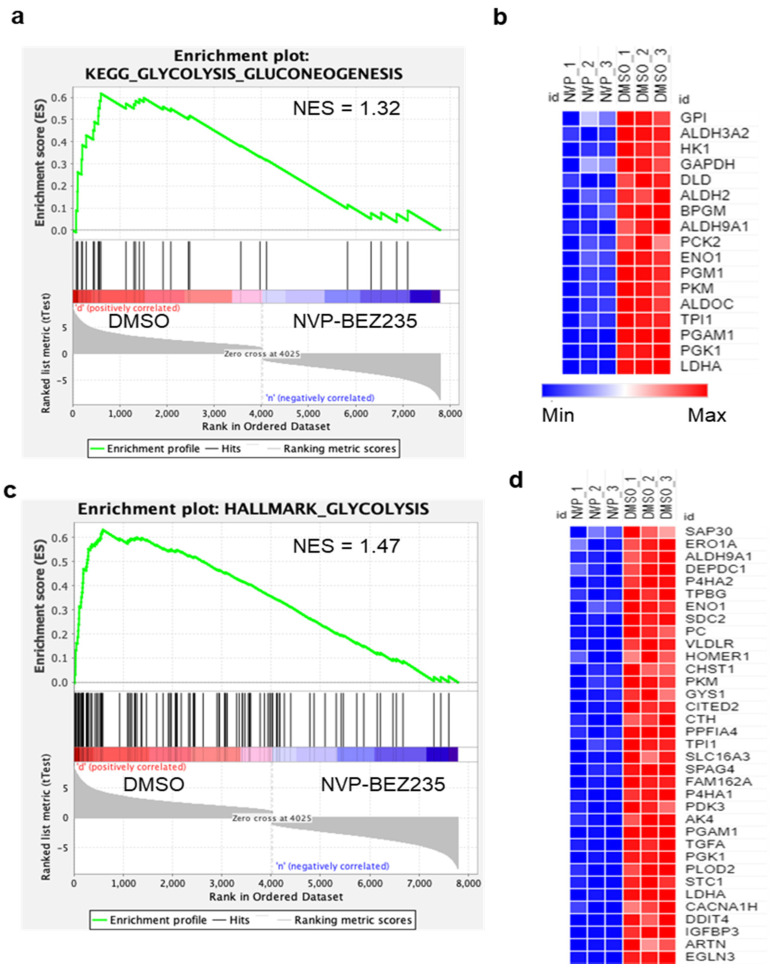
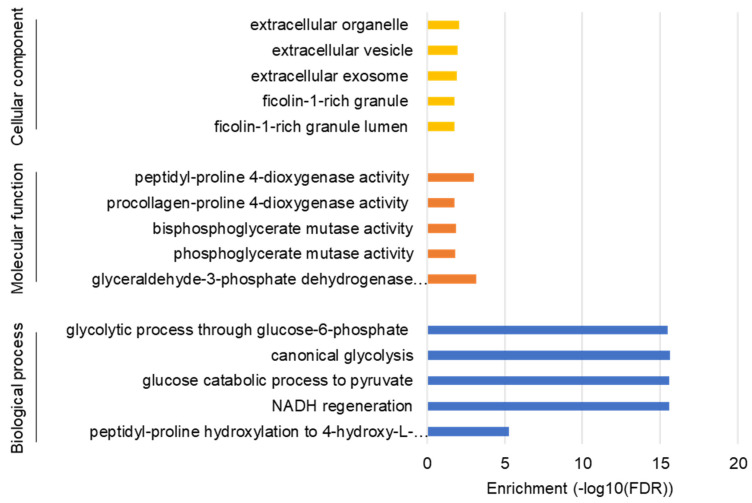
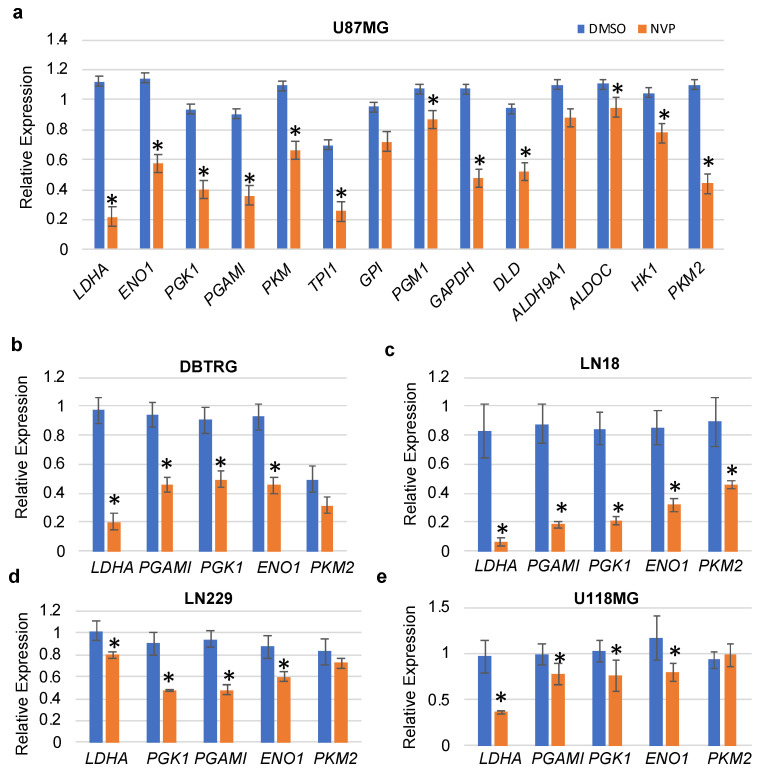
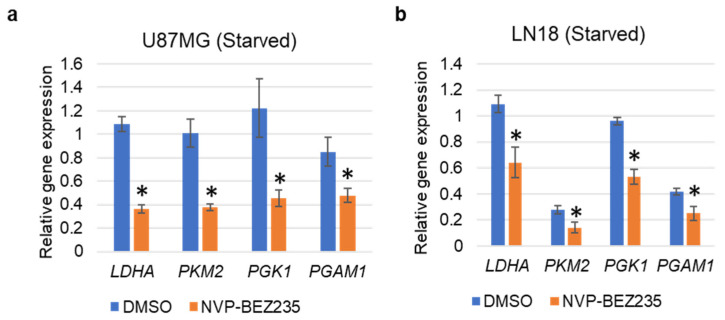
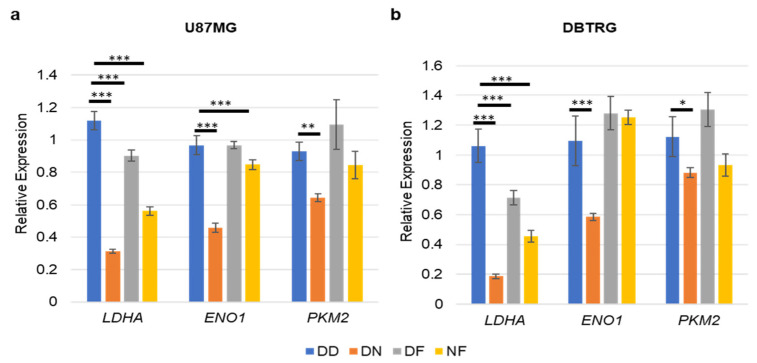
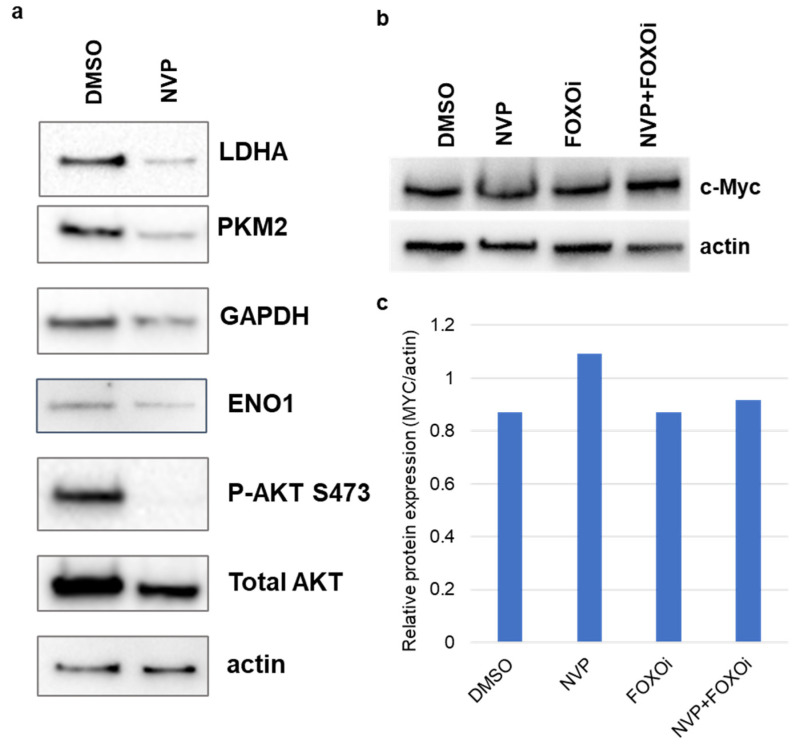
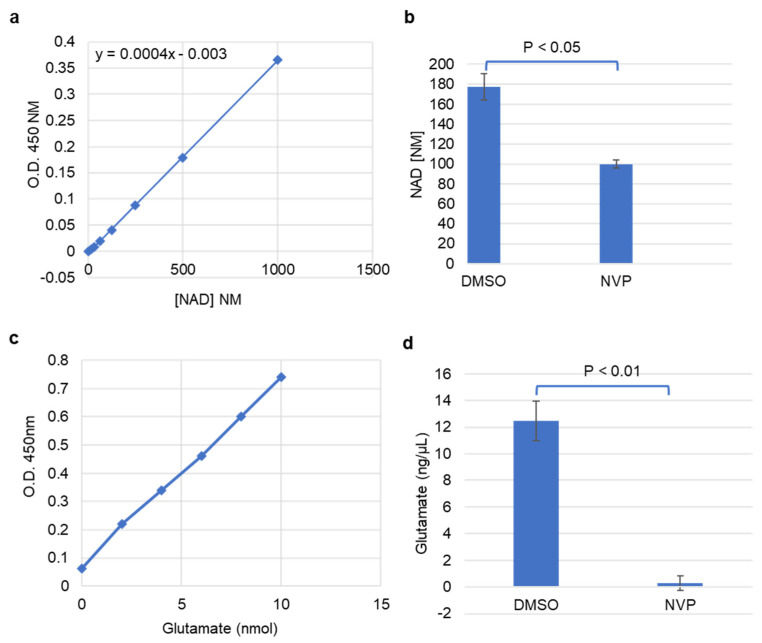
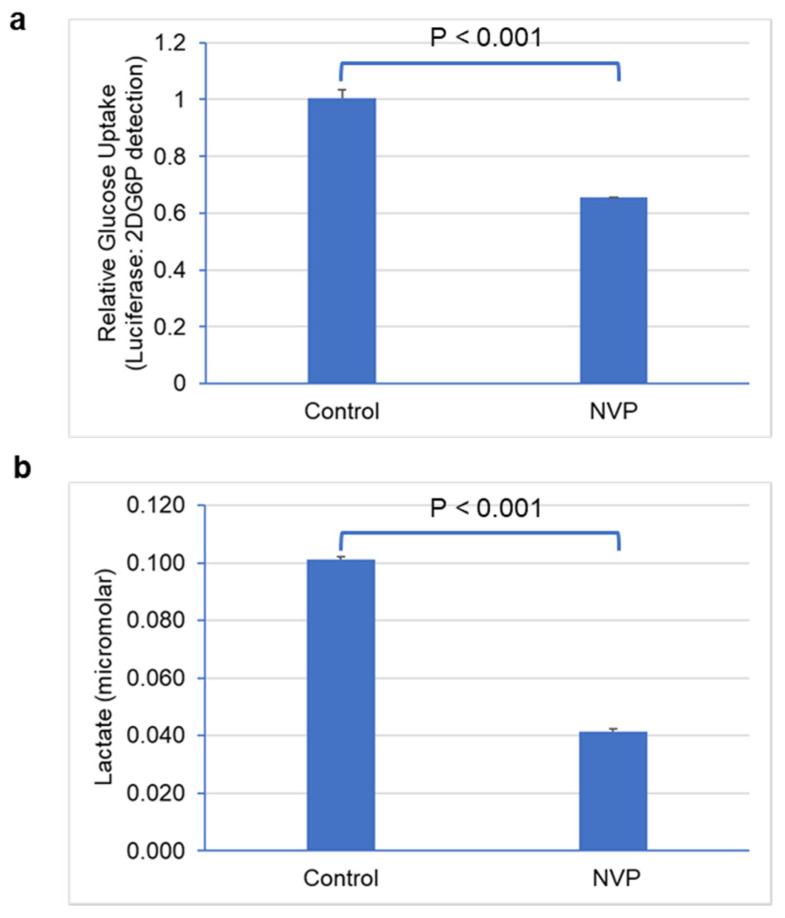
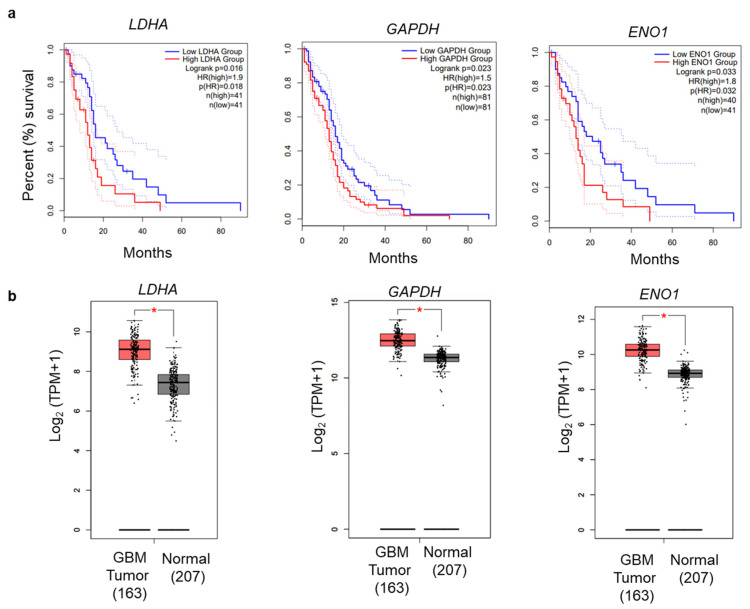
Glioblastoma (GBM) is the most lethal primary brain cancer that lacks effective molecular targeted therapies. The PI3K/AKT/mTOR pathway is activated in 90% of all Glioblastoma multiforme (GBM) tumors. To gain insight into the impact of the PI3K pathway on GBM metabolism, we treated U87MG GBM cells with NVP-BEZ235 (PI3K and mTOR a dual inhibitor) and identified differentially expressed genes with RNA-seq analysis. RNA-seq identified 7803 differentially regulated genes in response to NVP-BEZ235. Gene Set Enrichment Analysis (GSEA) identified two glycolysis-related gene sets that were significantly enriched (p < 0.05) in control samples compared to NVP-BEZ235-treated samples. We validated the inhibition of glycolytic genes by NVP-BEZ235 and examined the impact of the FOXO1 inhibitor (AS1842856) on these genes in a set of GBM cell lines. FOXO1 inhibition alone was associated with reduced LDHA expression, but not ENO1 or PKM2. Bioinformatics analyses revealed that PI3K-impacted glycolytic genes were over-expressed and co-expressed in GBM clinical samples. The elevated expression of PI3K-impacted glycolytic genes was associated with poor prognosis in GBM based on Kaplan-Meier survival analyses. Our results suggest novel insights into hallmark metabolic reprogramming associated with the PI3K-mTOR dual inhibition.

Keywords: Gene Set Enrichment Analysis (GSEA); PI3K/AKT/mTOR pathway; RNA-seq; glioblastoma (GBM); glycolysis.


Conflict of interest statement

The authors declare that they have no conflict of interest.

Figures

Figure 1
Figure 1
Glycolytic genes are reduced by NVP-BEZ235 treatment in U87MG cells. GSEA generated enrichment plots and generated heatmaps depicting the enrichment of sample phenotypes, control (DMSO) and NVP-BEZ235-treated (50 nM for four days in U87MG cells), in priori defined glycolysis gene sets. (a) KEGG glycolysis gluconeogenesis gene set, (b) heatmap of 17 core enriched genes KEGG_GLYCOLYSIS_GLUCONEOGENESIS gene set (c), Hallmark glycolysis gene set, (d) heatmap of 35 core-enriched genes in HALLMARK_GLYCOLYSIS gene set. The profile of enrichment score (ES) and rank ordered list for enriched genes are shown. Both gene sets were significantly enriched in control samples compared to NVP-BEZ235 treatment samples p < 0.05.
Figure 2
Figure 2
GO enrichment analysis for biological process, molecular function, and cellular components. The false discovery rate (FDR) values on a minus log10 scale were used for enrichment measurement.
Figure 3
Figure 3
qRT-PCR validation of the glycolytic genes in various cell lines. (a) U87MG, (b) DBTRG, (c) LN18, (d) LN229, and (e) U118MG. The relative expression of the genes (compared to ACTB, encoding actin) was analyzed in control and NVP-BEZ235 (NVP) samples (1 μM treatment for 5 days). The error bars represent the standard deviation of the genes (n = 4). Asterisks (*) represent the significantly expressed genes (p < 0.05) as compared to control (DMSO). Significance was determined by Student’s t-test.
Figure 4
Figure 4
qRT-PCR validation of the glycolysis-related genes under serum starvation in (a) U87MG, and (b) LN18 cell lines grown in serum-free medium. The relative expression of the genes (compared to ACTB, encoding actin) was analyzed in control DMSO and NVP-BEZ235 samples (five days 1 μM NVP-BEZ235 with no FBS). The error bars represent the standard deviation of the genes (n = 4). Asterisks (*) represent the significantly expressed genes (p < 0.05) as compared to control (DMSO). Significance was determined by Student’s t-Test.
Figure 5
Figure 5
FOXO1 inhibition partially suppressed NVP-BEZ235 induction of glycolytic genes. (a) U87MG and (b) DBTRG. The relative expression of the genes was analyzed in DD-, DN-, DF-, and NF-treated samples. DD: DMSO; DN: DMSO+NVP-BEZ235 (1 μM); DF: DMSO+FOXOi (1 μM AS1842856); NF: NVP-BEZ235+FOXOi (1 μM of each drug). The error bars represent the standard deviation of the genes. The p-values were calculated by one-way ANOVA followed by Tukey’s test (*, p < 0.05; **, p < 0.01, ***, p < 0.001).
Figure 6
Figure 6
Expression changes of glycolysis-related proteins. Protein expression was verified using Western blot analysis in U87MG in (a) DMSO and 1 μM NVP-BEZ235 (NVP) samples, (b) c-Myc protein expression was verified using Western blot analysis in DMSO, NVP, FOXOi (AS1842856), and NVP+FOXOi samples (1 μM of each drug). Actin was used as the loading control. (c) Western blot for c-Myc was quantified using the Image Lab Software (Bio-Rad).
Figure 7
Figure 7
NAD+ and glutamate were reduced with NVP-BEZ235 treatment. (a) Absorbance of NAD+ concentrations at 450 nm. (b) The estimated concentration of NAD+ in control DMSO and 1 μM NVP-BEZ235 samples. (c) Absorbance of glutamate concentrations at 450 nm. (d) The estimated concentration of glutamate in DMSO and 1 μM NVP-BEZ235-treated samples. The error bars represent the standard deviation of the samples. Significance was determined by Student’s t-test.
Figure 8
Figure 8
NVP-BEZ235 treatment reduced glucose uptake and lactate secretion. (a) Glucose uptake and (b) lactate secretion in control DMSO and NVP-BEZ235-treated (1 μM) samples were measured with luminescence assay. The error bars represent the standard deviation of the samples. Significance was determined by Student’s t-test.
Figure 9
Figure 9
Overall survival analysis of glycolysis-related genes. (a) OS Kaplan–Meier analysis was performed using the GEPIA2 online application. The solid and dotted lines represent the survival curve and 95% confidence interval, respectively. (b) Differential expression boxplot of genes (LDHA, GAPDH, and ENO1) in GBM in The Cancer Genome Atlas (TCGA) database obtained from GEPIA2 [35].

References

    1. Batsios G., Viswanath P., Subramani E., Najac C., Gillespie A.M., Santos R.D., Molloy A.R., Pieper R.O., Ronen S.M. PI3K/mTOR inhibition of IDH1 mutant glioma leads to reduced 2HG production that is associated with increased survival. Sci. Rep. 2019;9:10521. doi: 10.1038/s41598-019-47021-x. - DOI - PMC - PubMed
    1. Xu X., Wan X., Wei X. PROX1 promotes human glioblastoma cell proliferation and invasion via activation of the nuclear factor-κB signaling pathway. Mol. Med. Rep. 2016;15:963–968. doi: 10.3892/mmr.2016.6075. - DOI - PubMed
    1. Elsir T., Eriksson A., Orrego A., Lindström M.S., Nistér M. Expression of PROX1 Is a Common Feature of High-Grade Malignant Astrocytic Gliomas. J. Neuropathol. Exp. Neurol. 2010;69:129–138. doi: 10.1097/NEN.0b013e3181ca4767. - DOI - PubMed
    1. Wang G., Fu X., Wang J., Guan R., Sun Y., To S.T. Inhibition of glycolytic metabolism in glioblastoma cells by Pt3glc combinated with PI3K inhibitor via SIRT3-mediated mitochondrial and PI3K/Akt–MAPK pathway. J. Cell. Physiol. 2019;234:5888–5903. doi: 10.1002/jcp.26474. - DOI - PubMed
    1. Atif F., Yousuf S., Espinosa-Garcia C., Sergeeva E., Stein D.G. Progesterone Treatment Attenuates Glycolytic Metabolism and Induces Senescence in Glioblastoma. Sci. Rep. 2019;9:1–12. doi: 10.1038/s41598-018-37399-5. - DOI - PMC - PubMed

Publication types

MeSH terms