. 2021 Nov 10;10(11):3113.
doi: 10.3390/cells10113113.

RALBP1 in Oxidative Stress and Mitochondrial Dysfunction in Alzheimer's Disease

Affiliations

RALBP1 in Oxidative Stress and Mitochondrial Dysfunction in Alzheimer's Disease

Sanjay Awasthi et al. Cells. .

Abstract

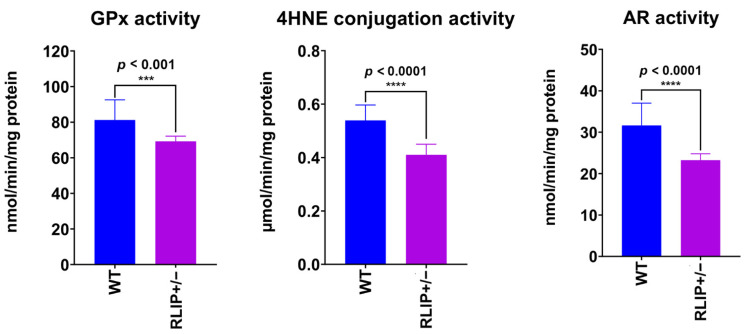
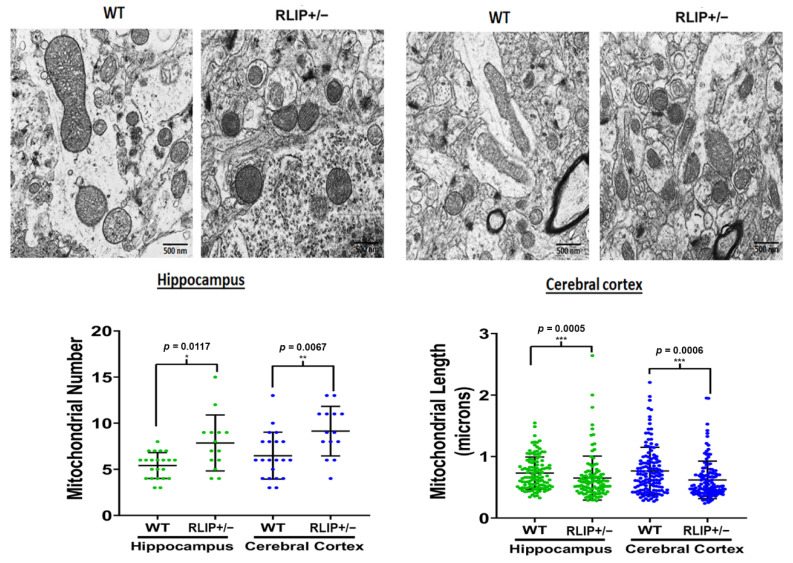
The purpose of our study is to understand the role of the RALBP1 gene in oxidative stress (OS), mitochondrial dysfunction and cognition in Alzheimer's disease (AD) pathogenesis. The RALPB1 gene encodes the 76 kDa protein RLIP76 (Rlip). Rlip functions as a stress-responsive/protective transporter of glutathione conjugates (GS-E) and xenobiotic toxins. We hypothesized that Rlip may play an important role in maintaining cognitive function. The aim of this study is to determine whether Rlip deficiency in mice is associated with AD-like cognitive and mitochondrial dysfunction. Brain tissue obtained from cohorts of wildtype (WT) and Rlip+/- mice were analyzed for OS markers, expression of genes that regulate mitochondrial fission/fusion, and synaptic integrity. We also examined mitochondrial ultrastructure in brains obtained from these mice and further analyzed the impact of Rlip deficiency on gene networks of AD, aging, stress response, mitochondrial function, and CREB signaling. Our studies revealed a significant increase in the levels of OS markers and alterations in the expression of genes and proteins involved in mitochondrial biogenesis, dynamics and synapses in brain tissues from these mice. Furthermore, we compared the cognitive function of WT and Rlip+/- mice. Behavioral, basic motor and sensory function tests in Rlip+/- mice revealed cognitive decline, similar to AD. Gene network analysis indicated dysregulation of stress-activated gene expression, mitochondrial function and CREB signaling genes in the Rlip+/- mouse brain. Our results suggest that Rlip deficiency-associated increases in OS and mitochondrial dysfunction could contribute to the development or progression of OS-related AD processes.

Keywords: Alzheimer’s disease; mitochondria; mitochondrial biogenesis; mitophagy; synaptic proteins.


Conflict of interest statement

The authors, except S.A., do not have any competing financial interests that could influence, or give the perception of such influence on, the behavior or content in a way that could undermine the objectivity, integrity or perceived value of this publication. S.A. is a founder of AVESTA76 Therapeutics, which will develop Rlip-targeting small molecules for therapy.

Figures

Figure 1
Figure 1
Behavioral differences between Rlip+/− and wildtype (WT) mice increase with age. (A) In a study of 5 Rlip+/− mice and 5 WT mice of 7–9 months of age, both groups exhibited habituation over the course of 10 min with reduced distance traveled (F(4,32) = 30.8; p < 0.0001) and mobility (F(2.2,17.9) = 37.35; p < 0.0001). Rlip+/− mice were less mobile than WT mice (F(1,8) = 7.4, p = 0.0260). (B) Rlip+/− mice tended to exhibit shallower turn angles in comparison to WT, which trended towards significance for both turn angle (F(1,8) = 5.2, p = 0.051), and, correcting for distance traveled, meander (F(1,8) = 4.5, p = 0.067). (C) In a study of 5 Rlip+/− mice and 5 WT mice of 10–12 months of age, both groups exhibited habituation over the course of 10 min with reduced distance traveled (F(4,32) = 7.62; p = 0.0002) and mobility (F(4,32) = 7.38; p = 0.0003). (D) Rlip+/− mice tended to exhibit a shallower turn angle compared to WT, which was more pronounced in aged mice (F(1,8) = 8.12, p = 0.022), and, correcting for distance traveled, increased meander (F(1,8) = 17.0, p = 0.0033). Significant differences (p < 0.05) at specific time points from post-hoc analysis (Fisher’s Least Significant Difference) are indicated with asterisks (*).
Figure 2
Figure 2
Rlip deficiency decreases the latency to fall of mice on Rotarod performance testing. Analysis of locomotor activity was measured by latency to fall off a spinning rotarod for 5 Rlip+/− mice and 5 wildtype (WT) mice of 10–12 months of age. Latency to fall was significantly decreased in Rlip+/− mice (p = 0.0009, post-hoc analysis by Fisher’s Least Significant Difference). *** indicates p < 0.001.
Figure 3
Figure 3
Rlip deficiency alters the willingness of mice for spatial learning. Spatial learning in 10–12-month-old mice was assessed by the Morris Water Maze test as cognitive function measure. Mean latency to find the platform and mean time spent in target quadrant are shown (n = 5 animals of each genotype). Significance was determined by post-hoc analysis (Fisher’s Least Significant Difference). * indicates p < 0.05 and ns indicates not significant.
Figure 4
Figure 4
(A) Effect of Rlip deficiency on expression of genes that regulate mitochondrial dynamics. qRT-PCR was performed by previously described methods on mouse brain homogenates from five wildtype (WT) and five Rlip+/− mice. Levels of transcripts encoding mitochondrial dynamics proteins were measured in the cerebral cortex of WT and Rlip+/− animals. Gene expression levels were normalized to the beta-actin transcript and calculated as described in Materials and Methods. Asterisks denote statistically significant differences between WT and Rlip+/− groups of animals, compared using a Student’s t-test. (B). Effect of Rlip deficiency on expression of genes that regulate mitochondrial biogenesis. qRT-PCR was performed by previously described methods on mouse brain homogenates from 5 WT and 5 Rlip+/− mice. Levels of transcripts encoding mitochondrial biogenesis proteins were measured in the cerebral cortex of WT and Rlip+/− animals. (C) Effect of Rlip deficiency on expression of synaptic genes. qRT-PCR was performed by previously described methods on mouse brain homogenates from 5 WT and 5 Rlip+/− mice. Levels of transcripts encoding synaptic proteins were measured in the cerebral cortex of WT and Rlip+/− animals. * indicates p < 0.05, ** indicates p < 0.01, *** indicates p < 0.001, and ns indicates not significant.
Figure 5
Figure 5
Expression of key mitochondrial proteins in the brain of wildtype (WT) and Rlip+/− mice. Rlip deficiency alters proteins regulating (A) mitochondrial dynamics, (B) mitochondrial biogenesis and (C) synaptic functions. Brain homogenates from WT and Rlip+/− mice were examined by Western blot analysis (A–C). Quantitation of the protein bands by densitometry, normalized to β-actin using ImageJ software (developed by NIH), is shown in (D–F) to indicate the average expression levels of proteins. Asterisks denote statistically significant differences between WT and Rlip+/− groups of animals, compared using Student’s t-test. (D) Quantitation of the mitochondrial dynamics bands by densitometry, normalized to β-actin. (E) Quantitation of the mitochondrial biogenesis bands by densitometry, normalized to β-actin. (F) Quantitation of synaptic protein bands by densitometry, normalized to β-actin. * indicates p < 0.05, ** indicates p < 0.01, *** indicates p < 0.001, and ns indicates not significant.
Figure 5
Figure 5
Expression of key mitochondrial proteins in the brain of wildtype (WT) and Rlip+/− mice. Rlip deficiency alters proteins regulating (A) mitochondrial dynamics, (B) mitochondrial biogenesis and (C) synaptic functions. Brain homogenates from WT and Rlip+/− mice were examined by Western blot analysis (A–C). Quantitation of the protein bands by densitometry, normalized to β-actin using ImageJ software (developed by NIH), is shown in (D–F) to indicate the average expression levels of proteins. Asterisks denote statistically significant differences between WT and Rlip+/− groups of animals, compared using Student’s t-test. (D) Quantitation of the mitochondrial dynamics bands by densitometry, normalized to β-actin. (E) Quantitation of the mitochondrial biogenesis bands by densitometry, normalized to β-actin. (F) Quantitation of synaptic protein bands by densitometry, normalized to β-actin. * indicates p < 0.05, ** indicates p < 0.01, *** indicates p < 0.001, and ns indicates not significant.
Figure 6
Figure 6
(A) Immunofluorescence analysis of mitochondrial dynamics in the neurons of the hippocampi of wildtype (WT) and Rlip+/− mice. A comparison of hippocampal expression of mitochondrial dynamics and proteins between WT and Rlip+/− mice showed significant increases in Drp1, Fis1 and a decrease in Mfn1 expression in Rlip+/− mice compared with WT mice. (B) Immunofluorescence analysis of mitochondrial biogenesis proteins in the neurons of the hippocampi of WT and Rlip+/− mice. A comparison of hippocampal expression of mitochondrial biogenesis proteins between WT and Rlip+/− mice showed significant increases in PGC1a and Nrf1 expression in Rlip+/− mice compared with WT mice. (C) Immunofluorescence analysis of synaptic proteins in the neurons of the hippocampi of WT and Rlip+/− mice. A comparison of hippocampal expression of synaptic proteins between WT and Rlip+/− mice showed significant decreases in synaptophysin and PSD95 expression in Rlip+/− mice compared with WT mice. * indicates p < 0.05, ** indicates p < 0.01, and *** indicates p < 0.001.
Figure 6
Figure 6
(A) Immunofluorescence analysis of mitochondrial dynamics in the neurons of the hippocampi of wildtype (WT) and Rlip+/− mice. A comparison of hippocampal expression of mitochondrial dynamics and proteins between WT and Rlip+/− mice showed significant increases in Drp1, Fis1 and a decrease in Mfn1 expression in Rlip+/− mice compared with WT mice. (B) Immunofluorescence analysis of mitochondrial biogenesis proteins in the neurons of the hippocampi of WT and Rlip+/− mice. A comparison of hippocampal expression of mitochondrial biogenesis proteins between WT and Rlip+/− mice showed significant increases in PGC1a and Nrf1 expression in Rlip+/− mice compared with WT mice. (C) Immunofluorescence analysis of synaptic proteins in the neurons of the hippocampi of WT and Rlip+/− mice. A comparison of hippocampal expression of synaptic proteins between WT and Rlip+/− mice showed significant decreases in synaptophysin and PSD95 expression in Rlip+/− mice compared with WT mice. * indicates p < 0.05, ** indicates p < 0.01, and *** indicates p < 0.001.
Figure 7
Figure 7
Antioxidant enzyme activities in Rlip+/− mouse brains are lower than in corresponding control wildtype mice. Brain tissue homogenates were prepared from three wildtype mice and three Rlip+/− mice, and enzyme activity was measured in triplicate in individual homogenates using spectrophotometric assays as described in Methods. The difference in enzyme activity between WT and Rlip+/− mice was significant for all tissues studied. *** indicates p < 0.001 and **** indicates p < 0.0001.
Figure 8
Figure 8
Electron micrographs demonstrating changes in mitochondria number and length in Rlip+/− mice relative to wildtype (WT) mice. Transmission electron microscopy was performed using hippocampal and cortical tissues from 10-month-old Rlip+/− (n = 5) and wildtype mice (n = 5). Mitochondrial number and length were assessed using previously published methods [67,74]. * indicates p < 0.05, ** indicates p < 0.01, and *** indicates p < 0.001.
Figure 9
Figure 9
A hypothetical model of the role of Rlip-regulated expression of stress-defense genes controlled by Nrf2, p53 and EP300. Red arrows represent inhibition, and green arrows represent activation. Note that according to this hypothesis, the etiological agents of neurodegenerative diseases inhibit activation of Rlip expression, which normally inhibits lipid peroxidation and neurodegeneration. Red shaded ovals indicated pathological effects and green shaded ovals indicate effects which promote neuronal health. More saturated shades indicated a greater effect strength and lighter shades indicate a reduced effect strength.

References

    1. Knopman D.S., DeKosky S.T., Cummings J.L., Chui H., Corey-Bloom J., Relkin N., Small G.W., Miller B., Stevens J.C. Practice parameter: Diagnosis of dementia (an evidence-based review). Report of the Quality Standards Subcommittee of the American Academy of Neurology. Neurology. 2001;56:1143–1153. doi: 10.1212/WNL.56.9.1143. - DOI - PubMed
    1. Alzheimer’s Association Report 2020 Alzheimer’s disease facts and figures. Alzheimer’s Dement. 2020;16:319–460. doi: 10.1002/alz.12068. - DOI - PubMed
    1. Colnaghi L., Rondelli D., Muzi-Falconi M., Sertic S. Tau and DNA Damage in Neurodegeneration. Brain Sci. 2020;10:946. doi: 10.3390/brainsci10120946. - DOI - PMC - PubMed
    1. Iqbal K., Liu F., Gong C.X., Grundke-Iqbal I. Tau in Alzheimer disease and related tauopathies. Curr. Alzheimer Res. 2010;7:656–664. doi: 10.2174/156720510793611592. - DOI - PMC - PubMed
    1. Mormino E.C., Betensky R.A., Hedden T., Schultz A.P., Amariglio R.E., Rentz D.M., Johnson K.A., Sperling R.A. Synergistic effect of β-amyloid and neurodegeneration on cognitive decline in clinically normal individuals. JAMA Neurol. 2014;71:1379–1385. doi: 10.1001/jamaneurol.2014.2031. - DOI - PMC - PubMed

Publication types

MeSH terms

Grants and funding