. 2021 Nov 11;10(11):3122.
doi: 10.3390/cells10113122.

L-Arginine Ameliorates Defective Autophagy in GM2 Gangliosidoses by mTOR Modulation

Affiliations

L-Arginine Ameliorates Defective Autophagy in GM2 Gangliosidoses by mTOR Modulation

Beatriz Castejón-Vega et al. Cells. .

Abstract

Aims: Tay-Sachs and Sandhoff diseases (GM2 gangliosidosis) are autosomal recessive disorders of lysosomal function that cause progressive neurodegeneration in infants and young children. Impaired hydrolysis catalysed by β-hexosaminidase A (HexA) leads to the accumulation of GM2 ganglioside in neuronal lysosomes. Despite the storage phenotype, the role of autophagy and its regulation by mTOR has yet to be explored in the neuropathogenesis. Accordingly, we investigated the effects on autophagy and lysosomal integrity using skin fibroblasts obtained from patients with Tay-Sachs and Sandhoff diseases.

Results: Pathological autophagosomes with impaired autophagic flux, an abnormality confirmed by electron microscopy and biochemical studies revealing the accelerated release of mature cathepsins and HexA into the cytosol, indicating increased lysosomal permeability. GM2 fibroblasts showed diminished mTOR signalling with reduced basal mTOR activity. Accordingly, provision of a positive nutrient signal by L-arginine supplementation partially restored mTOR activity and ameliorated the cytopathological abnormalities.

Innovation: Our data provide a novel molecular mechanism underlying GM2 gangliosidosis. Impaired autophagy caused by insufficient lysosomal function might represent a new therapeutic target for these diseases.

Conclusions: We contend that the expression of autophagy/lysosome/mTOR-associated molecules may prove useful peripheral biomarkers for facile monitoring of treatment of GM2 gangliosidosis and neurodegenerative disorders that affect the lysosomal function and disrupt autophagy.

Keywords: GM2 gangliosidosis; L-arginine; autophagy; mTOR.


Conflict of interest statement

All the authors declare that no conflict of interest exists for any of them.

Figures
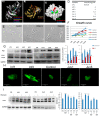
Figure 1
Figure 1
Model structures of HexA (PDB:2GJX) and HexB (PDB:1NOU) sub-unit proteins, highlighting the location of pathogenic mutations. Also shown autophagy in fibroblasts obtained in culture from patients with GM2 gangliosidosis (Tay–Sachs and Sandhoff diseases). (A). HexA point mutations: different colours depict amino acid substitutions identified in the cognate structures identified in different mutations studied. (B). Frameshift mutations in the alpha subunits found in two patients with Tay–Sachs disease are shown in yellow and orange; premature stop codons are marked by an asterisk. (C). The surface of hexosaminidase A with the critical active site region required for hydrolysis of GM2 ganglioside (CRH_GM2). The propeptide is shown in grey and the mature protein chain is depicted in white. (D). Enzymatic activity of HexA in fibroblast homogenates. (E). Morphological changes in fibroblasts from Tay–Sachs patients compared with control cells. (F). Cell growth determined in healthy and Tay–Sachs fibroblasts. (G). Expression of autophagy proteins in control and Tay–Sachs fibroblasts: LC3-I (top panels, top band), LC3-II (top panels, bottom band). (H). Immunofluorescence staining with anti-p62 antibody. (I). Impaired autophagic flux in Tay–Sachs fibroblasts. Determination of LC3-II in the presence and absence of bafilomycin A1 in control (CTL) and fibroblasts from Tay–Sachs patients; bafilomycin A1 was used at a final concentration of 100 nM with 12 h exposure. Total cellular extracts were analysed by immunoblotting with antibodies against LC3. The data are the mean ± SD for experiments conducted on two different control cell lines. Data represent the mean ± SD of three separate experiments. *** p < 0.001, ** p < 0.005, * p < 0.05 between cells from control subjects and patients with Tay–Sachs disease. a p < 0.05; aa p < 0.01; aaa p < 0.001.
Figure 2
Figure 2
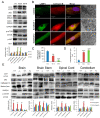
(A). Control fibroblasts and those from patients with Tay–Sachs disease showing typical ultrastructure with several distinct lamellar bodies (black arrows); white arrows indicate autophagosomes. Insets show multilamellar bodies (MLBs) and membrane-bound structures with cytoplasmic and cellular contents found in patient fibroblasts. Scale bar 10 µm (low magnification) and 2 µm (high magnification) (n = 20 cells per case). (B). Quantitative analysis of autophagosomes. (C,E). Representative image of fibroblasts after transfection of the dual-labelled mCherry-GFP-LC3 plasmid and quantification of autophagic puncta (see Methods). (D,F). Immunofluorescence of LC3 and cytochrome c in control and pathological cells and quantification of mitophagy puncta. Data represent the mean–SD of three separate experiments. *** p < 0.001, ** p < 0.005 between controls and Tay–Sachs patients.
Figure 3
Figure 3
(A). Expression of CatB, CatD, and HexA protein were determined in control fibroblasts and those cultured from patients with Tay–Sachs disease. (B,D). Immunofluorescence of CatB in control and pathological cells and quantification. (C,E). Immunofluorescence of HexA in control and Tay–Sachs cells with signal quantification. Note that in Tay–Sachs fibroblasts CatB and HexA immunoreactivity is diffused throughout the cytosol. (F). Cellular fractionation with the isolation of cytosol and lysosomes and protein expression of CatB B and HexA. For control cells, results from two different control cell lines. Data represent the mean ± SD of three separate experiments. * p < 0.05; ** p < 0.01; *** p < 0.001 between control and patients with Tay–Sachs disease. a p < 0.05; aa p < 0.01; aaa p < 0.001; b p < 0.05; bb p < 0.01, bbb p < 0.001
Figure 4
Figure 4
Expression of mTOR and AKT protein were determined in cultured control and Tay–Sachs disease fibroblasts. Data represent the mean ± SD of three separate experiments.* p < 0.05; ** p < 0.01; *** p < 0.001 between transfected and non-transfected cells.
Figure 5
Figure 5
(A). Expression of LC3, p62, CatB, CatD, mTOR and AKT proteins determined in human control and Sandhoff disease fibroblasts. (B,C). Immunofluorescence of CatB in control and pathological cells with quantification in Sandhoff disease fibroblasts. (B,D). Characteristic ultrastructure with altered autophagosome abundance quantified in Sandhoff disease fibroblasts. (E). Expression of LC3, p62, CatB and mTOR proteins in the brain and spinal cord obtained from wild type and hexb −/− mutant mice with GM2 gangliosidosis (Sandhoff disease). Densitometry results are presented as means ± SEM, n = 10 mice. * p < 0.05; ** p < 0.01; *** p < 0.001 between control and diseased fibroblasts and wild type and hexB −/− mutant mice.
Figure 6
Figure 6
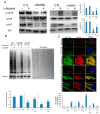
(A). Expression of mTOR and AKT determined in control and representative Tay–Sachs fibroblasts after L-arginine treatment. (B). Protein synthesis was quantified in extracts of control and Tay–Sachs fibroblasts treated with L-arginine using puromycin labeling followed by immunoblotting. (C). Representative image of Tay–Sachs treated fibroblasts after transfection of the mCherry-GFP-LC3 plasmid and quantification of autophagic puncta. For control cells, the data are the mean ± SD for experiments conducted on two different control cell lines. GAPDH was used as a loading control. Data represent the mean ± SD of three separate experiments. *** p < 0.001 between control and Tay–Sachs fibroblasts; aa p < 0.01; aaa p < 0.001 between non-treated and treated cells.
Figure 7
Figure 7
(A,B). Immunofluorescence of CatB and HexA in control and Sandhoff disease fibroblasts and quantification after L-arginine treatment. (C). Expression of CatB and HexA protein were determined in control and representative Tay–Sachs fibroblast cultures after L-arginine treatment in vivo. (D). Expression of mTOR, CatB, and ASS1 (arginosuccinate synthetase) proteins was determined in peripheral blood mononuclear cells obtained from a patient with juvenile Tay–Sachs disease and a patient with juvenile Sandoff disease after oral L-arginine treatment. Data represent the mean ± SD of three separate experiments.* p < 0.05; ** p < 0.01; *** p < 0.001 between control and Tay–Sachs patients; a p < 0.05; aa p < 0.01; aaa p < 0.001 between non-treated and treated cells.

References

    1. Jiang P., Mizushima N. Autophagy and human diseases. Cell Res. 2014;24:69–79. doi: 10.1038/cr.2013.161. - DOI - PMC - PubMed
    1. Arvio M., Mononen I. Aspartylglycosaminuria: A review. Orphanet. J. Rare Dis. 2016;11:162. doi: 10.1186/s13023-016-0544-6. - DOI - PMC - PubMed
    1. Munson M.J., Ganley I.G. MTOR, PIK3C3, and autophagy: Signaling the beginning from the end. Autophagy. 2015;11:2375–2376. doi: 10.1080/15548627.2015.1106668. - DOI - PMC - PubMed
    1. Sarkar S., Carroll B., Buganim Y., Maetzel D., Ng A.H., Cassady J.P., Cohen M.A., Chakraborty S., Wang H., Spooner E., et al. Impaired autophagy in the lipid-storage disorder Niemann-Pick type C1 disease. Cell Rep. 2013;5:1302–1315. doi: 10.1016/j.celrep.2013.10.042. - DOI - PMC - PubMed
    1. Lim J.A., Li L., Shirihai O.S., Trudeau K.M., Puertollano R., Raben N. Modulation of mTOR signaling as a strategy for the treatment of Pompe disease. EMBO Mol. Med. 2017;9:353–370. doi: 10.15252/emmm.201606547. - DOI - PMC - PubMed

Publication types

MeSH terms