

Sensitivity and Specificity of CD19.CAR-T Cell Detection by Flow Cytometry and PCR
- PMID: 34831430
- PMCID: PMC8621201
- DOI: 10.3390/cells10113208
Sensitivity and Specificity of CD19.CAR-T Cell Detection by Flow Cytometry and PCR
Abstract
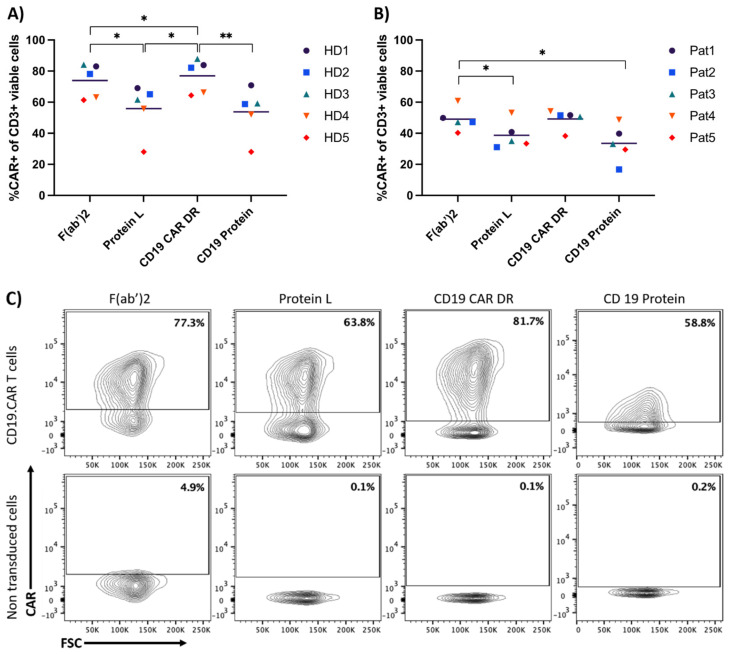
Chimeric-antigen-receptor-T (CAR-T) cells are currently revolutionizing the field of cancer immunotherapy. Therefore, there is an urgent need for CAR-T cell monitoring by clinicians to assess cell expansion and persistence in patients. CAR-T cell manufacturers and researchers need to evaluate transduction efficiency and vector copy number for quality control. Here, CAR expression was analyzed in peripheral blood samples from patients and healthy donors by flow cytometry with four commercially available detection reagents and on the gene level by quantitative polymerase chain reaction (qPCR). Flow cytometric analysis of CAR expression showed higher mean CAR expression values for CD19 CAR detection reagent and the F(ab')2 antibody than Protein L and CD19 Protein. In addition, the CD19 CAR detection reagent showed a significantly lower median background staining of 0.02% (range 0.007-0.06%) when compared to the F(ab')2 antibody, CD19 protein and Protein L with 0.80% (range 0.47-1.58%), 0.65% (range 0.25-1.35%) and 0.73% (range 0.44-1.23%). Furthermore, flow cytometry-based CAR-T cell frequencies by CD19 CAR detection reagent showed a good correlation with qPCR results. In conclusion, quality control of CAR-T cell products can be performed by FACS and qPCR. For the monitoring of CAR-T cell frequencies by FACS in patients, CAR detection reagents with a low background staining are preferable.
Keywords: CD19.CAR-T cells; detection reagent; flow cytometry (FACS); polymerase chain reaction (PCR).
Conflict of interest statement
M.S. received funding for collaborative research from Apogenix, Hexal and Novartis, travel grants from Hexal and Kite, he received financial support for educational activities and conferences from bluebird bio, Kite and Novartis, he is a board member for MSD and (co-)PI of clinical trials of MSD, GSK, Kite and BMS, as well as co-Founder and shareholder of TolerogenixX Ltd. A.S. received travel grants from Hexal and Jazz Pharmaceuticals, research grant from Therakos/Mallinckrodt and is co-founder of TolerogenixX Ltd. A.S. is part-time employee of TolerogenixX Ltd. M.-L.S.: consultancy for Kite/Gilead, Takeda. Advisory board Kite/Gilead, Janssen. C.M.-T.: Bayer AG (research support). Pfizer, Janssen-Cilag GmbH (advisory board member). Pfizer, Daiichi Sankyo, BiolineRx (grants and/or provision of investigational medicinal products). The other authors declare no conflict of interest.
Figures


References
-
- Dreger P., Dietrich S., Schubert M.L., Selberg L., Bondong A., Wegner M., Stadtherr P., Kimmich C., Kosely F., Schmitt A., et al. CAR T cells or allogeneic transplantation as standard of care for advanced large B-cell lymphoma: An intent-to-treat comparison. Blood Adv. 2020;4:6157–6168. doi: 10.1182/bloodadvances.2020003036. - DOI - PMC - PubMed
-
- Maude S.L., Laetsch T.W., Buechner J., Rives S., Boyer M., Bittencourt H., Bader P., Verneris M.R., Stefanski H.E., Myers G.D., et al. Tisagenlecleucel in Children and Young Adults with B-Cell Lymphoblastic Leukemia. N. Engl. J. Med. 2018;378:439–448. doi: 10.1056/NEJMoa1709866. - DOI - PMC - PubMed
-
- Neelapu S.S., Locke F.L., Bartlett N.L., Lekakis L.J., Miklos D.B., Jacobson C.A., Braunschweig I., Oluwole O.O., Siddiqi T., Lin Y., et al. Axicabtagene Ciloleucel CAR T-Cell Therapy in Refractory Large B-Cell Lymphoma. N. Engl. J. Med. 2017;377:2531–2544. doi: 10.1056/NEJMoa1707447. - DOI - PMC - PubMed
-
- Litwin V., Hanafi L., Mathieu M., Pouliot P., Boulais P. Strategies for successful monitoring of CAR T-cells by flow cytometry. Cytotherapy. 2020;22:S130. doi: 10.1016/j.jcyt.2020.03.252. - DOI
Publication types
MeSH terms
Substances
Grants and funding
LinkOut - more resources
Full Text Sources
Other Literature Sources
