. 2021 Nov 19;10(11):3238.
doi: 10.3390/cells10113238.

Transcriptional Profiles of Cell Fate Transitions Reveal Early Drivers of Neuronal Apoptosis and Survival

Affiliations

Transcriptional Profiles of Cell Fate Transitions Reveal Early Drivers of Neuronal Apoptosis and Survival

Giovanna Morello et al. Cells. .

Abstract

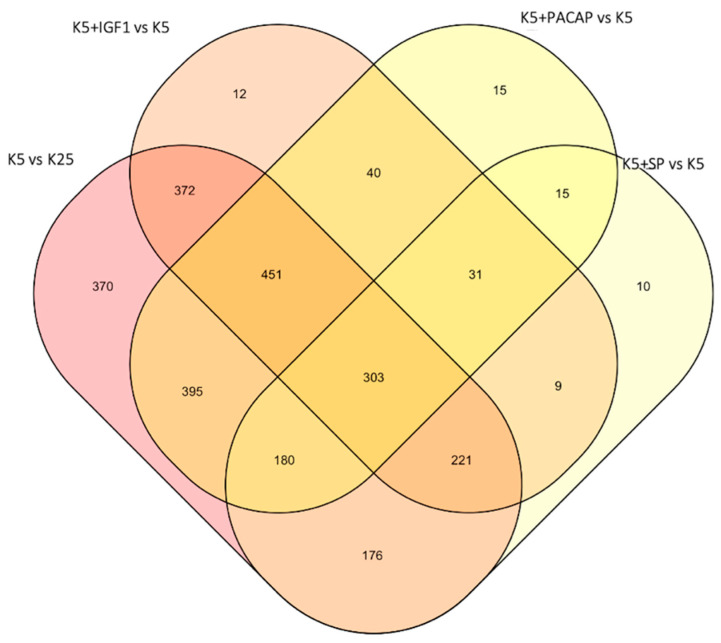
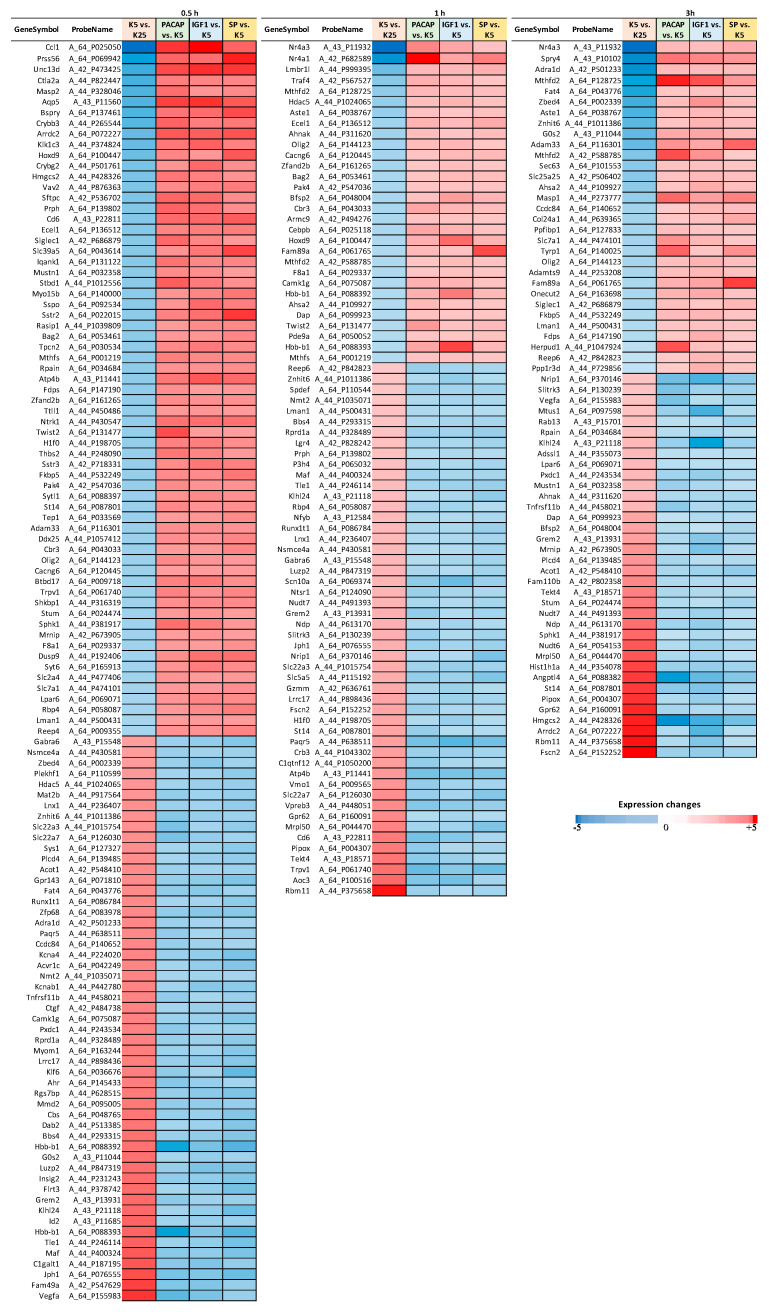
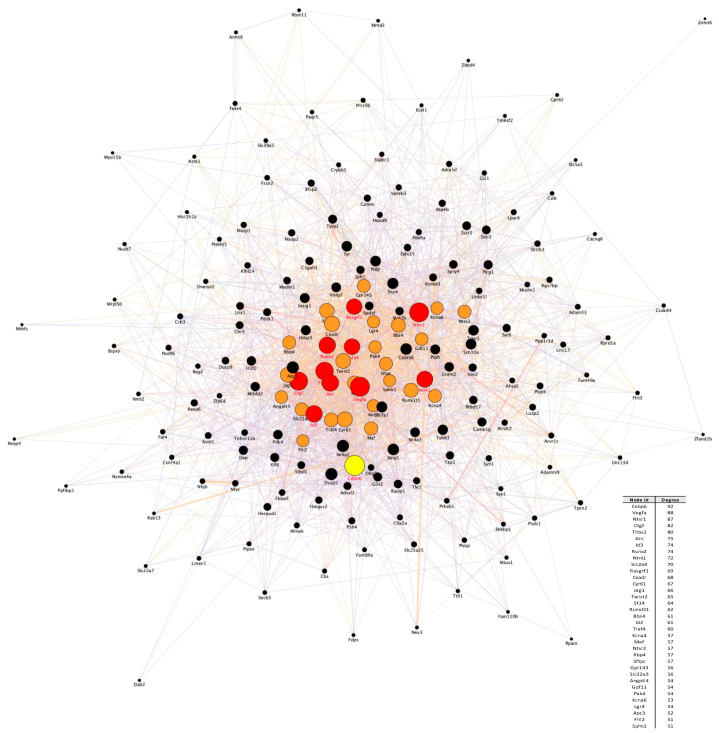
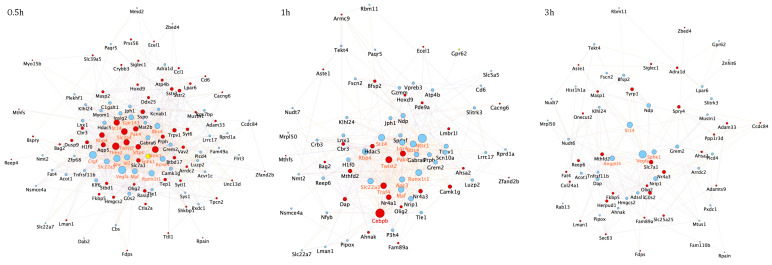
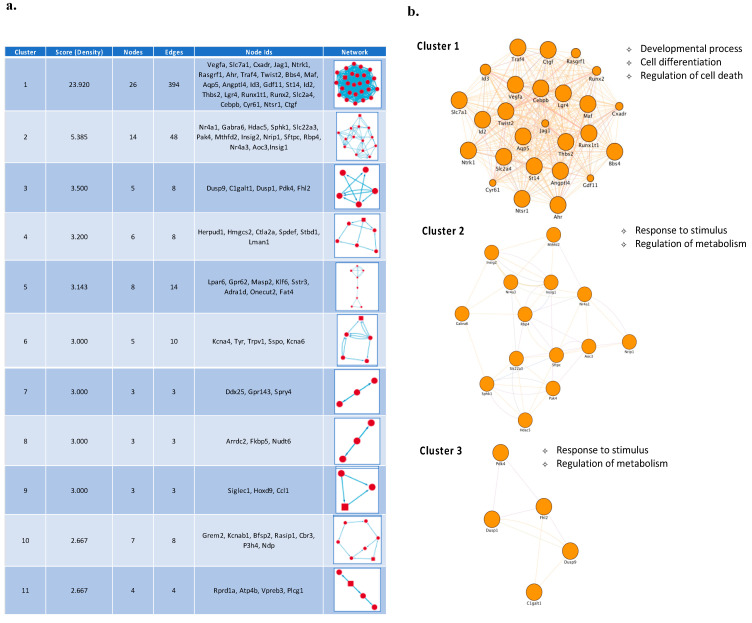
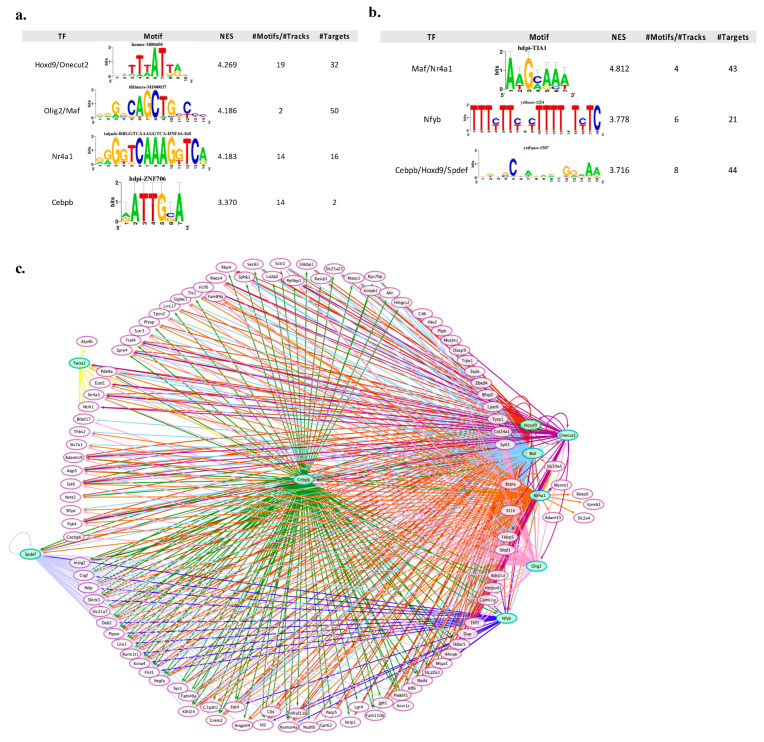
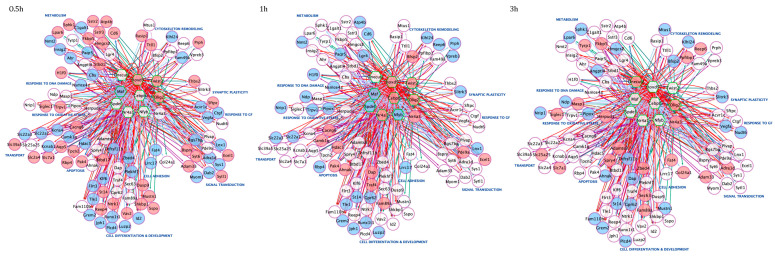
Neuronal apoptosis and survival are regulated at the transcriptional level. To identify key genes and upstream regulators primarily responsible for these processes, we overlayed the temporal transcriptome of cerebellar granule neurons following induction of apoptosis and their rescue by three different neurotrophic factors. We identified a core set of 175 genes showing opposite expression trends at the intersection of apoptosis and survival. Their functional annotations and expression signatures significantly correlated to neurological, psychiatric and oncological disorders. Transcription regulatory network analysis revealed the action of nine upstream transcription factors, converging pro-apoptosis and pro-survival-inducing signals in a highly interconnected functionally and temporally ordered manner. Five of these transcription factors are potential drug targets. Transcriptome-based computational drug repurposing produced a list of drug candidates that may revert the apoptotic core set signature. Besides elucidating early drivers of neuronal apoptosis and survival, our systems biology-based perspective paves the way to innovative pharmacology focused on upstream targets and regulatory networks.

Keywords: apoptosis; disease; drug repurposing; drug targets; functional enrichment; neurotrophic factors; regulatory network; survival; transcriptional analysis.


Conflict of interest statement

The authors declare no conflict of interest.

Figures

Figure 1
Figure 1
Venn diagram showing the number of genes differentially expressed in CGNs over time following induction of apoptosis (K5 vs. K25) or following rescue by SP, Pacap and Igf1. Of note, 262 genes (303 probes) were differentially expressed in all experimental conditions.
Figure 2
Figure 2
Heat maps showing the 175 core set genes, which were deregulated in CGNs during apoptosis or rescue by GFs and showed opposite expression in at least one-time point. Among them, 117 genes showed an opposite expression pattern at 0.5 h, 78 genes at 1 h and 67 genes at 3 h. Fold changes are shown by colors.
Figure 3
Figure 3
PPI network analysis. The PPI network for the 175 core set genes containing 187 nodes and 2668 interactions was constructed using the STRING website and visualized by Cytoscape (version: 3.8.2,) by mapping the “degree parameter” to node size. As the node size increased, the value of the connectivity degree of node genes increased. Proteins with a degree connectivity of >50 represent the most significant nodes in the PPI network and are colored from orange to red based on their node degree. Cebpb is the most interconnected node (hub) in the network and is colored in yellow. Differently colored “edges” indicate the type of evidence supporting each interaction: dark purple, co-expression; light purple, physical interaction; light blue, co-localization; light green, shared protein domain; orange, predicted; grey, other.
Figure 4
Figure 4
Temporal specific core set genes-related PPI networks. The three time-point (0.5, 1 and 3 h) specific core set genes-related PPI networks were constructed using the STRING website and visualized by Cytoscape (version: 3.8.2,) by mapping the “degree parameter” to node size. As the node size increased, the value of the connectivity degree of node genes increased. Light blue/red nodes indicate, respectively, down-/upregulated genes following treatment with all GFs compared with apoptotic CGNs (K5). Differently colored “edges” indicate the type of evidence supporting each interaction: dark purple, co-expression; light purple, physical interaction; light blue, co-localization; light green, shared protein domain; orange, predicted; grey, other.
Figure 5
Figure 5
PPI network cluster analysis. (a) Sub-network analysis in the PPI network using MCODE identified 11 significant modules/clusters Cluster analysis in the PPI network resulted in 7 clusters, which include 72 nodes and 276 edges, and are enriched for several biological process GO terms. (b) Cluster 1, Cluster 2 and Cluster 3 of the top three network clusters in the sub-network analysis of PPI networks of core set genes. These clusters had the highest scores among the clusters. The cluster networks were visualized by Cytoscape by mapping the “degree parameter” to node size.
Figure 6
Figure 6
The upstream regulatory network is predicted to regulate the expression of the survival-related gene signatures in CGNs. (a) Result summary of the regulatory analysis with iRegulon on up-regulated core set genes. (b) Result summary of the regulatory analysis with iRegulon on downregulated core set genes. In particular, the top transcription binding motifs and their associated transcription factors (filtered for TF differentially expressed in our analysis) are shown. (c) The whole overview of the regulatory network of 9 key TFs together with their core set candidate targets. The network was visualized by Cytoscape. Targets are in white circle nodes with purple borders and TF in green hexagon nodes. Regulons for each TF are represented by different edge colors.
Figure 7
Figure 7
Time-course TF-gene regulatory networks revealed a common early and transient peak of transcription of upstream regulators modulating the expression of core set genes. Networks were visualized by Cytoscape. For each time-point, the node color is consistent with the logFC of each gene: genes in blue are downregulated by GF treatment, whereas the genes in red are upregulated. Targets are represented as circle nodes with purple borders and TF as green hexagon nodes. Regulons for each TF are represented by different edge colors. Target genes are grouped according to their biological functions.

References

    1. Mattson M.P. Neuronal Life-and-Death Signaling, Apoptosis, and Neurodegenerative Disorders. Antioxid. Redox Signal. 2006;8:1997–2006. doi: 10.1089/ars.2006.8.1997. - DOI - PubMed
    1. Ceci M., Fazi F., Romano N. The role of RNA-binding and ribosomal proteins as specific RNA translation regulators in cellular differentiation and carcinogenesis. Biochim. Biophys. Acta Mol. Basis Dis. 2021;1867:166046. doi: 10.1016/j.bbadis.2020.166046. - DOI - PubMed
    1. Loffreda A., Rigamonti A., Barabino S.M.L., Lenzken S.C. RNA-Binding Proteins in the Regulation of miRNA Activity: A Focus on Neuronal Functions. Biomolecules. 2015;5:2363–2387. doi: 10.3390/biom5042363. - DOI - PMC - PubMed
    1. Datta A., Sarmah D., Mounica L., Kaur H., Kesharwani R., Verma G., Veeresh P., Kotian V., Kalia K., Borah A., et al. Cell Death Pathways in Ischemic Stroke and Targeted Pharmacotherapy. Transl. Stroke Res. 2020;11:1185–1202. doi: 10.1007/s12975-020-00806-z. - DOI - PubMed
    1. Mattson M.P. Apoptosis in neurodegenerative disorders. Nat. Rev. Mol. Cell Biol. 2000;1:120–129. doi: 10.1038/35040009. - DOI - PubMed

MeSH terms

Substances