. 2021 Nov 9;18(22):11753.
doi: 10.3390/ijerph182211753.

Estimating Economic Losses Caused by COVID-19 under Multiple Control Measure Scenarios with a Coupled Infectious Disease-Economic Model: A Case Study in Wuhan, China

Affiliations

Estimating Economic Losses Caused by COVID-19 under Multiple Control Measure Scenarios with a Coupled Infectious Disease-Economic Model: A Case Study in Wuhan, China

Xingtian Chen et al. Int J Environ Res Public Health. .

Abstract

Background: The outbreak of the COVID-19 epidemic has caused an unprecedented public health crisis and drastically impacted the economy. The relationship between different control measures and economic losses becomes a research hotspot.

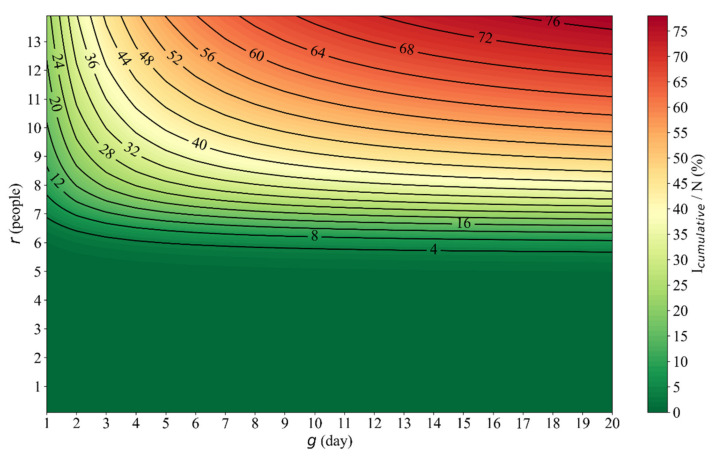
Methods: In this study, the SEIR infectious disease model was revised and coupled with an economic model to quantify this nonlinear relationship in Wuhan. The control measures were parameterized into two factors: the effective number of daily contacts (people) (r); the average waiting time for quarantined patients (day) (g).

Results: The parameter r has a threshold value that if r is less than 5 (people), the number of COVID-19 infected patients is very close to 0. A "central valley" around r = 5~6 can be observed, indicating an optimal control measure to reduce economic losses. A lower value of parameter g is beneficial to stop COVID-19 spread with a lower economic cost.

Conclusion: The simulation results demonstrate that implementing strict control measures as early as possible can stop the spread of COVID-19 with a minimal economic impact. The quantitative assessment method in this study can be applied in other COVID-19 pandemic areas or countries.

Keywords: COVID-19; control measures; economic losses; infectious diseases model.


Conflict of interest statement

The authors declare no conflict of interest.

Figures

Figure 1
Figure 1
The framework of the infectious disease model. The black solid line indicates the transmission dynamics of the COVID-19 epidemic in each compartment.
Figure 2
Figure 2
The framework of estimating total economic losses under various control measures.
Figure 3
Figure 3
Simulated cases from the five-stage model were verified with the COVID-19 confirmed cases in Wuhan. The confirmed case data comes from The Chinese Centers for Disease Control and Prevention. The fitting technique of the five-stage model was introduced in Section 2.1.2.
Figure 4
Figure 4
The contour map of the cumulative number of COVID-19 infected patients in Wuhan, where r is the effective number of daily contacts; g is the average waiting time for quarantined patients; Icumulative is the cumulative number of infected patients; N is the total population.
Figure 5
Figure 5
Reduction percentage of each industry sector under the different level of contact activity in Wuhan. The weighted level in Wuhan is the reduction in contact activity caused by the COVID-19 outbreak in Wuhan r¯r0, is 31.73% (see Equations (5) and (6)); α is the degree of nonlinearity of each industry sector’s response to the reduction in contact activity r¯r0 (see Equation (8)). When the contact activity level reaches 100% (r = r0  13.96), it means returning to the level before the COVID-19 outbreak in Wuhan.
Figure 6
Figure 6
The contour map of total economic losses in Wuhan under various gridded control measures (r and g), where r is the effective number of daily contacts; g is the average waiting time for quarantined patients. Total economic losses ranged from CNY 188.81 to 618.70 billion.

References

    1. Huang C., Wang Y., Li X., Ren L., Zhao J., Hu Y., Zhang L., Fan G., Xu J., Gu X., et al. Clinical Features of Patients Infected with 2019 Novel Coronavirus in Wuhan, China. Lancet. 2020;395:497–506. doi: 10.1016/S0140-6736(20)30183-5. - DOI - PMC - PubMed
    1. Chen N., Zhou M., Dong X., Qu J., Gong F., Han Y., Qiu Y., Wang J., Liu Y., Wei Y., et al. Epidemiological and Clinical Characteristics of 99 Cases of 2019 Novel Coronavirus Pneumonia in Wuhan, China: A Descriptive Study. Lancet. 2020;395:507–513. doi: 10.1016/S0140-6736(20)30211-7. - DOI - PMC - PubMed
    1. Li Q., Guan X., Wu P., Wang X., Zhou L., Tong Y., Ren R., Leung K.S.M., Lau E.H.Y., Wong J.Y., et al. Early Transmission Dynamics in Wuhan, China, of Novel Coronavirus-Infected Pneumonia. N. Engl. J. Med. 2020;382:1199–1207. doi: 10.1056/NEJMoa2001316. - DOI - PMC - PubMed
    1. Wang D., Hu B., Hu C., Zhu F., Liu X., Zhang J., Wang B., Xiang H., Cheng Z., Xiong Y., et al. Clinical Characteristics of 138 Hospitalized Patients With 2019 Novel Coronavirus-Infected Pneumonia in Wuhan, China. JAMA. 2020;323:1061. doi: 10.1001/jama.2020.1585. - DOI - PMC - PubMed
    1. Kucharski A.J., Russell T.W., Diamond C., Liu Y., Edmunds J., Funk S., Eggo R.M., Sun F., Jit M., Munday J.D., et al. Early Dynamics of Transmission and Control of COVID-19: A Mathematical Modelling Study. Lancet Infect. Dis. 2020;20:553–558. doi: 10.1016/S1473-3099(20)30144-4. - DOI - PMC - PubMed

Publication types