The Effect of Deposited Dust on SCC and Crevice Corrosion of AISI 304L Stainless Steel in Saline Environment
- PMID: 34832235
- PMCID: PMC8622586
- DOI: 10.3390/ma14226834
The Effect of Deposited Dust on SCC and Crevice Corrosion of AISI 304L Stainless Steel in Saline Environment
Abstract
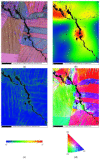
Crevice corrosion has become an important issue of the safety of AISI 304L austenitic stainless steel canister when exposed to the chloride environments located in coastal areas. Moreover, dust deposited on the canister surface may enhance the corrosion effect of 304L stainless steel. In this work, white emery was adopted to simulate the dust accumulated on the as-machined specimen surface. To investigate the effect of deposited white emery, chloride concentration, and relative humidity on the crevice corrosion behavior, an experiment was conducted on 304L stainless steel specimens at 45 °C with 45%, 55%, and 70% relative humidity (RH) for 7000 h. The surface features and crack morphology of the tested 304L stainless steel specimens were examined by SEM equipped with energy-dispersive spectrometry (EDS) and electron back scatter diffraction (EBSD). From the experimental results, a threshold RH for the stress corrosion cracking (SCC) initiation of AISI 304L austenitic stainless steel with different concentrations of chloride was proposed.
Keywords: chloride concentration; crevice corrosion; dust; relative humidity; stainless steel; stress corrosion cracking.
Conflict of interest statement
The authors declare no conflict of interest.
Figures


References
-
- Saegusa T., Yagawa G., Aritomi M. Topics of research and development on concrete cask storage of spent nuclear fuel. Nucl. Eng. Des. 2008;238:1168–1174. doi: 10.1016/j.nucengdes.2007.03.031. - DOI
-
- Aoyama T., Sugawara Y., Muto I., Hara N. In situ monitoring of crevice corrosion morphology of type 316 L stainless steel and repassivation behavior induced by sulfate ions. Corros. Sci. 2017;127:131–140. doi: 10.1016/j.corsci.2017.08.005. - DOI
-
- Li Y.Z., Wang X., Zhang G.A. Corrosion behavior of 13 Cr stainless steel under stress and crevice in 3.5 wt.% NaCl solution. Corros. Sci. 2020;163:108290. doi: 10.1016/j.corsci.2019.108290. - DOI
-
- Han D., Jiang Y., Shi C., Deng B., Li J. Effect of temperature, chloride ion and pH on the crevice corrosion behavior of SAF 2205 duplex stainless steel in chloride solutions. J. Mater. Sci. 2012;47:1018–1025. doi: 10.1007/s10853-011-5889-6. - DOI
-
- Cook C., Padovani C., Davenport A.J. Effect of nitrate and sulfate on atmospheric corrosion of 304 L and 316 L stainless steels. J. Electron. Soc. 2017;164:C146–C163. doi: 10.1149/2.0921704jes. - DOI
LinkOut - more resources
Full Text Sources
Research Materials

