Review
. 2021 Nov 14;14(22):6871.
doi: 10.3390/ma14226871.

Optical Properties of Transparent Rare-Earth Doped Sol-Gel Derived Nano-Glass Ceramics

Affiliations
Review

Optical Properties of Transparent Rare-Earth Doped Sol-Gel Derived Nano-Glass Ceramics

Mihail Secu et al. Materials (Basel). .

Abstract

Rare-earth doped oxyfluoride glass ceramics represent a new generation of tailorable optical materials with high potential for optical-related applications such as optical amplifiers, optical waveguides, and white LEDs. Their key features are related to the high transparency and remarkable luminescence properties, while keeping the thermal and chemical advantages of oxide glasses. Sol-gel chemistry offers a flexible synthesis approach with several advantages, such as lower processing temperature, the ability to control the purity and homogeneity of the final materials on a molecular level, and the large compositional flexibility. The review will be focused on optical properties of sol-gel derived nano-glass ceramics related to the RE-doped luminescent nanocrystals (fluorides, chlorides, oxychlorides, etc.) such as photoluminescence, up-conversion luminescence, thermoluminescence and how these properties are influenced by their specific processing, mostly focusing on the findings from our group and similar ones in the literature, along with a discussion of perspectives, potential challenges, and future development directions.

Keywords: fluorides; glass ceramic; luminescence; nanocrystals; rare-earth; sol-gel.


Conflict of interest statement

The authors declare no conflict of interest.

Figures
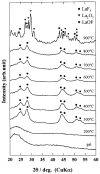
Figure 1
Figure 1
The XRD patterns of SiO2–LaF3 gel and glass ceramics obtained after calcination at different temperatures. (Reproduced from reference [5].)
Figure 2
Figure 2
TEM images of the SiO2–YF3 xerogel sample calcinated at 400 °C (left) showing the congeries (right) (reproduced from reference [12]).
Figure 3
Figure 3
Thermal analysis of Eu-doped SiO2–BaF2 xerogel showing the TG (red) and DSC (black) curves (reproduced from reference [8]).
Figure 4
Figure 4
Photoluminescence spectra recorded on Eu3+-doped xerogel (dotted curve) and glass ceramic (solid curve) using 394 nm excitation wavelength (modified from reference [19]); the inset shows the Eu3+ energy levels diagram.
Figure 5
Figure 5
Photoluminescence spectra of Eu (1%)-doped 95SiO2–5BaF2 nano-glass ceramic (prepared in ref. [8]) recorded under 394 and 464 nm excitation.
Figure 6
Figure 6
The green (2H11/2, 4S3/2 → 4I15/2) and red (4F9/2 → 4I15/2) Er3+ up-conversion luminescences excited at 980 nm in various Yb3+/Er3+-doped oxyfluoride glass ceramics [32] and the energy level schemes of Yb3+ and Er3+ with the main energy transfer processes.
Figure 7
Figure 7
Thermoluminescence mechanism (left) (reproduced from reference [34]); and normalized glow curves recorded after X-ray irradiation at room temperature of Eu3+ doped SiO2–BaF2 dried xerogel and Eu3+ doped glass ceramic (prepared in ref. [8]) (right).
Figure 8
Figure 8
The PSB spectrum associated to the 5F05D2 transition of Eu3+-ion (at 461 nm), recorded in glass–ceramic (solid curve) and the fit with Gaussian-type curves (dashed curves); the abscissa is taken as the energy shift from the pure electronic transition (PET) peak 5F05D2 at 461 nm. (Modified from reference [15].)
Figure 9
Figure 9
Photoluminescence spectra recorded on SrF2:Eu/Tb@SiO2 glass ceramics after under 368 nm excitation wavelength; blue broad emission of SiO2 is accompanied by the green light peaks of Tb3+ and red light peaks of Eu3+ (reproduced from reference [41]).
Figure 10
Figure 10
TL curves recorded on undoped (dotted line) and RE3+-doped glass ceramics (solid lines) after X-ray irradiation at room temperature (reproduced from reference [44]); the energy levels scheme of lanthanides in YPO4 (reproduced from reference [34]).
Figure 11
Figure 11
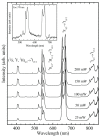
Up-conversion emission spectra of Er3+-doped SiO2–PbF2 glass ceramic under 980 nm IR light pumping at different powers; the inset shows emission spectrum excited at 378 nm (reproduced from reference [47]).
Figure 12
Figure 12
Excitation spectra of Eu3+-doped LaF3–SiO2 glass ceramics recorded at indicated wavelengths; the spectra of 89.9SiO2–10LaF3–0.1EuF3 glassy sample and SiO2:Eu3+ sol–gel glass detected at 590 nm are also included (reproduced from reference [49]).
Figure 13
Figure 13
Up-conversion luminescence spectra of 95SiO2–5LaF3:0.1Er3+ glass ceramics recorded at room temperature under 980 nm IR light pumping with different pumping powers from 10 to 90mW (left) and the energy level schemes of Er3+ with the main energy transfer processes (right); reproduced from reference [52].
Figure 14
Figure 14
Photoluminescence spectra recorded in Eu3+ doped SiO2–GdF3 glass ceramic (left) and Tb3+ doped SiO2–GdF3 glass ceramic excited at Gd3+ or Eu3+/Tb3+ excitation wavelength peaks (reproduced from reference [63]).
Figure 15
Figure 15
X-ray diffraction patterns of the Yb/Er co-doped SiO2–GdF3 xerogel (curve a) and glass ceramics undoped (curve b) and Li (1%) co-doped (c) [65]; the PDF file of orthorhombic GdF3 is shown for comparison.
Figure 16
Figure 16
Normalized emission spectra of the 4F3/2 → 4I11/2 transition obtained under excitation at 786 (black) and 792 nm (red) of the GC-0.95 sample doped with 0.1 mol% of Nd3+ corresponding to Nd3+ ions in LaF3 and NaLaF4 crystalline phases, respectively [68].
Figure 17
Figure 17
Emission spectra of 0.3Ce3+/0.3Tb3+/0.6Eu3+ (mol %) triply-doped SiO2–KYF4 glass ceramics under UV excitation of Ce3+ by comparison to the direct excitation of Eu3+ and Tb3+ ions, showing the Eu3+ and Tb3+ luminescence peaks (reproduced from reference [71]).

References

    1. Deubener J., Allix M., Davis M.J., Duran A., Höche T., Honma T., Komatsu T., Krüger S., Mitra I., Müller R., et al. Updated definition of glass-ceramics. J. Non-Cryst. Solids. 2018;501:3–10. doi: 10.1016/j.jnoncrysol.2018.01.033. - DOI
    1. Pablos-Martin A., Duran A., Pascual M.J. Nanocrystallisation in oxyfluoride systems: Mechanisms of crystallization and photonic properties. Int. Mater. Rev. 2012;57:165–186. doi: 10.1179/1743280411Y.0000000004. - DOI
    1. Brinker C.J., Scherer G. Sol-Gel Science: The Physics and Chemistry of Sol-Gel Processing. 1st ed. Academic Press Inc.; New York, NY, USA: 1990. Levy, D.; Zayat, M. The Sol-Gel Handbook: Synthesis, Characterization and Applications; Wiley-VCH: Weinheim, Germany, 2015.
    1. Gorni G., Velázquez J.J., Mosa J., Balda R., Fernández J., Durán A., Castro Y. Transparent Glass-Ceramics Produced by Sol-Gel: A Suitable Alternative for Photonic Materials. Materials. 2018;11:212. doi: 10.3390/ma11020212. - DOI - PMC - PubMed
    1. Fujihara S., Mochizuki C., Kimura T. Formation of LaF3 microcrystals in sol-gel silica. J. Non-Cryst. Solids. 1999;244:267–274. doi: 10.1016/S0022-3093(99)00009-5. - DOI

LinkOut - more resources