. 2021 Nov 6;10(11):1444.
doi: 10.3390/pathogens10111444.

Characterisation of Macrophage Polarisation in Mice Infected with Ninoa Strain of Trypanosoma cruzi

Affiliations

Characterisation of Macrophage Polarisation in Mice Infected with Ninoa Strain of Trypanosoma cruzi

Dunia M Medina-Buelvas et al. Pathogens. .

Abstract

Macrophages (MΦ) play a key role in the development of the protective immune response against Trypanosoma cruzi infection. To determine the role of MΦ subtypes M1 and M2 in the development of immunity against the Mexican strain of T. cruzi (Ninoa strain), we have analysed in a time course the infection and characterised the M1 and M2 subtypes in two mouse models, BALB/c and C57BL/6. After infection, BALB/c mice developed an increased blood parasite load and the parasites were cleared from the blood one week later than in C57BL/6 mice. However, similar cellular infiltrate and cardiac alterations were observed between BALB/c and C57BL/6 mice. At 36 days, the T. cruzi infection differentially modulated the expression of immune cells, and both the BALB/c and C57BL/6 mice significantly reduced TCD4+ cells. However, BALB/c mice produced significantly more TCD8+ than C57BL/6 mice in the spleen and lymph nodes. Furthermore, BALB/c mice produce significantly more MΦ in the spleen, while C57BL/6 produce similar levels to uninfected mice. The M1 MΦ ratio increased significantly at 3-5 days post-infection (dpi), but then decreased slightly. On the contrary, the M2 MΦ were low at the beginning of the infection, but the proportion of M1 and M2 MΦ at 36 dpi was similar. Importantly, the MΦ subtypes M2c and M2d significantly increased the induction of tissue repair by the end of the acute phase of the infection. These results indicate that the Ninoa strain has developed strategies to modulate the immune response, with fine differences depending on the genetic background of the host.

Keywords: BALB/c mice; C57BL/6 mice; Trypanosoma cruzi; chagas disease; macrophage polarisation; ninoa strain; parasitic burden.


Conflict of interest statement

The authors declare no conflict of interest.

Figures

Figure 1
Figure 1
Time-dependent parasite burden in blood. BALB/c and C57BL/6 female mice were inoculated via intraperitoneal (ip) with 7.5 × 10³ parasites T. cruzi Ninoa strain. Parasite numbers in blood was counted in a Neubauer chamber using light optical microscopy. The results are the mean of three experiments. Mean ± SD, * p < 0.05, n = 8, ANOVA post hoc Bonferroni.
Figure 2
Figure 2
Infiltrated cells in cardiac tissue of BALB/c mice infected with T. cruzi Ninoa strain. Mice infected with 7.5 × 10³ parasites were sacrificed at 36 and 180 days post-infection (dpi), and hearts were recovered. Tissue was fixed in 4% p-formaldehyde and embedded in paraffin. Five μm sections were stained by haematoxylin and eosin (H&E) staining. Non-infected (A); 36 dpi (B); and 180 dpi (C). Microscopy quantification (D). Magnification 40X in an optical light microscope. Arrows indicate infiltrating cells. Mean ± SD, n = 8. * p < 0.05, ANOVA post hoc Bonferroni vs. non-infected.
Figure 3
Figure 3
Collagen deposits in cardiac tissue of BALB/c mice infected with T. cruzi Ninoa strain. Mice infected with 7.5 × 10³ parasites were sacrificed at 36 and 180 days post-infection (dpi), and hearts were recovered. Tissue was fixed in 4% p-formaldehyde and embedded in paraffin. Five μm sections were stained with Masson staining. Non-infected (A); 36 dpi (B); and 180 dpi (C). Microscopy quantification (D). Magnification 40X in an optical light microscope. Arrows indicate collagen deposits. Mean ± SD, n = 8. * p < 0.05, ANOVA post hoc Bonferroni vs. non-infected.
Figure 4
Figure 4
Subpopulations of immune cells post-infection with T. cruzi Ninoa strain. Mice infected with 7.5 × 10³ parasites were sacrificed at 36 dpi, and their spleens and lymph node cells were stained with specific monoclonal antibodies against CD4+ and CD8+ lymphocytes, NK cells (CD335+), and macrophages (F4/80+). Cells were analysed by flow cytometry. Non-infected mice were used as controls of BALB/c (A,B) and C57BL/6 mice (C,D). The bars represent the mean ± SD, n = 5. * p < 0.05, ANOVA post hoc Bonferroni vs. non-infected.
Figure 5
Figure 5
Intracellular cytokines from PECs post-infection with T. cruzi Ninoa strain. Mice infected with 7.5 × 10³ parasites were sacrificed at 36 dpi, and PECs were stained with specific monoclonal antibodies against F4/80 and intracellular cytokines IL-10, TGFβ, TNFα and VEGF. Cells were analysed by flow cytometry. Non-infected mice were used as controls. BALB/c (A) and C57BL/6 mice (B). Mean ± SD, n = 5. * p < 0.05, ANOVA post hoc Bonferroni vs. non-infected.
Figure 6
Figure 6
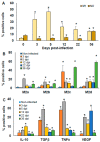
Time-dependent percentage of peritoneal macrophages M1 vs. M2. BALB/c mice infected with 7.5 × 10³ parasites T. cruzi were sacrificed at 0, 3, 5, 12, 22, and 36 dpi. Adherent PECs were marked with specific monoclonal antibodies against F4/80 and intracellular cytokines IL-10, TGFβ, TNFα, and VEGF. MΦ were analysed by flow cytometry and classified as M1 and M2 phenotype (A), or discriminated into M2 MΦ subpopulations M2a, M2b, M2c, and M2d (B). Intracellular cytokine production by MΦ was also evaluated (C). The bars represent the mean ± SD, n = 5. * p < 0.05, ANOVA post hoc Bonferroni vs. non-infected.
Figure 7
Figure 7
Immunophenotyping strategy for PECs. Freshly isolated PECs were stained as indicated in Section 4.8. Immunophenotyped was performed in 1 × 10⁵ events. We selected single cells to analyse monocytes (F4/80). Further discrimination of M1 and M2 cells was determined by extracellular expression of MHC-II and CD206. Intracellular expression of cytokines was used to determine subsets of M2 cells. Data were analysed in an LSR Fortessa flow cytometer (BD Biosciences) and FlowJo v10.07 software.

References

    1. Hotez P.J., Molyneux D.H., Fenwick A., Kumaresan J., Sachs S.E., Sachs J.D., Savioli L. Control of neglected tropical diseases. N. Engl. J. Med. 2007;357:1018–1027. doi: 10.1056/NEJMra064142. - DOI - PubMed
    1. Mena-Marín A.L., Zeledón R., Morales J.A., Pereira M., Urbina A. Sex influence on the susceptibility of Swiss mice to Trypanosoma cruzi [Influencia del sexo en la susceptibilidad de ratones Swiss a Trypanosoma cruzi] Boletín de Malariogía y Salud Ambiental. 2012;LII:233–244.
    1. PAHO/WHO Pan American Health Organization. Chagas Disease. [(accessed on 6 May 2021)]. Available online: https://www.paho.org/en/topics/chagas-disease.
    1. WHO World Health Organization. Chagas Disease (American Trypanosomiasis) [(accessed on 6 May 2021)]. Available online: https://www.who.int/health-topics/chagas-disease#tab=tab_1.
    1. Bern C., Martin D.L., Gilman R.H. Acute and congenital Chagas disease. Adv. Parasitol. 2011;75:19–47. - PubMed

LinkOut - more resources