. 2021 Nov 13;21(22):7559.
doi: 10.3390/s21227559.

Gradient-Descent-like Ghost Imaging

Affiliations

Gradient-Descent-like Ghost Imaging

Wen-Kai Yu et al. Sensors (Basel). .

Abstract

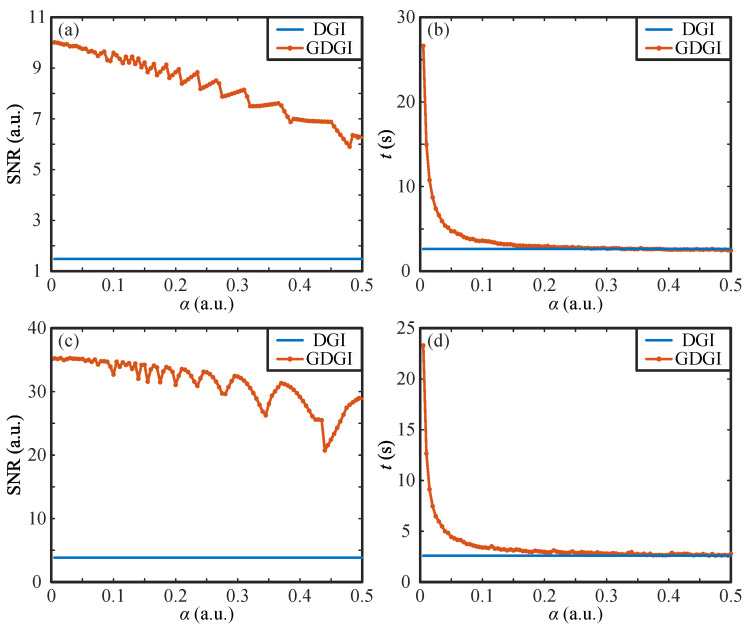
Ghost imaging is an indirect optical imaging technique, which retrieves object information by calculating the intensity correlation between reference and bucket signals. However, in existing correlation functions, a high number of measurements is required to acquire a satisfied performance, and the increase in measurement number only leads to limited improvement in image quality. Here, inspired by the gradient descent idea that is widely used in artificial intelligence, we propose a gradient-descent-like ghost imaging method to recursively move towards the optimal solution of the preset objective function, which can efficiently reconstruct high-quality images. The feasibility of this technique has been demonstrated in both numerical simulation and optical experiments, where the image quality is greatly improved within finite steps. Since the correlation function in the iterative formula is replaceable, this technique offers more possibilities for image reconstruction of ghost imaging.

Keywords: denoising; ghost imaging; gradient-descent; image quality; image reconstruction; iteration.


Conflict of interest statement

The authors declare no conflict of interest.

Figures

Figure 1
Figure 1
Algorithm flow chart. (a) Flow chart of the gradient descent idea. (b) Flow chart of our gradient-descent-like ghost imaging algorithm.
Figure 2
Figure 2
Simulation results of the binary image “01” using different ghost imaging (GI) algorithms with m=20,480 measurements. (a) is the original image “01”, (bg) are the images recovered by the differential GI (DGI), gradient-descent-like background-removal GI (GBGI), gradient-descent-like high-order GI (GHGI), gradient-descent-like DGI (GDGI), gradient-descent-like logarithmic GI (GLGI) and gradient-descent-like trigonometric GI (GTGI), respectively, with their signal-to-noise ratios (SNRs) and running time t marked below the figures.
Figure 3
Figure 3
Simulation results of the grayscale image labelled “02” using different algorithms with m=20,480 measurements. (a) is the original image “02”, (bg) are the images retrieved by the DGI, GBGI, GHGI, GDGI, GLGI and GTGI, respectively.
Figure 4
Figure 4
SNR and t curves as functions of the step size α. (a,b) and (c,d) are the curves for objects “01” and “02” by using the DGI and GDGI, respectively.
Figure 5
Figure 5
Simulation results of another two images “03” and “04” (all of 64×64 pixels) using the DGI, pseudo-inverse GI (PGI) and GDGI algorithms with r=0.5,1,3,5 sampling rates. (a,n) are the original images, (be) and (or), (fi) and (sv), (jm) and (wz) are the images recovered by the DGI, PGI and GDGI, respectively.
Figure 6
Figure 6
Simulation results for the grayscale image labelled “02” using the DGI, PGI and GDGI algorithms under different detection signal-to-noise ratios (DSNRs). (a) gives the changes in the SNRs of the DGI, PGI and GDGI with the DSNRs, (bd), (eg) and (hj) are the images retrieved by the DGI, PGI and GDGI, with the DSNR being 35 dB, 25 dB, 15 dB.
Figure 7
Figure 7
Experimental setup of computational GI. DMD: digital micromirror device, PMT: photomultiplier tube.
Figure 8
Figure 8
Experimental results of a binary object. (a) is the original image encoded onto DMD2, (b,c) are the experimental results recovered by the DGI and GDGI, and (d) gives cross-section plots of the grayscale images in the 32th row.
Figure 9
Figure 9
Comparison results of the binary object “BIT”. (at) are the reconstructed images of the DGI and GDGI using different sampling rates; (u,v) give the change in the number of iterations with the sampling rate, all using the GDGI.
Figure 10
Figure 10
SNR values of the images reconstructed by the DGI and GDGI for the binary object “BIT” with different sampling rates r.
Figure 11
Figure 11
Schematic diagram of encoding a grayscale image onto a DMD. (a) shows the pixel size for reconstruction, (b) gives an example of an pixel-unit “pix”, and (c) is the actual pixel size displayed on the DMD.
Figure 12
Figure 12
Experimental results of a grayscale object. (a,h) are the original object images “car” that are encoded onto DMD2, with grayscale ranges of [0, 50] and [0, 100], respectively; (be) and (il) are the experimental results recovered by the DGI and GDGI, respectively; (fg) and (mn) are the enlarged detailed images of (de) and (kl), respectively.

References

    1. Pittman T.B., Shih Y.H., Strekalov D.V., Sergienko A.V. Optical imaging by means of two-photon quantum entanglement. Phys. Rev. A. 1995;52:R3429. doi: 10.1103/PhysRevA.52.R3429. - DOI - PubMed
    1. Bennink R.S., Bentley S.J., Boyd R.W. “Two-photon” coincidence imaging with a classical source. Phys. Rev. Lett. 2002;89:113601. doi: 10.1103/PhysRevLett.89.113601. - DOI - PubMed
    1. Valencia A., Scarcelli G., D’Angelo M., Shih Y. Two-photon imaging with thermal light. Phys. Rev. Lett. 2005;94:063601. doi: 10.1103/PhysRevLett.94.063601. - DOI - PubMed
    1. Zhang D., Zhai Y.H., Wu L.A., Chen X.H. Correlated two-photon imaging with true thermal light. Opt. Lett. 2005;30:2354–2356. doi: 10.1364/OL.30.002354. - DOI - PubMed
    1. Shapiro J.H. Computational ghost imaging. Phys. Rev. A. 2008;78:061802. doi: 10.1103/PhysRevA.78.061802. - DOI

LinkOut - more resources