. 2021 Nov 9;26(22):6771.
doi: 10.3390/molecules26226771.

1H-NMR Metabolomics as a Tool for Winemaking Monitoring

Affiliations

1H-NMR Metabolomics as a Tool for Winemaking Monitoring

Inès Le Mao et al. Molecules. .

Abstract

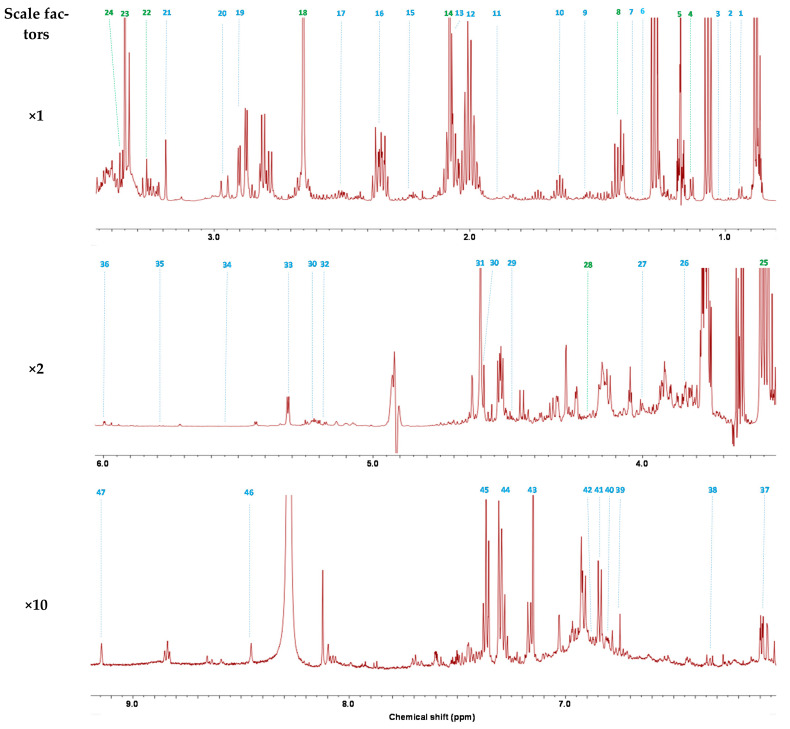
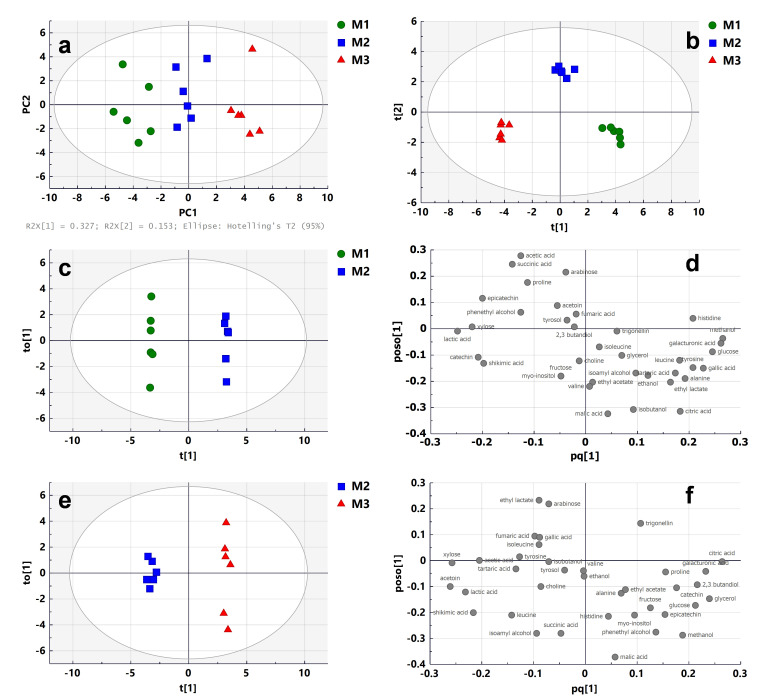
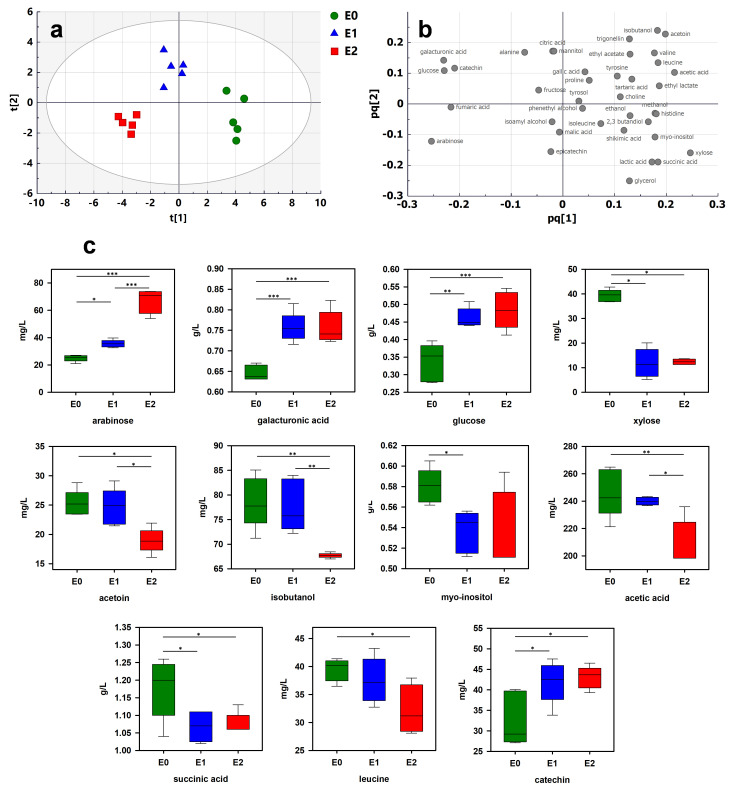
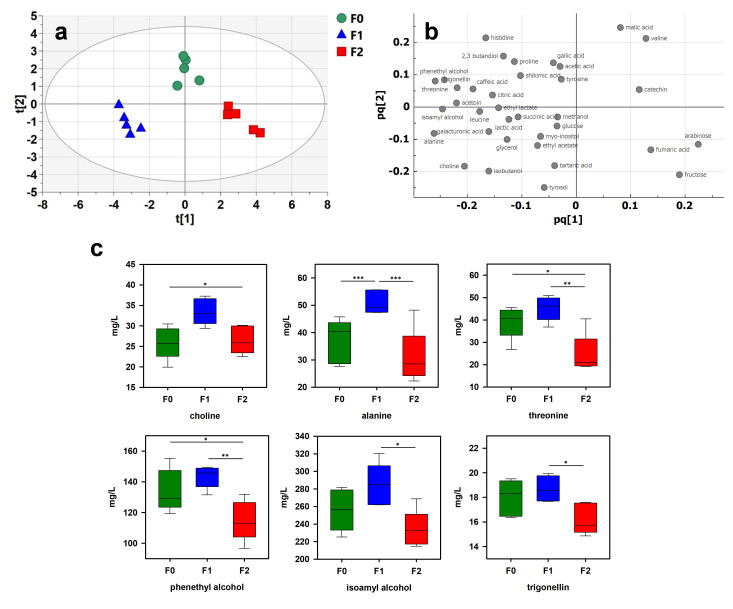
The chemical composition of wine is known to be influenced by multiple factors including some viticulture practices and winemaking processes. 1H-NMR metabolomics has been successfully applied to the study of wine authenticity. In the present study, 1H-NMR metabolomics in combination with multivariate analysis was applied to investigate the effects of grape maturity and enzyme and fining treatments on Cabernet Sauvignon wines. A total of forty wine metabolites were quantified. Three different stages of maturity were studied (under-maturity, maturity and over-maturity). Enzyme treatments were carried out using two pectolytic enzymes (E1 and E2). Finally, two proteinaceous fining treatments were compared (vegetable protein, fining F1; pea protein and PVPP, fining F2). The results show a clear difference between the three stages of maturity, with an impact on different classes of metabolites including amino acids, organic acids, sugars, phenolic compounds, alcohols and esters. A clear separation between enzymes E1 and E2 was observed. Both fining agents had a significant effect on metabolite concentrations. The results demonstrate that 1H-NMR metabolomics provides a fast and robust approach to study the effect of winemaking processes on wine metabolites. These results support the interest to pursue the development of 1H-NMR metabolomics to investigate the effects of winemaking on wine quality.

Keywords: 1H-NMR; metabolomics; wine; winemaking.


Conflict of interest statement

The authors declare no conflict of interest.

Figures

Figure 1
Figure 1
Typical 1H-NMR spectrum of wine after water and ethanol suppression (NOESYGPPS1D sequence). Identified constituents are listed in Table 1 (compounds in green are quantified on the ZGPR sequence).
Figure 2
Figure 2
Multivariate analysis of 1H-NMR spectra of wine samples from grapes harvested at three different stages of maturity (M1: under-maturity; M2: maturity; M3: over-maturity): (a) PCA score plot; (b) OPLS-DA score plot; (c) OPLS-DA score showing separation of M1 and M2 samples; (d) loadings from OPLS-DA between M1 and M2 samples; (e) OPLS-DA score showing separation of M2 and M3 samples; (f) loadings from OPLS-DA between M2 and M3 samples (t[1] and to[1]: first predictive and orthogonal components; t[2]: second predictive component; pq[1] and poso[1]: predictive and orthogonal component loadings).
Figure 3
Figure 3
Multivariate analysis of 1H-NMR spectra of wine samples treated by different enzymes (E0: untreated; E1: enzyme 1; E2: enzyme 2): (a) OPLS-DA score plot; (b) loading plot; (c) boxplots of 11 most discriminant wine constituents (t[1] and t[2]: first and second predictive components; pq[1] and pq[2]: first and second predictive component loadings). The significance in the difference was calculated by ANOVA followed by Tukey’s multiple comparison test (indicated as * p < 0.05, ** p < 0.01, *** p < 0.001).
Figure 4
Figure 4
Multivariate analysis of 1H-NMR spectra of wine samples treated by different finings (F0: untreated; F1: fining 1; F2: fining 2): (a) OPLS-DA score plot; (b) loading plot; (c) boxplots of 6 most discriminant wine constituents (t[1] and t[2]: first and second predictive components; pq[1] and pq[2]: first and second predictive component loadings). The significance in the difference was calculated by ANOVA followed by Tukey’s multiple comparison test (indicated as * p < 0.05, ** p < 0.01, *** p < 0.001).

Similar articles

Cited by

References

    1. Cevallos-Cevallos J.M., Reyes-De-Corcuera J.I., Etxeberria E., Danyluk M.D., Rodrick G.E. Metabolomic analysis in food science: A review. Trends Food Sci. Technol. 2009;20:557–566. doi: 10.1016/j.tifs.2009.07.002. - DOI
    1. Kim S., Kim J., Yun E.J., Kim K.H. Food metabolomics: From farm to human. Curr. Opin. Biotechnol. 2016;37:16–23. doi: 10.1016/j.copbio.2015.09.004. - DOI - PubMed
    1. Valls Fonayet J., Loupit G., Richard T. Chapter Ten—MS- and NMR-metabolomic tools for the discrimination of wines: Applications for authenticity. Adv. Bot. Res. 2021;98:297–357.
    1. Viskić M., Bandić L.M., Korenika A.-M.J., Jeromel A. NMR in the service of wine differentiation. Foods. 2021;10:120. doi: 10.3390/foods10010120. - DOI - PMC - PubMed
    1. Solovyev P.A., Fauhl-Hassek C., Riedl J., Esslinger S., Bontempo L., Camin F. NMR spectroscopy in wine authentication: An official control perspective. Compr. Rev. Food Sci. Food Saf. 2021;20:2040–2062. doi: 10.1111/1541-4337.12700. - DOI - PubMed

LinkOut - more resources