. 2021 Nov 19;26(22):6993.
doi: 10.3390/molecules26226993.

In Vivo Investigation of the Ameliorating Effect of Tempol against MIA-Induced Knee Osteoarthritis in Rats: Involvement of TGF-β1/SMAD3/NOX4 Cue

Affiliations

In Vivo Investigation of the Ameliorating Effect of Tempol against MIA-Induced Knee Osteoarthritis in Rats: Involvement of TGF-β1/SMAD3/NOX4 Cue

Hagar B Abo-Zalam et al. Molecules. .

Abstract

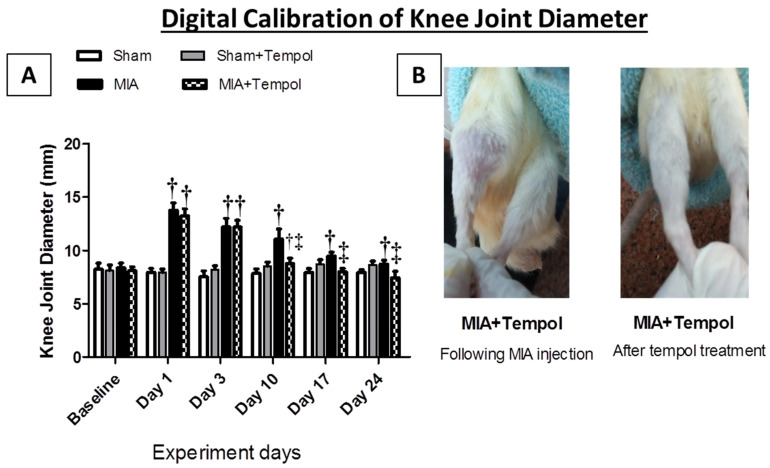
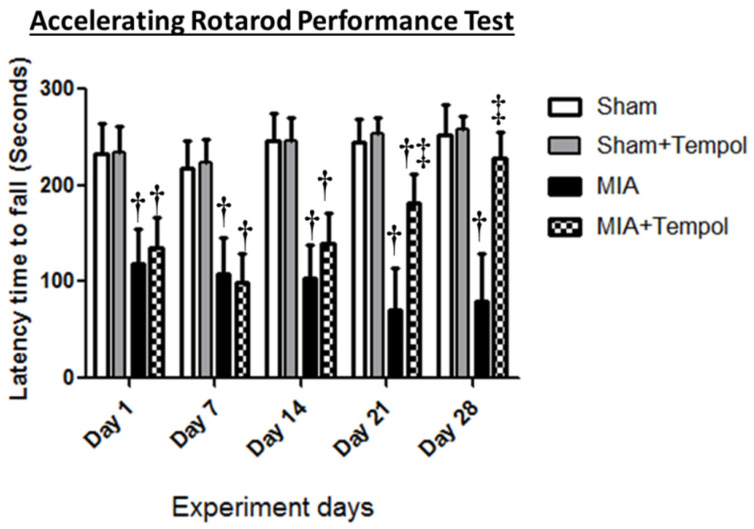
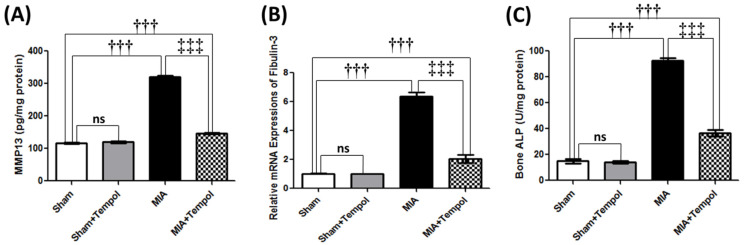
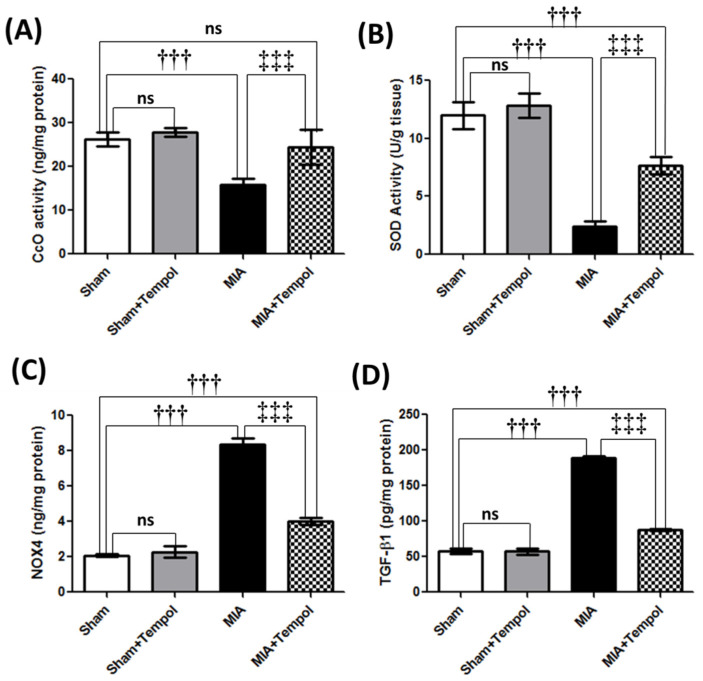
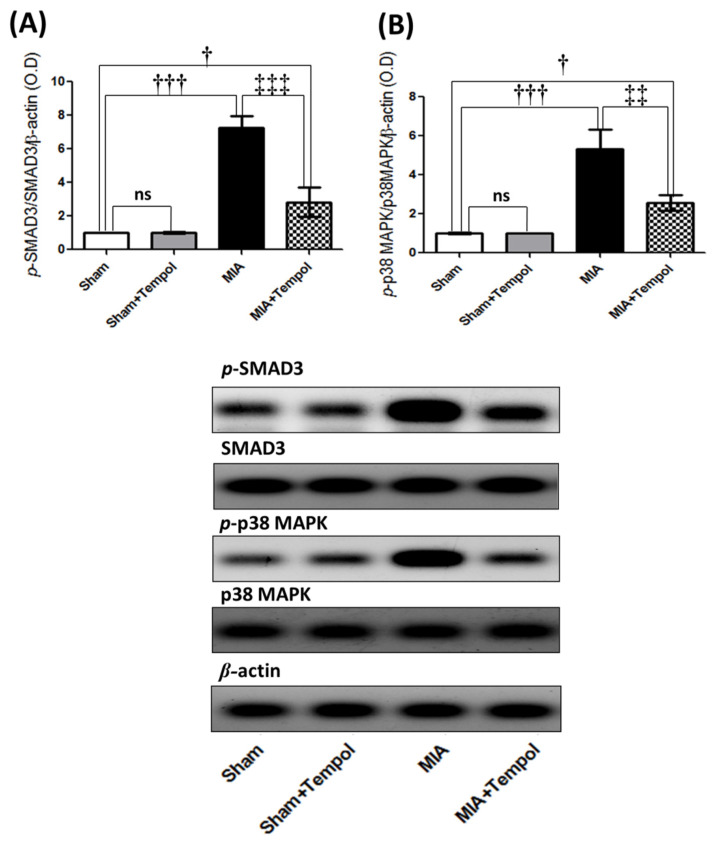
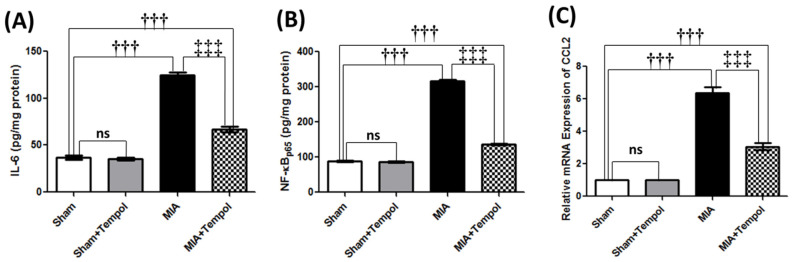
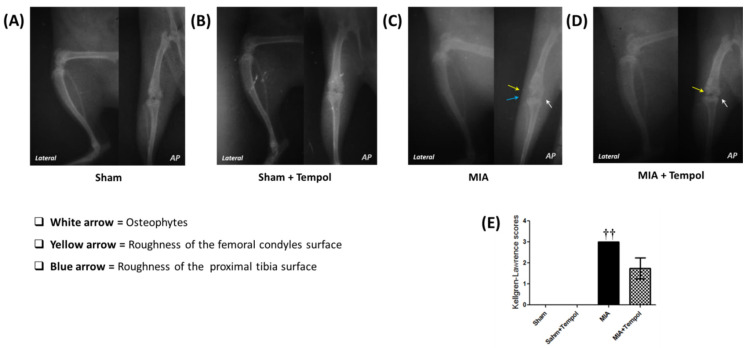
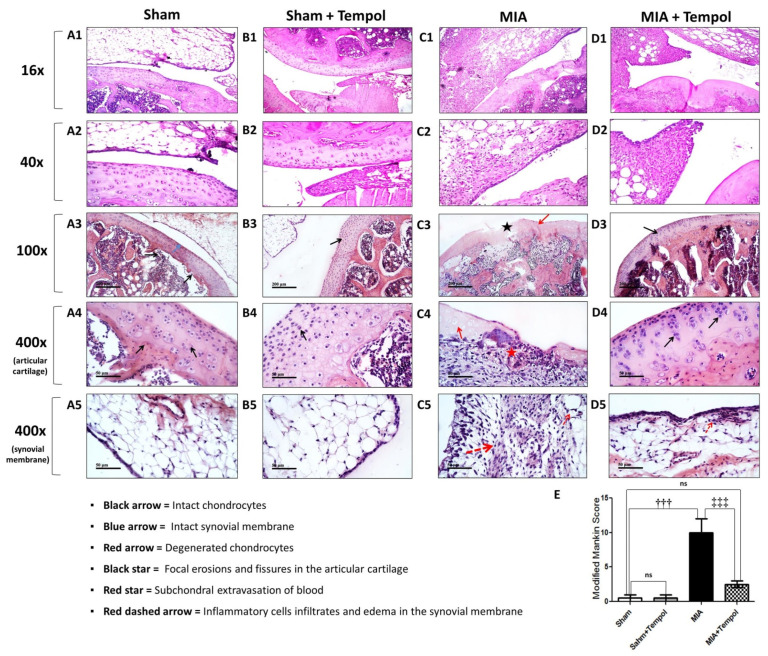
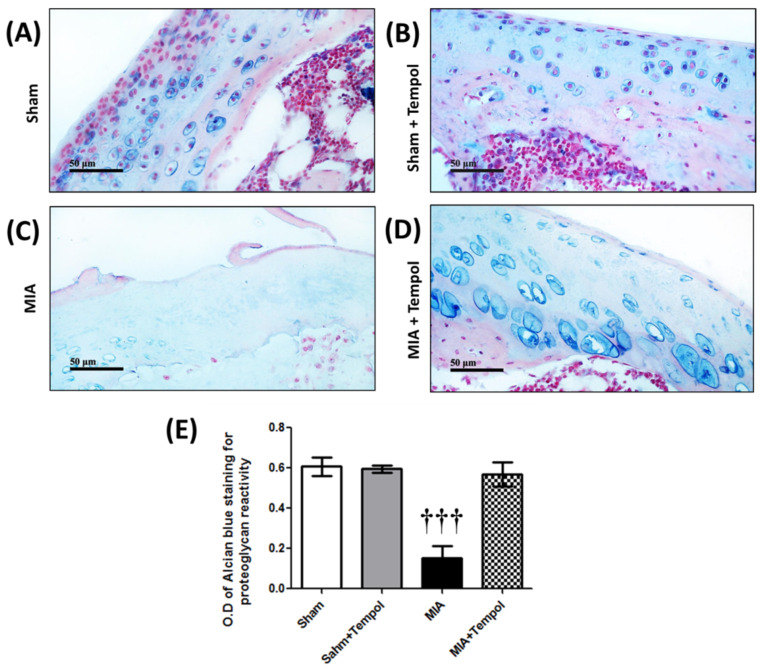
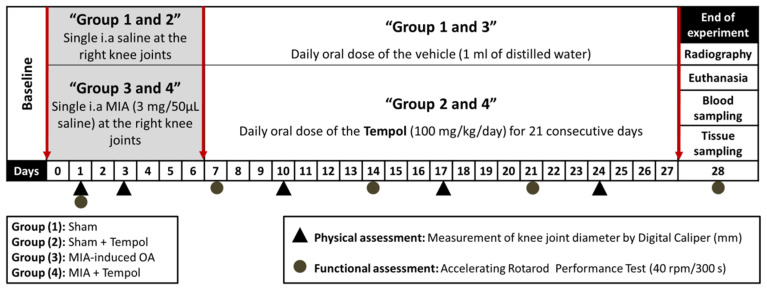
Osteoarthritis (OA) is a complex disease characterized by structural, functional, and metabolic deteriorations of the whole joint and periarticular tissues. In the current study, we aimed to investigate the possible effects of tempol on knee OA induced by the chemical chondrotoxic monosodium iodoacetate (MIA) which closely mimics both the pain and structural changes associated with human OA. Rats were administrated oral tempol (100 mg/kg) one week post-MIA injection (3 mg/50 μL saline) at the right knee joints for 21 consecutive days. Tempol improved motor performance and debilitated the MIA-related radiological and histological alterations. Moreover, it subsided the knee joint swelling. Tempol decreased the cartilage degradation-related biomarkers as matrix metalloproteinase-13, bone alkaline phosphatase (bone ALP), and fibulin-3. The superoxide dismutase mimetic effect of tempol was accompanied by decreased NADPH oxidase 4 (NOX4), inflammatory mediators, nuclear factor-kappa B (NF-κB), over-released transforming growth factor-β1 (TGF-β1). Tempol decreased the expression of chemokine (C-C motif) ligand 2 (CCL2). On the molecular level, tempol reduced the phosphorylated protein levels of p38 mitogen-activated protein kinase (MAPK), and small mother against decapentaplegic 3 homologs (SMAD3). These findings suggest the promising role of tempol in ameliorating MIA-induced knee OA in rats via collateral suppression of the catabolic signaling cascades including TGF-β1/SMAD3/NOX4, and NOX4/p38MAPK/NF-κB and therefore modulation of oxidative stress, catabolic inflammatory cascades, chondrocyte metabolic homeostasis.

Keywords: NOX4; monosodium iodoacetate; osteoarthritis; tempol.


Conflict of interest statement

The authors declare no conflict of interest.

Figures

Figure 1
Figure 1
Effect of Tempol on the digital caliper test. Rats were subjected to a single intra-articular injection of 3 mg MIA/50 μL saline in their right knees, and then tempol was administered starting from the 7th day of the experiment in a dose of (100 mg/kg/day) by oral gavage for 21 consecutive days. (A) Values of knee joint diameter are expressed as mean ± SD (n = 8). Statistical analysis was carried out using repeated measures ANOVA test for factors time and group, followed by the Bonferroni test. p < 0.05 vs. the sham group, and p < 0.05 vs. MIA group. (B) Gross image of MIA + Tempol group just after MIA injection and in the end of the experiment.
Figure 2
Figure 2
Effect of Tempol on the Rotarod test. Rats were subjected to a single intra-articular injection of 3 mg MIA/50 μL saline in their right knees, and then tempol was administered starting from the 7th day of the experiment in a dose of (100 mg/kg/day) by oral gavage for 21 consecutive days. Values of latency time to fall are expressed as mean ± SD (n = 8). Statistical analysis was carried out using repeated measures ANOVA test for factors time and group, followed by the Bonferroni test. p < 0.05 vs. the sham group, and p < 0.05 vs. MIA group.
Figure 3
Figure 3
Effect of Tempol on knee joint degradation-related biomarkers on osteoarthiritic rats. Rats were subjected to a single intra-articular injection of 3 mg MIA/50 μL saline in their right knees, and then tempol was administered starting from the 7th day of the experiment in a dose of (100 mg/kg/day) by oral gavage for 21 consecutive days. Values of (A) Tissue contents of metalloproteinase-13 (MMP-13), (B) The mRNA expression of fibulin-3, and (C) Tissue contents of bone alkaline phosphatase (ALP). Statistical analysis was carried out using one-way ANOVA followed by Tukey’s multiple comparison test. Results are expressed as mean ± SD (n = 6). ††† p < 0.001 vs. the sham group, and ‡‡‡ p < 0.001 vs. MIA group.
Figure 4
Figure 4
Effect of Tempol on Complex IV oxidase and oxidative stress on osteoarthiritic rats. Rats were subjected to a single intra-articular injection of 3 mg MIA/50 μL saline in their right knees, and then tempol was administered starting from the 7th day of the experiment in a dose of (100 mg/kg/day) by oral gavage for 21 consecutive days. Values of (A) Tissue contents of cytochrome c oxidase (CcO) or Complex IV, (B) Tissue contents of superoxide dismutase (SOD), (C) Tissue contents of NADPH oxidase 4 (NOX4), and (D) Tissue contents of transforming growth factor–β1 (TGF-β1). Statistical analysis was carried out using one-way ANOVA followed by Tukey’s multiple comparison test. Results are expressed as mean ± SD (n = 6). ††† p < 0.001 vs. the sham group, and ‡‡‡ p < 0.001 vs. MIA group.
Figure 5
Figure 5
Effect of Tempol intracellular signaling of p-SMAD3 and p-p38MAPK on osteoarthiritic rats. Rats were subjected to a single intra-articular injection of 3 mg MIA/50 μL saline in their right knees, and then tempol was administered starting from the 7th day of the experiment in a dose of (100 mg/kg/day) by oral gavage for 21 consecutive days. Values of (A) The protein expression of the phosphorylated small mother against decapentaplegic 3 homologs (p-SMAD3), and (B) The protein expression of phosphorylated p38 mitogen-activated protein kinase (p-p38MAPK). The cropped blots of p-SMAD3 and p-p38MAPK were presented relative to that of β-actin, and the uncropped images are available in the Supplementary File. Statistical analysis was carried out using one-way ANOVA followed by Tukey’s multiple comparison test. Results are expressed as mean ± SD (n = 3). p < 0.05 and ††† p < 0.001 vs. the sham group, and ‡‡ p < 0.01 and ‡‡‡ p < 0.001 vs. MIA group.
Figure 6
Figure 6
Effect of Tempol on the catabolic inflammatory and pain mediators on osteoarthiritic rats. Rats were subjected to a single intra-articular injection of 3 mg MIA/50 μL saline in their right knees, and then tempol was administered starting from the 7th day of the experiment in a dose of (100 mg/kg/day) by oral gavage for 21 consecutive days. Values of (A) Tissue contents of Interleukin-6 (IL-6), (B) Tissue contents of nuclear factor-kappa B (NF-κBp65), and (C) The mRNA expression of chemotactic cytokine ligand 2 (CCL2), are expressed as mean ± SD (n = 6). Statistical analysis was carried out using one-way ANOVA followed by Tukey’s multiple comparison test. ††† p < 0.001 vs. the sham group, and ‡‡‡ p < 0.001 vs. MIA group.
Figure 7
Figure 7
Effect of Tempol on representative X-ray radiographs. Normal radiographs were revealed in the sham group (A) and Sham+Tempol group (B) along the hip-knee-ankle (HKA) axis. However, the images of the MIA-induced OA group (C) showed increased joint opacity, and osteophyte formation (white arrow) associated with rough surfaces of the femoral condyles and proximal tibia (yellow and blue arrow). On the other hand, the X-ray images of the tempol post-treated group (D) showed almost normal joint space with little lysis of the femoral articular surface (yellow arrow) and few osteophytes (white arrow). Where AP view is the anterior-posterior view (Flexion angle 10°), and lateral view (Flexion angle 30°). Panel (E) represents the means of the Kellgren-Lawrence (K-L) scoring system (Score range: 0–4), where the statistical analysis was carried out using Kruskal-Wallis test followed by Dunn’s post-test. Results are expressed as mean ± SD (n = 4). †† p < 0.01 vs. the sham group.
Figure 8
Figure 8
Effect of Tempol on representative H&E photomicrographs. The micrographs of the sham groups revealed normal histological structure of the chondroblasts in the outer surface and inner surface of the articular cartilage and the outer layer of epithelial cell and the inner collagen layer (A1,A2,B1,B2) with apparent intact isogenous chondrocytes (black arrow) and regular smooth articular surfaces (A3,B3). Intact synovial membranes and normal blood vessels are recorded as a blue arrow in the sections of (A5,B5). The worst distortion is observed in MIA-induced OA sections, where atrophy was detected in the chondroblasts of the outer surface of the articular cartilage and edema, inflammatory cells infiltration with fat in synovial membrane (C1,C2). severe degenerative and necrotic changes with significant loss of many chondrocytes (red arrow) are accompanied by many focal erosions and fissures of articular cartilage superficial zones (black star) in (C3) photomicrograph with occasional subchondral extravasation of blood (red star) in (C4). Significant edema of synovial membranes with many inflammatory cell infiltrates (red dashed arrow) recorded in (C5). Photomicrographs of the tempol post-treated group (D1,D2) showed regeneration in the inner surface of the articular surface with absence of the chondroblasts at the outer surface and thickening in the wall of the synovial membrane. In addition, more intact chondrocytes (black arrows) and regular smooth articular surfaces (D3,D4). Mild inflammatory cell infiltrates (red dashed arrow) were also observed in synovial membranes (D5). Panel (E) represents the means of the modified Mankin scoring system (Score range: 0–13, from normal cartilage to the maximal score of osteoarthritis), where the statistical analysis was carried out using one-way ANOVA followed by Tukey’s multiple comparison test. Results are expressed as mean ± SD (n = 3). ††† p < 0.001 vs. the sham group, and ‡‡‡ p < 0.001 vs. MIA group.
Figure 9
Figure 9
Effect of Tempol on representative alcian blue histochemical photomicrographs. Higher proteoglycans reactivity to alcian blue staining was also observed in (A,B). The MIA group demonstrated severe loss of proteoglycans reactivity to alcian blue staining all over the articular surfaces (C). Post-treatment with tempol (D) retained the higher proteoglycan reactivity. Moreover, the histogram panel (E) represents the analysis of optical density (O. D) of the alcian blue staining among the studied groups. Where the statistical analysis was carried out using one-way ANOVA followed by Tukey’s multiple comparison test. Results are expressed as mean ± SD (n = 3). ††† p < 0.001 vs. the sham group.
Figure 10
Figure 10
Schematic diagram of the experimental protocol.

References

    1. Goldring S.R. Osteoarthritis. J. Cell. Physiol. 2007;213:626–634. doi: 10.1002/jcp.21258. - DOI - PubMed
    1. Holyoak D.T., Tian Y.F., Van Der Meulen M.C.H., Singh A. Osteoarthritis: Pathology, Mouse Models, and Nanoparticle Injectable Systems for Targeted Treatment. Ann. Biomed. Eng. 2016;44:2062–2075. doi: 10.1007/s10439-016-1600-z. - DOI - PMC - PubMed
    1. Xia B., Chen D., Zhang J., Hu S., Jin H., Tong P. Tong, Osteoarthritis Pathogenesis: A Review of Molecular Mechanisms. Calcif. Tissue Int. 2014;95:495–505. doi: 10.1007/s00223-014-9917-9. - DOI - PMC - PubMed
    1. Takahashi I., Matsuzaki T., Hoso M. Long-term histopathological developments in knee-joint components in a rat model of osteoarthritis induced by monosodium iodoacetate. J. Phys. Ther. Sci. 2017;29:590–597. doi: 10.1589/jpts.29.590. - DOI - PMC - PubMed
    1. Lee D.-G., Park S.-Y., Chung W.-S., Park J.-H., Hwang E., Mavlonov G.T., Kim I.-H., Kim K.-Y., Yi T.-H. Fucoidan Prevents the Progression of Osteoarthritis in Rats. J. Med. Food. 2015;18:1032–1041. doi: 10.1089/jmf.2014.3334. - DOI - PubMed

MeSH terms

LinkOut - more resources