. 2021 Oct 22;13(11):1763.
doi: 10.3390/pharmaceutics13111763.

Artepillin C Reduces Allergic Airway Inflammation by Induction of Monocytic Myeloid-Derived Suppressor Cells

Affiliations

Artepillin C Reduces Allergic Airway Inflammation by Induction of Monocytic Myeloid-Derived Suppressor Cells

Núbia Sabrina Martins et al. Pharmaceutics. .

Abstract

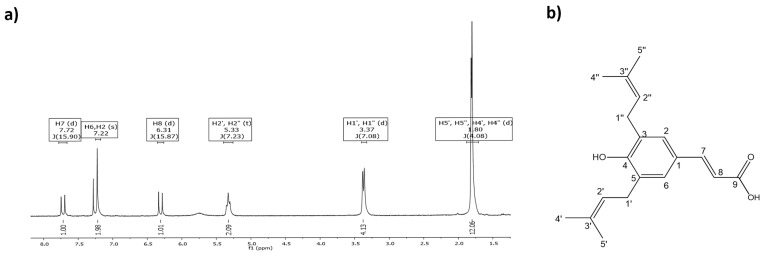
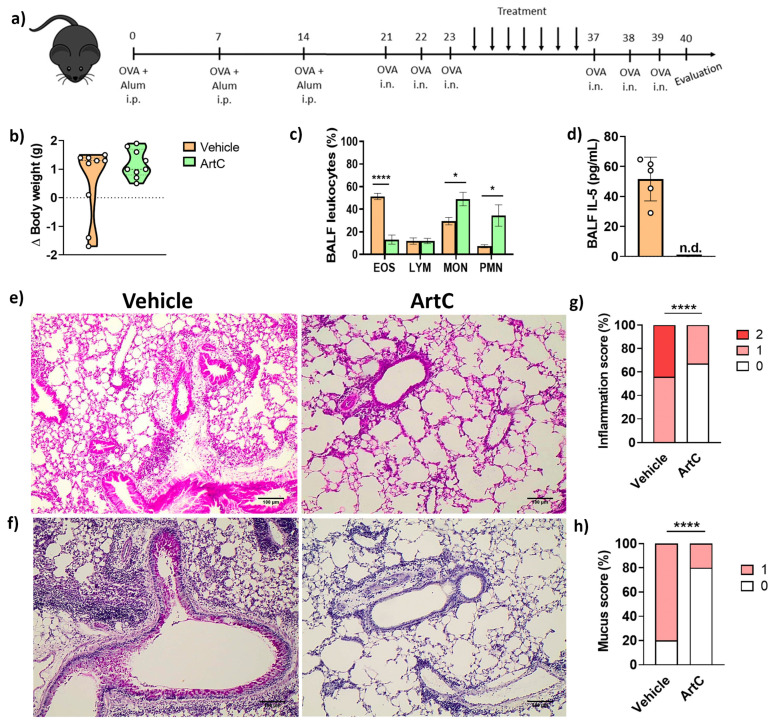
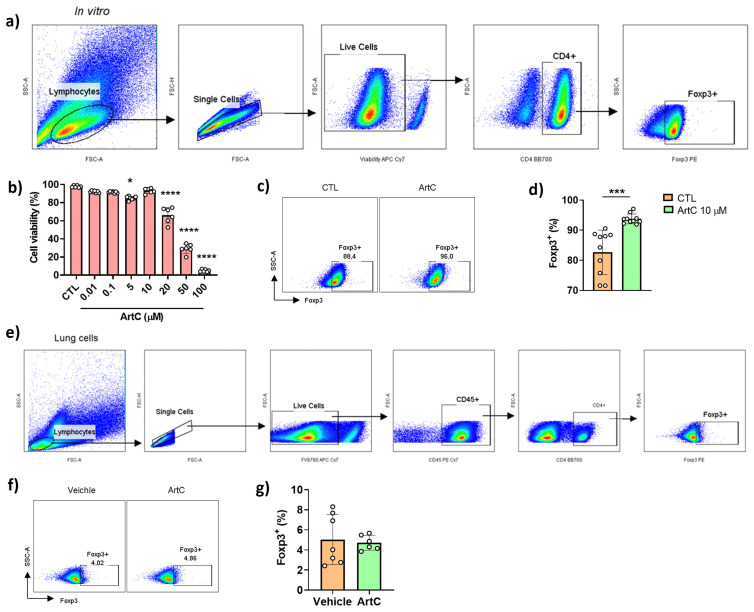
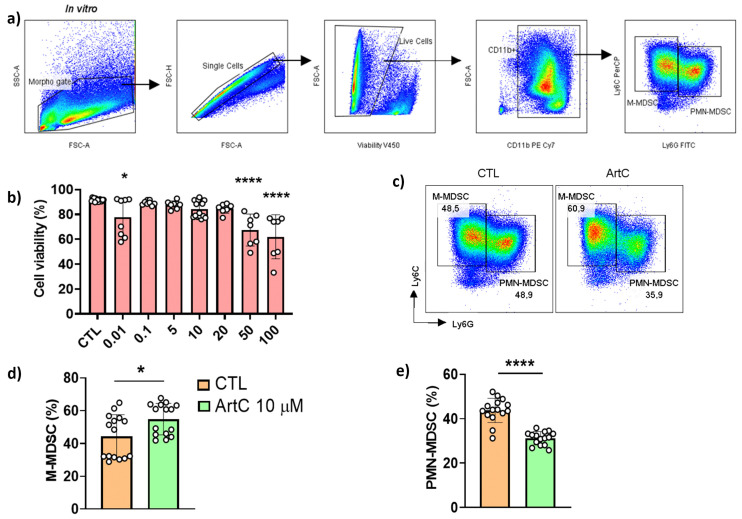
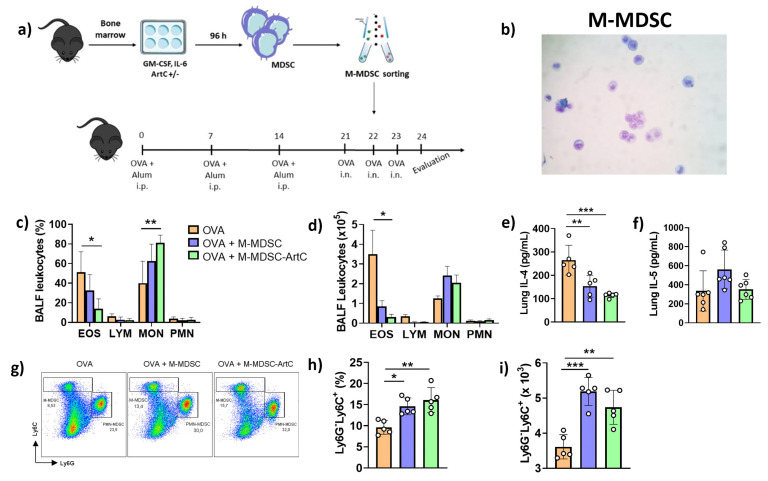
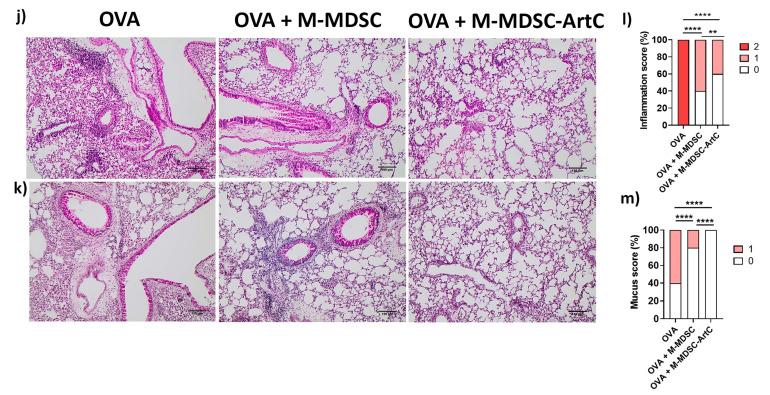
Propolis is a natural product produced by bees that is primarily used in complementary and alternative medicine and has anti-inflammatory, antibacterial, antiviral, and antitumoral biological properties. Some studies have reported the beneficial effects of propolis in models of allergic asthma. In a previous study, our group showed that green propolis treatment reduced airway inflammation and mucus secretion in an ovalbumin (OVA)-induced asthma model and resulted in increased regulatory T cells (Treg) and polymorphonuclear myeloid-derived suppressor cells (PMN-MDSC) frequencies in the lungs, two leukocyte populations that have immunosuppressive functions. In this study, we evaluated the anti-inflammatory effects of artepillin C (ArtC), the major compound of green propolis, in the context of allergic airway inflammation. Our results show that ArtC induces in vitro differentiation of Treg cells and monocytic MDSC (M-MDSC). Furthermore, in an OVA-induced asthma model, ArtC treatment reduced pulmonary inflammation, eosinophil influx to the airways, mucus and IL-5 secretion along with increased frequency of M-MDSC, but not Treg cells, in the lungs. Using an adoptive transfer model, we confirmed that the effect of ArtC in the reduction in airway inflammation was dependent on M-MDSC. Altogether, our data show that ArtC exhibits an anti-inflammatory effect and might be an adjuvant therapy for allergic asthma.

Keywords: M-MDSC; allergic asthma; artepillin C; propolis; therapies.


Conflict of interest statement

The authors declare no conflict of interest.

Figures

Figure 1
Figure 1
ArtC isolation. (a) 1H NMR spectrum of ArtC (CD3OD, 300 MHz); (b) chemical structure of ArtC.
Figure 2
Figure 2
ArtC reduces allergic airway inflammation. (a) Experimental design; (b) body weight variation of mice exposed to the allergen before and after treatment with ArtC; (c) frequency of eosinophils (EOS), lymphocytes (LYM), mononuclear cells (MON) and polymorphonuclear cells (PMN) in the BALF; (d) IL-5 in the BALF (n.d.: not detected); (e) representative images of lung inflammation (magnification 200×, scale bar 100 µM) and (f) mucus production (magnification 200×, scale bar 100 µM); (g) lung inflammation score (0—without inflammation; 1—mild; 2—moderate to severe inflammation); (h) mucus score (0—without mucus secretion; 1—mild). Data are representative of two independent experiments (n = 4–5/group/experiment), except for (d) (one representative experiment), and expressed by mean ± SD. * p < 0.05 and **** p < 0.0001.
Figure 3
Figure 3
ArtC induces Treg cells differentiation in vitro. (a) Gate strategy for Treg cell (CD4+Foxp3+) characterization in vitro by flow cytometry; (b) frequency of live cells (FVS780) in culture of CD4+ T cells stimulated with ArtC versus control (CTL); (c) representative dot plot of Treg cells generated in vitro in the presence or absence of ArtC; (d) percentage of Treg cells generated in vitro. Data are representative of three independent experiments (n = 3–4/group/experiment) and expressed by mean ± SD; (e) gating strategy for Treg cell characterization in vivo; (f) representative dot plot of Treg cell in the lungs of mice exposed to the allergen and treated or not (vehicle) with ArtC; (g) frequency of Treg cells in the lungs. Data are representative of two independent experiments (n = 4–5/group/experiment) and expressed by mean ± SD. * p < 0.05, *** p < 0.001 and **** p < 0.0001.
Figure 4
Figure 4
ArtC induces M-MDSC differentiation in vitro. (a) Gate strategy for M- (Ly6GLy6C+) and PMN-MDSC (Ly6G+Ly6Cint) characterization in vitro; (b) frequency of live cells (FVS780−) in culture of bone marrow cells stimulated with rIL-6, GM-CSF and ArtC versus control (CTL); (c) representative dot plot of M- and PMN-MDSC generated in vitro in the presence of ArtC (10 µM); (d) percentage of M-MDSC, and (e) PMN-MDSC. Data are representative of four independent experiments (n = 3–4/group/experiment) and expressed by mean ± SD. * p < 0.05 and **** p < 0.0001.
Figure 5
Figure 5
ArtC induces M-MDSC in the lungs of mice exposed to the allergen. (a) Gate strategy for Ly6GLy6C+ (M-MDSC) and Ly6G+Ly6Cint (PMN-MDSC) characterization in vivo; (b) representative dot plot of Ly6GLy6C+ and Ly6G+Ly6Cint in the lungs of mice exposed to the allergen treated with or not (Vehicle) with ArtC; (c) frequency, and (d) absolute number of Ly6GLy6C+ in the lungs; (e) frequency, and (f) absolute number of Ly6G+Ly6Cint in the lungs; (g) correlation between BALF eosinophils and lung Ly6GLy6C+. Data are representative of two independent experiments (n = 4–5/group/experiment) and expressed by mean ± SD. * p < 0.05 and *** p < 0.001.
Figure 5
Figure 5
ArtC induces M-MDSC in the lungs of mice exposed to the allergen. (a) Gate strategy for Ly6GLy6C+ (M-MDSC) and Ly6G+Ly6Cint (PMN-MDSC) characterization in vivo; (b) representative dot plot of Ly6GLy6C+ and Ly6G+Ly6Cint in the lungs of mice exposed to the allergen treated with or not (Vehicle) with ArtC; (c) frequency, and (d) absolute number of Ly6GLy6C+ in the lungs; (e) frequency, and (f) absolute number of Ly6G+Ly6Cint in the lungs; (g) correlation between BALF eosinophils and lung Ly6GLy6C+. Data are representative of two independent experiments (n = 4–5/group/experiment) and expressed by mean ± SD. * p < 0.05 and *** p < 0.001.
Figure 6
Figure 6
ArtC-induced M-MDSC reduces the allergic airway inflammation in mice. (a) Experimental design; (b) sorted M-MDSC, before cell transfer; (c) frequency and (d) number of eosinophils (EOS), lymphocytes (LYM), mononuclear cells (MON) and polymorphonuclear cells (PMN) in the BALF post cell transfer; (e) IL-4 and (f) IL-5 levels in the lungs; (g) representative dot plot of M- and PMN-MDSC in the lungs of post cell transfer; (h) percentage and (i) number of M-MDSC in the lungs; (j) representative images of lung inflammation (magnification 200×, scale bar 100 µM) and (k) mucus production (magnification 200×, scale bar 100 µM); (l) Lung inflammation score (0—without inflammation; 1—mild; 2—moderate to severe inflammation); (m) Mucus score (0—without mucus secretion; 1—mild). Data are representative of two independent experiments (n = 5–6/group/experiment), except for (eh) (one representative experiment), and expressed by mean ± SD. * p < 0.05, ** p < 0.01, *** p < 0.001 and **** p < 0.0001.
Figure 6
Figure 6
ArtC-induced M-MDSC reduces the allergic airway inflammation in mice. (a) Experimental design; (b) sorted M-MDSC, before cell transfer; (c) frequency and (d) number of eosinophils (EOS), lymphocytes (LYM), mononuclear cells (MON) and polymorphonuclear cells (PMN) in the BALF post cell transfer; (e) IL-4 and (f) IL-5 levels in the lungs; (g) representative dot plot of M- and PMN-MDSC in the lungs of post cell transfer; (h) percentage and (i) number of M-MDSC in the lungs; (j) representative images of lung inflammation (magnification 200×, scale bar 100 µM) and (k) mucus production (magnification 200×, scale bar 100 µM); (l) Lung inflammation score (0—without inflammation; 1—mild; 2—moderate to severe inflammation); (m) Mucus score (0—without mucus secretion; 1—mild). Data are representative of two independent experiments (n = 5–6/group/experiment), except for (eh) (one representative experiment), and expressed by mean ± SD. * p < 0.05, ** p < 0.01, *** p < 0.001 and **** p < 0.0001.

Similar articles

Cited by

References

    1. Bazo A.P., Rodrigues M.A.M., Sforcin J.M., de Camargo J.L.V., Ribeiro L.R., Salvadori D.M.F. Protective action of propolis on the rat colon carcinogenesis. Teratog. Carcinog. Mutagen. 2002;22:183–194. doi: 10.1002/tcm.10011. - DOI - PubMed
    1. Cornara L., Biagi M., Xiao J., Burlando B. Therapeutic properties of bioactive compounds from different honeybee products. Front. Pharmacol. 2017;8:1–20. doi: 10.3389/fphar.2017.00412. - DOI - PMC - PubMed
    1. Orsi R.O., Sforcin J.M., Funari S.R.C., Bankova V. Effects of Brazilian and Bulgarian propolis on bactericidal activity of macrophages against Salmonella Typhimurium. Int. Immunopharmacol. 2005;5:359–368. doi: 10.1016/j.intimp.2004.10.003. - DOI - PubMed
    1. Sforcin J.M. Propolis and the immune system: A review. J. Ethnopharmacol. 2007;113:1–14. doi: 10.1016/j.jep.2007.05.012. - DOI - PubMed
    1. Machado J.L., Assunção A.K.M., Da Silva M.C.P., Dos Reis A.S., Costa G.C., Arruda D.D.S., Rocha B.A., Vaz M.M., Paes A.M., Guerra R.N.M., et al. Brazilian green propolis: Anti-inflammatory property by an immunomodulatory activity. Evid.-Based Complement. Altern. Med. 2012;2012:157652. doi: 10.1155/2012/157652. - DOI - PMC - PubMed

LinkOut - more resources