. 2021 Nov 16;13(11):1937.
doi: 10.3390/pharmaceutics13111937.

Protective Effect of Natural Antioxidant, Curcumin Nanoparticles, and Zinc Oxide Nanoparticles against Type 2 Diabetes-Promoted Hippocampal Neurotoxicity in Rats

Affiliations

Protective Effect of Natural Antioxidant, Curcumin Nanoparticles, and Zinc Oxide Nanoparticles against Type 2 Diabetes-Promoted Hippocampal Neurotoxicity in Rats

Shaymaa Abdulmalek et al. Pharmaceutics. .

Abstract

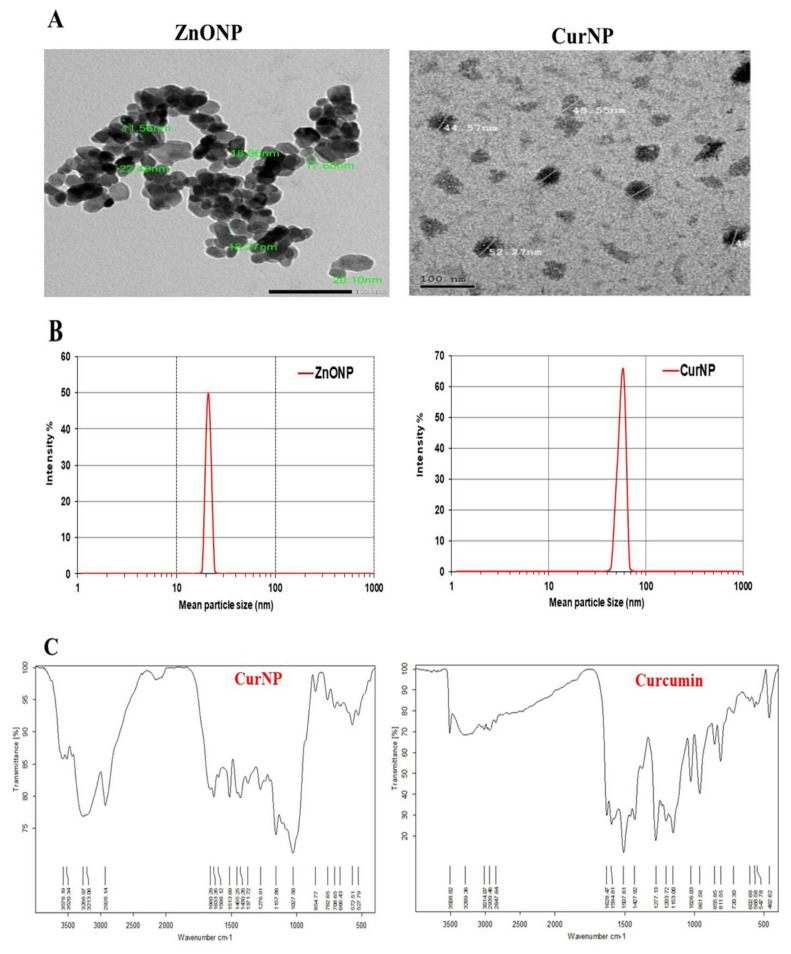
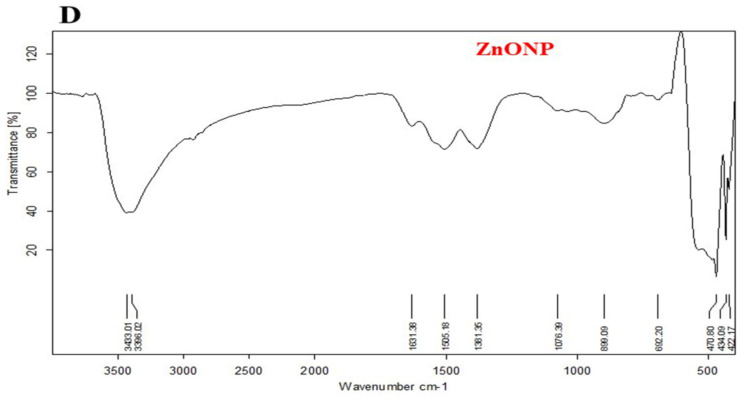
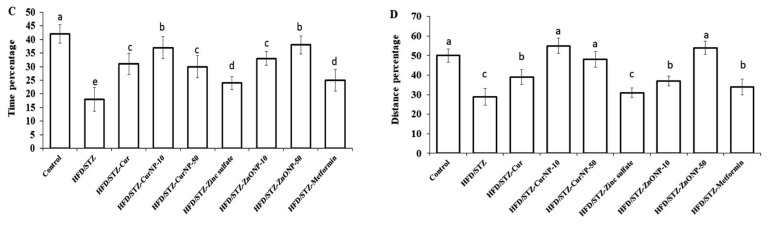
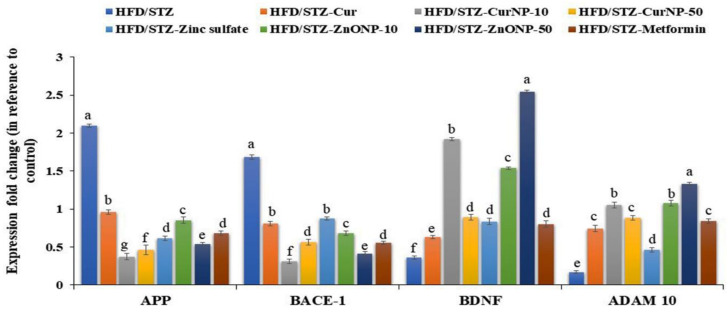
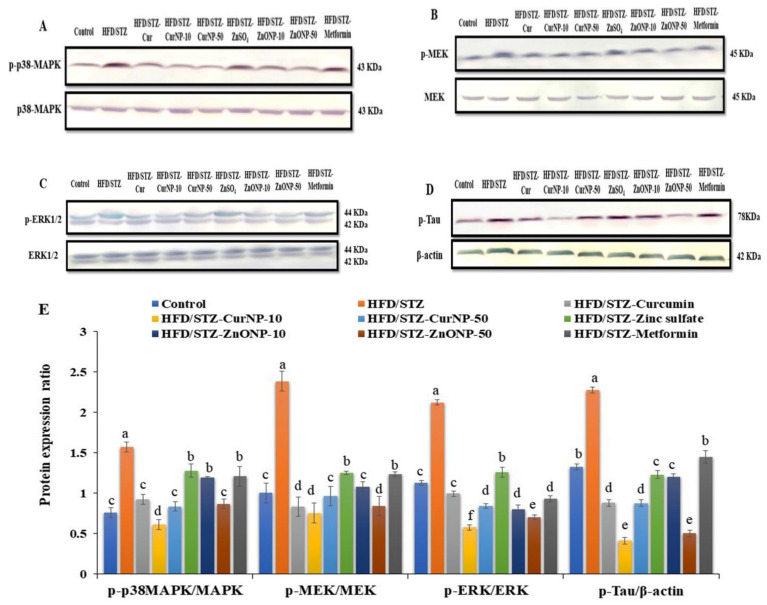
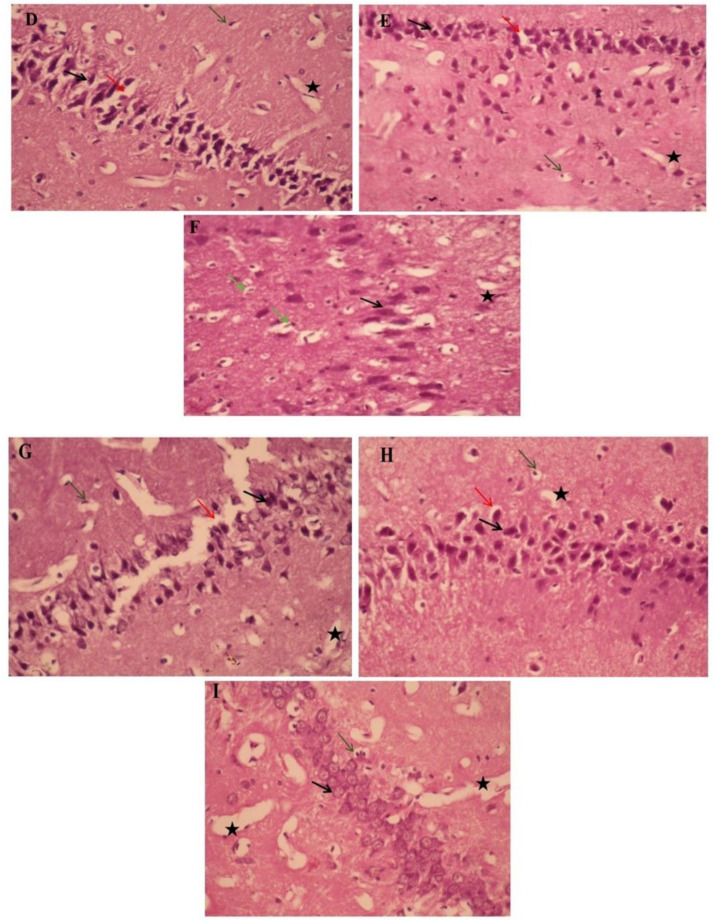
Numerous epidemiological findings have repeatedly established associations between Type 2 Diabetes Mellitus (T2DM) and Alzheimer's disease. Targeting different pathways in the brain with T2DM-therapy offers a novel and appealing strategy to treat diabetes-related neuronal alterations. Therefore, here we investigated the capability of a natural compound, curcumin nanoparticle (CurNP), and a biomedical metal, zinc oxide nanoparticle (ZnONP), to alleviate hippocampal modifications in T2DM-induced rats. The diabetes model was induced in male Wistar rats by feeding a high-fat diet (HFD) for eight weeks followed by intraperitoneal injection of streptozotocin (STZ). Then model groups were treated orally with curcumin, zinc sulfate, two doses of CurNP and ZnONP, as well as metformin, for six weeks. HFD/STZ-induced rats exhibited numerous biochemical and molecular changes besides behavioral impairment. Compared with model rats, CurNP and ZnONP boosted learning and memory function, improved redox and inflammation status, lowered Bax, and upregulated Bcl2 expressions in the hippocampus. In addition, the phosphorylation level of the MAPK/ERK pathway was downregulated significantly. The expression of amyloidogenic-related genes and amyloid-beta accumulation, along with tau hyperphosphorylation, were lessened considerably. In addition, both nanoparticles significantly improved histological lesions in the hippocampus. Based on our findings, CurNP and ZnONP appear to be potential neuroprotective agents to mitigate diabetic complications-associated hippocampal toxicity.

Keywords: apoptosis; curcumin nanoparticle; diabetes mellitus; inflammation; metformin; neurotoxicity; oxidative stress; zinc oxide nanoparticle.


Conflict of interest statement

The authors declare no conflict of interest.

Figures

Figure 1
Figure 1
Characterization of ZnONP and CurNP. (A) TEM analysis of nanoparticles. (B) The particle size of nanoparticles. (C) FTIR analysis of curcumin and CurNP. (D) FTIR analysis of ZnONP.
Figure 1
Figure 1
Characterization of ZnONP and CurNP. (A) TEM analysis of nanoparticles. (B) The particle size of nanoparticles. (C) FTIR analysis of curcumin and CurNP. (D) FTIR analysis of ZnONP.
Figure 2
Figure 2
Effects of ZnONP and CurNP on memory impairment in rats. The Morris water maze (MWM) was used to test rats’ memories by measuring (A) escape latency and (B) escape distances. A probe test was used to analyze the maintenance of memory in the MWM by measuring the percentage of (C) time spent and (D) distance swum in the target quadrant. Three independent experiments were performed. Data are expressed as mean ± SEM (n = 8); means with different letters (a–e) in each bar are significantly different (p < 0.01), in Figure 2C the largest data value take the letter (a) and the smallest data value take the letter (e) and in Figure 2D the largest data value take the letter (a) and the smallest data value take the letter (c).
Figure 2
Figure 2
Effects of ZnONP and CurNP on memory impairment in rats. The Morris water maze (MWM) was used to test rats’ memories by measuring (A) escape latency and (B) escape distances. A probe test was used to analyze the maintenance of memory in the MWM by measuring the percentage of (C) time spent and (D) distance swum in the target quadrant. Three independent experiments were performed. Data are expressed as mean ± SEM (n = 8); means with different letters (a–e) in each bar are significantly different (p < 0.01), in Figure 2C the largest data value take the letter (a) and the smallest data value take the letter (e) and in Figure 2D the largest data value take the letter (a) and the smallest data value take the letter (c).
Figure 3
Figure 3
Gene expression profile of APP, BACE-1, BDNF, and ADAM-10 in the hippocampus of rats. Data are expressed as mean ± SEM (n = 3); means for the same parameter with different letters (a–g) in each bar are significantly different (p < 0.01), the largest data value takes the letter (a) and the smallest data value takes the letter (g).
Figure 4
Figure 4
Gene expression profile of Bcl-2 and Bax in (A) hippocampus and (B) cortex of rats. Data are expressed as mean ± SEM (n = 3); means for the same parameter with different letters (a–g) in each bar are significantly different (p < 0.01), the largest data value takes the letter (a) and the smallest data value takes the letter (g).
Figure 5
Figure 5
Protein expression ratio profile. (A) p-p38MAPK/p38MAPK, (B) p-ERK/ERK, (C) p-MEK/MEK, (D) p-Tau/β-actin in the hippocampus of rats. (E) Quantitative analysis of p-p38MAPK/p38MAPK, p-ERK/ERK, p-MEK/MEK, and p-Tau/β-actin in the hippocampus of rats. Data are expressed as mean ± SEM (n = 3); means for the same parameter with different letters (a–f) in each bar are significantly different (p < 0.01), the largest data value takes the letter (a) and the smallest data value takes the letter (f).
Figure 6
Figure 6
The effects of ZnONP and CurNP on the histology of hippocampi in rat groups. Hippocampi of rats were evaluated via hematoxylin-eosin (H&E) staining at 400 X magnification. (A) The control group: a photomicrograph of the hippocampus showing arranged pyramidal cells (black arrows) with minimum vacuolated cytoplasm (Red arrows), a few pyknotic neuropil cells (Green arrows), and homogenous brain tissue (black asterisk). (B) Untreated HFD/STZ-induced group: a photomicrograph of the hippocampus showing marked proliferating pyramidal cells with dark nuclei (black arrows) with minimum vacuolated cytoplasm (red arrows) and many pyknotic neuropile cells (green arrows), and reduction of the myelinated sheath (black asterisk). (C) HFD/STZ-induced rats treated with curcumin: a photomicrograph of the hippocampus showing some pyramidal cells with hyperchromatic nuclei (black arrows) and marked vacuolated cytoplasm (red arrows) and many neuropile cells (green arrows), with mildly dilated and hemorrhaged blood capillaries (black asterisk). (D) HFD/STZ-induced rats treated with CurNP-10: a photomicrograph of the hippocampus showing normal features of many neuropil cells and few pyknotic ones (green arrows), mildly proliferating pyramidal cells with hyperchromatic nuclei (black arrows) and mildly vacuolated cytoplasm (red arrows) with homogenous brain tissue (black asterisk). (E) HFD/STZ-induced rats treated with CurNP-50: a photomicrograph of the hippocampus showing pyramidal cells having dark pyramidal nuclei (black arrows) and mildly vacuolated cytoplasm (red arrows) with few necrotic ones (green arrows) and homogenous brain tissue (black asterisk). (F) HFD/STZ-induced rats treated with zinc sulfate: a photomicrograph of the hippocampus showing some pyramidal cells with hyperchromatic nuclei and homogenous cytoplasm (black arrows), many neuroglial cells (green arrows), with mildly degenerative myelinated sheaths (black asterisk). (G) HFD/STZ-induced rats treated with ZnONP-10: a photomicrograph of the hippocampus showing pyramidal cells, dark pyramidal nuclei (black arrows) and low vacuolated cytoplasm (normal architecture) (red arrows), prominent nucleolus (green arrows), and markedly hemorrhaged dilated blood vessels and edema (black asterisk). (H) HFD/STZ-induced rats treated with ZnONP-50: a photomicrograph of the hippocampus showing hyperchromatic nuclei (black arrows) with mild vacuolated cytoplasm (red arrows), and pyknotic pyramidal (green arrows), with the area of homogenous brain tissue (black asterisk). (I) HFD/STZ-induced rats treated with metformin: a photomicrograph of the hippocampus showing many prominent nucleoli (green arrows), pyknotic pyramidal cells (black arrows), and reduction of myelinated sheaths in the necrotic area (black asterisk).
Figure 6
Figure 6
The effects of ZnONP and CurNP on the histology of hippocampi in rat groups. Hippocampi of rats were evaluated via hematoxylin-eosin (H&E) staining at 400 X magnification. (A) The control group: a photomicrograph of the hippocampus showing arranged pyramidal cells (black arrows) with minimum vacuolated cytoplasm (Red arrows), a few pyknotic neuropil cells (Green arrows), and homogenous brain tissue (black asterisk). (B) Untreated HFD/STZ-induced group: a photomicrograph of the hippocampus showing marked proliferating pyramidal cells with dark nuclei (black arrows) with minimum vacuolated cytoplasm (red arrows) and many pyknotic neuropile cells (green arrows), and reduction of the myelinated sheath (black asterisk). (C) HFD/STZ-induced rats treated with curcumin: a photomicrograph of the hippocampus showing some pyramidal cells with hyperchromatic nuclei (black arrows) and marked vacuolated cytoplasm (red arrows) and many neuropile cells (green arrows), with mildly dilated and hemorrhaged blood capillaries (black asterisk). (D) HFD/STZ-induced rats treated with CurNP-10: a photomicrograph of the hippocampus showing normal features of many neuropil cells and few pyknotic ones (green arrows), mildly proliferating pyramidal cells with hyperchromatic nuclei (black arrows) and mildly vacuolated cytoplasm (red arrows) with homogenous brain tissue (black asterisk). (E) HFD/STZ-induced rats treated with CurNP-50: a photomicrograph of the hippocampus showing pyramidal cells having dark pyramidal nuclei (black arrows) and mildly vacuolated cytoplasm (red arrows) with few necrotic ones (green arrows) and homogenous brain tissue (black asterisk). (F) HFD/STZ-induced rats treated with zinc sulfate: a photomicrograph of the hippocampus showing some pyramidal cells with hyperchromatic nuclei and homogenous cytoplasm (black arrows), many neuroglial cells (green arrows), with mildly degenerative myelinated sheaths (black asterisk). (G) HFD/STZ-induced rats treated with ZnONP-10: a photomicrograph of the hippocampus showing pyramidal cells, dark pyramidal nuclei (black arrows) and low vacuolated cytoplasm (normal architecture) (red arrows), prominent nucleolus (green arrows), and markedly hemorrhaged dilated blood vessels and edema (black asterisk). (H) HFD/STZ-induced rats treated with ZnONP-50: a photomicrograph of the hippocampus showing hyperchromatic nuclei (black arrows) with mild vacuolated cytoplasm (red arrows), and pyknotic pyramidal (green arrows), with the area of homogenous brain tissue (black asterisk). (I) HFD/STZ-induced rats treated with metformin: a photomicrograph of the hippocampus showing many prominent nucleoli (green arrows), pyknotic pyramidal cells (black arrows), and reduction of myelinated sheaths in the necrotic area (black asterisk).

References

    1. Verbeek M.M., Eikelenboom P., de Waal R.M. Differences between the pathogenesis of senile plaques and congophilic angiopathy in Alzheimer disease. J. Neuropathol. Exp. Neurol. 1997;56:751–761. doi: 10.1097/00005072-199756070-00001. - DOI - PubMed
    1. Rao C.V., Asch A.S., Carr D.J., Yamada H.Y. Amyloid-beta accumulation cycle as a prevention and/or therapy target for Alzheimer’s disease. Aging Cell. 2020;19:e13109. doi: 10.1111/acel.13109. - DOI - PMC - PubMed
    1. Marcus J.N., Schachter J. Targeting post-translational modifications on tau as a therapeutic strategy for Alzheimer’s disease. J. Neurogenet. 2011;25:127–133. doi: 10.3109/01677063.2011.626471. - DOI - PubMed
    1. Rönnemaa E., Zethelius B., Sundelöf J., Sundström J., Degerman-Gunnarsson M., Berne C., Lannfelt L., Kilander L. Impaired insulin secretion increases the risk of Alzheimer disease. Neurology. 2008;71:1065–1071. doi: 10.1212/01.wnl.0000310646.32212.3a. - DOI - PubMed
    1. Carvalheira J.B., Ribeiro E.B., Araújo E.P., Guimarães R.B., Telles M.M., Torsoni M., Gontijo J.A.R., Velloso L.A., Saad M.J.A. Selective impairment of insulin signalling in the hypothalamus of obese Zucker rats. Diabetologia. 2003;46:1629–1640. doi: 10.1007/s00125-003-1246-x. - DOI - PubMed