

Light Deficiency Inhibits Growth by Affecting Photosynthesis Efficiency as well as JA and Ethylene Signaling in Endangered Plant Magnolia sinostellata
- PMID: 34834626
- PMCID: PMC8618083
- DOI: 10.3390/plants10112261
Light Deficiency Inhibits Growth by Affecting Photosynthesis Efficiency as well as JA and Ethylene Signaling in Endangered Plant Magnolia sinostellata
Abstract
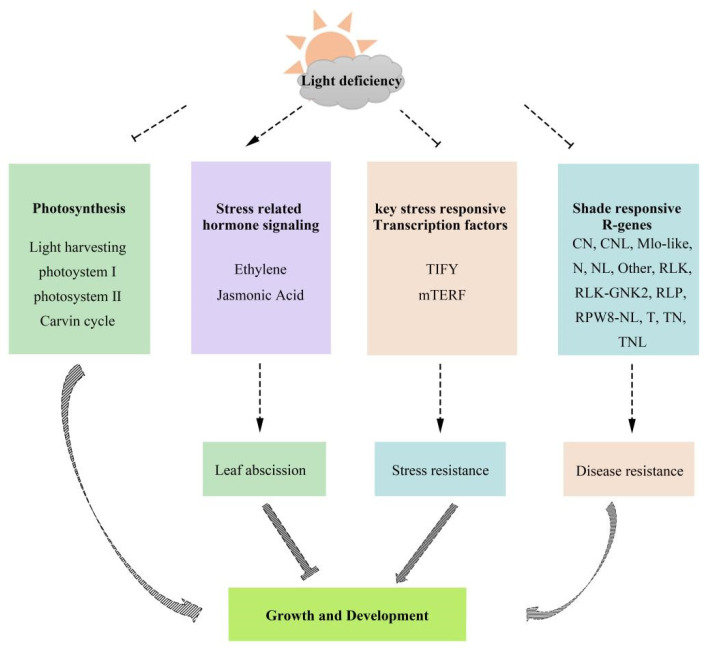
The endangered plant Magnolia sinostellata largely grows in the understory of forest and suffers light deficiency stress. It is generally recognized that the interaction between plant development and growth environment is intricate; however, the underlying molecular regulatory pathways by which light deficiency induced growth inhibition remain obscure. To understand the physiological and molecular mechanisms of plant response to shading caused light deficiency, we performed photosynthesis efficiency analysis and comparative transcriptome analysis in M. sinostellata leaves, which were subjected to shading treatments of different durations. Most of the parameters relevant to the photosynthesis systems were altered as the result of light deficiency treatment, which was also confirmed by the transcriptome analysis. Gene Ontology and KEGG pathway enrichment analyses illustrated that most of differential expression genes (DEGs) were enriched in photosynthesis-related pathways. Light deficiency may have accelerated leaf abscission by impacting the photosynthesis efficiency and hormone signaling. Further, shading could repress the expression of stress responsive transcription factors and R-genes, which confer disease resistance. This study provides valuable insight into light deficiency-induced molecular regulatory pathways in M. sinostellata and offers a theoretical basis for conservation and cultivation improvements of Magnolia and other endangered woody plants.
Keywords: Magnolia sinostellata; RNA-seq; endangered species; gene regulation; light deficiency.
Conflict of interest statement
The authors declare no conflict of interest. The funders had no role in the design of the study; in the collection, analyses, or interpretation of data; in the writing of the manuscript, or in the decision to publish the results.
Figures


Similar articles
-
Identification of potential light deficiency response regulators in endangered species Magnolia sinostellata.Sci Rep. 2022 Dec 29;12(1):22536. doi: 10.1038/s41598-022-25393-x. Sci Rep. 2022. PMID: 36581613 Free PMC article.
-
STAY-GREEN Accelerates Chlorophyll Degradation in Magnolia sinostellata under the Condition of Light Deficiency.Int J Mol Sci. 2023 May 9;24(10):8510. doi: 10.3390/ijms24108510. Int J Mol Sci. 2023. PMID: 37239857 Free PMC article.
-
Physiological, Cytological and Transcriptome Analysis of a Yellow-Green Leaf Mutant in Magnolia sinostellata.Plants (Basel). 2025 Mar 27;14(7):1037. doi: 10.3390/plants14071037. Plants (Basel). 2025. PMID: 40219105 Free PMC article.
-
Development of EST-SSR markers and their application in an analysis of the genetic diversity of the endangered species Magnolia sinostellata.Mol Genet Genomics. 2019 Feb;294(1):135-147. doi: 10.1007/s00438-018-1493-7. Epub 2018 Sep 25. Mol Genet Genomics. 2019. PMID: 30255205
-
Review: the effect of light on the key pigment compounds of photosensitive etiolated tea plant.Bot Stud. 2021 Dec 11;62(1):21. doi: 10.1186/s40529-021-00329-2. Bot Stud. 2021. PMID: 34897570 Free PMC article. Review.
Cited by
-
Transcriptome and targeted hormone metabolome reveal the molecular mechanisms of flower abscission in camellia.Front Plant Sci. 2022 Dec 22;13:1076037. doi: 10.3389/fpls.2022.1076037. eCollection 2022. Front Plant Sci. 2022. PMID: 36618654 Free PMC article.
-
Identification of potential light deficiency response regulators in endangered species Magnolia sinostellata.Sci Rep. 2022 Dec 29;12(1):22536. doi: 10.1038/s41598-022-25393-x. Sci Rep. 2022. PMID: 36581613 Free PMC article.
-
STAY-GREEN Accelerates Chlorophyll Degradation in Magnolia sinostellata under the Condition of Light Deficiency.Int J Mol Sci. 2023 May 9;24(10):8510. doi: 10.3390/ijms24108510. Int J Mol Sci. 2023. PMID: 37239857 Free PMC article.
-
Physiological and Structural Changes in Leaves of Platycrater arguta Seedlings Exposed to Increasing Light Intensities.Plants (Basel). 2024 Apr 30;13(9):1263. doi: 10.3390/plants13091263. Plants (Basel). 2024. PMID: 38732478 Free PMC article.
-
The Effects of Growth Modification on Pollen Development in Spring Barley (Hordeum vulgare L.) Genotypes with Contrasting Drought Tolerance.Cells. 2023 Jun 18;12(12):1656. doi: 10.3390/cells12121656. Cells. 2023. PMID: 37371126 Free PMC article.
References
-
- Baranova M. Systematic Anatomy of the Leaf Epidermis in the Magnoliaceae and Some Related Families. Int. Assoc. Plant Taxon. IAPT. 1972;21:447–469.
-
- Suzuki S., Kiyoshi I., Saneyoshi U., Yoshihiko T., Nobuhiro T. Population differentiation and gene flow within ametapopulation of a threatened tree, Magnolia stellata (magnoliaceae) Am. J. Bot. 2007;94:128–136. - PubMed
-
- Jiang G., Sun G., Zhang G., Wang J. Intraspecific and interspecific competition of the endangered plant Magnolia zenii. J. Ecol. 2010;29:201–206.
-
- Yang Y., Jia Z., Chen F., Sang Z., Ma L. Optimum light environment of rare tree species Magnolia wufengensis in North China. Acta Plant Sci. 2015;33:377–387.
