. 2021 Nov 1;10(11):2357.
doi: 10.3390/plants10112357.

Transient Waterlogging Events Impair Shoot and Root Physiology and Reduce Grain Yield of Durum Wheat Cultivars

Affiliations

Transient Waterlogging Events Impair Shoot and Root Physiology and Reduce Grain Yield of Durum Wheat Cultivars

Lorenzo Cotrozzi et al. Plants (Basel). .

Abstract

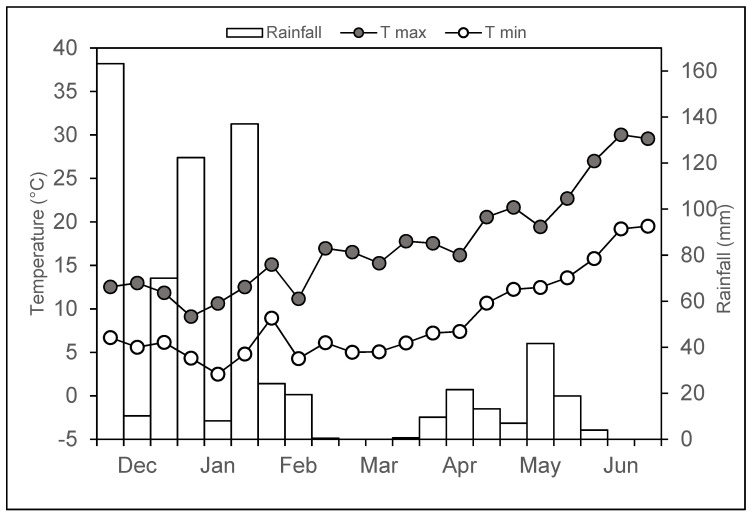
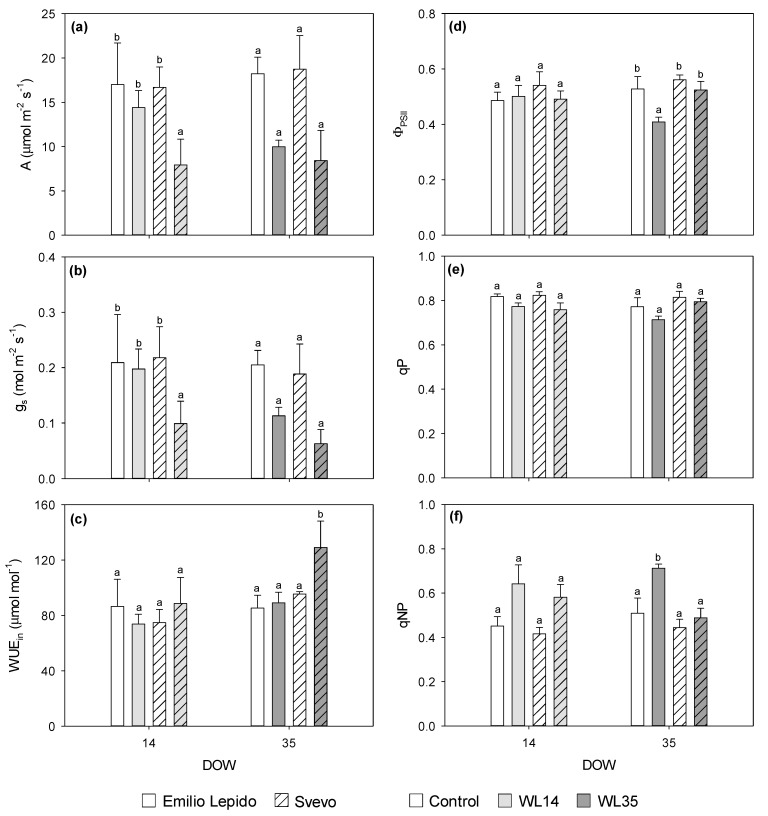
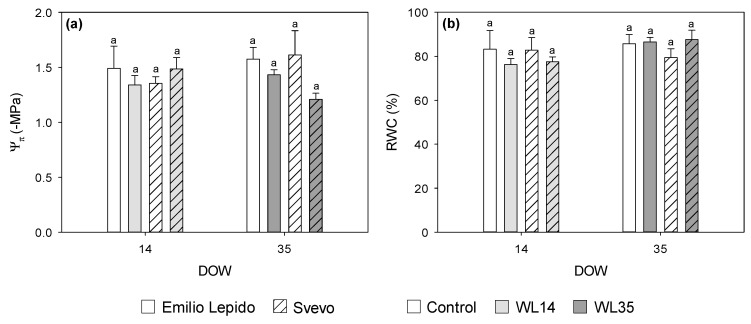
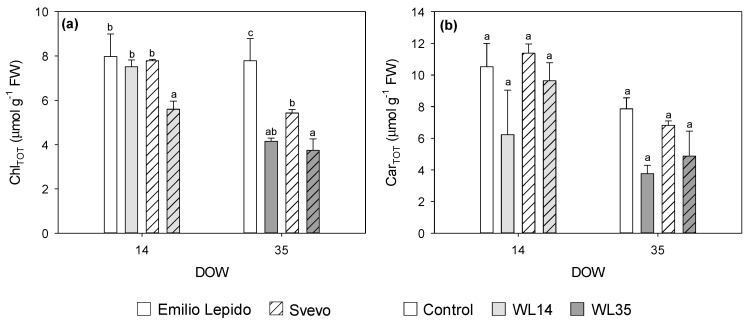
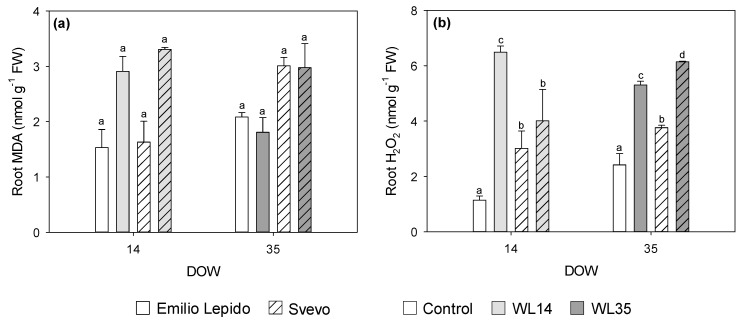
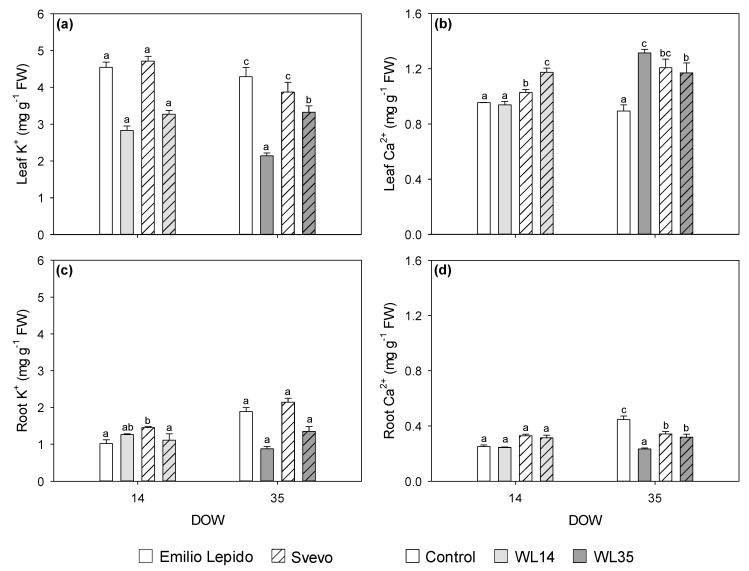
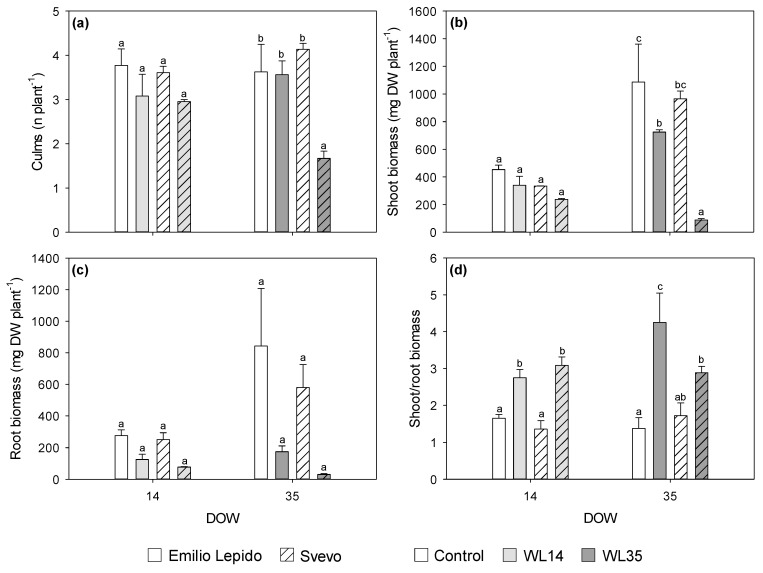
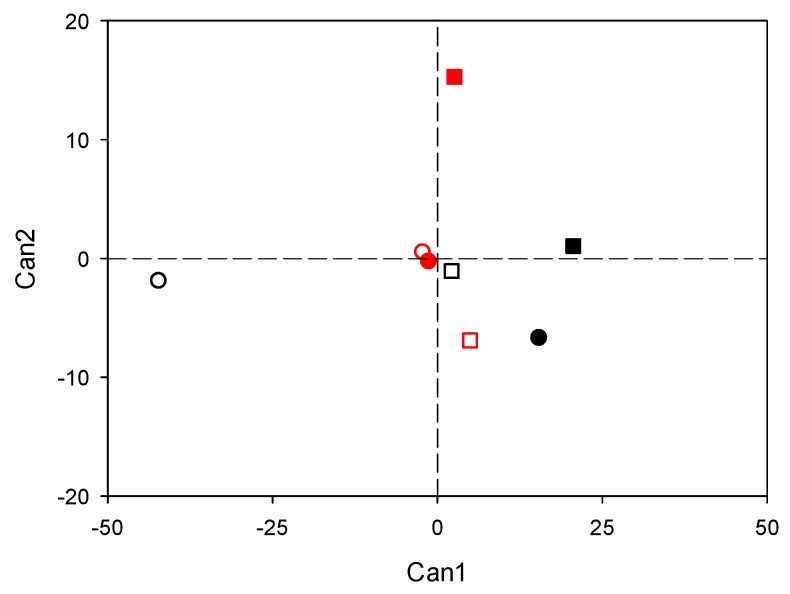
Durum wheat (Triticum turgidum L. subsp. durum (Desf.) Husn) is a staple crop of the Mediterranean countries, where more frequent waterlogging events are predicted due to climate change. However, few investigations have been conducted on the physiological and agronomic responses of this crop to waterlogging. The present study provides a comprehensive evaluation of the effects of two waterlogging durations (i.e., 14 and 35 days) on two durum wheat cultivars (i.e., Svevo and Emilio Lepido). An integrated analysis of an array of physiological, biochemical, biometric, and yield parameters was performed at the end of the waterlogging events, during recovery, and at physiological maturity. Results established that effects on durum wheat varied depending on waterlogging duration. This stress imposed at tillering impaired photosynthetic activity of leaves and determined oxidative injury of the roots. The physiological damages could not be fully recovered, subsequently slowing down tiller formation and crop growth, and depressing the final grain yield. Furthermore, differences in waterlogging tolerance between cultivars were discovered. Our results demonstrate that in durum wheat, the energy maintenance, the cytosolic ion homeostasis, and the ROS control and detoxification can be useful physiological and biochemical parameters to consider for the waterlogging tolerance of genotypes, with regard to sustaining biomass production and grain yield.

Keywords: Triticum turgidum L. subsp. durum; abiotic stress; antioxidants; climate change; flooding; osmoprotectans; reactive oxygen species; yield.


Conflict of interest statement

Authors declare no conflict of interest.

Figures

Figure 1
Figure 1
Air minimum (white dots) and maximum (black dots) temperatures and rainfall (bars) during the cropping season (December 2020–June 2021).
Figure 2
Figure 2
(a) CO2 assimilation rate (A), (b) stomatal conductance (gs), (c) intrinsic water-use efficiency (WUEin), (d) PSII-operating efficiency in light conditions (ΦPSII), (e) photochemical quenching (qP), and (f) non-photochemical quenching (qNP) in the durum wheat cultivars Emilio Lepido (solid) and Svevo (pattern) subjected to 0 (i.e., control; white), 14 (i.e., WL14; light gray), or 35 (i.e., WL35; dark gray) days of waterlogging (DOW). Data are mean ± standard deviation. For each waterlogging duration, according to Tukey’s post hoc test (p ≤ 0.05), different letters indicate significant differences among means (p ≤ 0.05).
Figure 3
Figure 3
(a) Leaf osmotic potential (Ψπ), and (b) leaf relative water content (RWC) of the durum wheat cultivars Emilio Lepido (solid) and Svevo (pattern) subjected to 0 (i.e., control; white), 14 (i.e., WL14; light gray), or 35 (i.e., WL35; dark gray) days of waterlogging (DOW). Data are mean ± standard deviation. For each waterlogging duration, according to Tukey’s post hoc test (p ≤ 0.05), different letters indicate significant differences among means (p ≤ 0.05).
Figure 4
Figure 4
(a) Total chlorophyll (ChlTOT), and (b) total carotenoid (CarTOT) content in leaves of the durum wheat cultivars Emilio Lepido (solid) and Svevo (pattern) subjected to 0 (i.e., control; white), 14 (i.e., WL14; light gray), or 35 (i.e., WL35; dark gray) days of waterlogging (DOW). Data are mean ± standard deviation. FW: fresh weight. For each waterlogging duration, according to Tukey’s post hoc test (p ≤ 0.05), different letters indicate significant differences among means (p ≤ 0.05).
Figure 5
Figure 5
(a) Malondialdehyde (MDA) and (b) hydrogen peroxide (H2O2) content in the roots of the durum wheat cultivars Emilio Lepido (solid) and Svevo (pattern) subjected to 0 (i.e., control; white), 14 (i.e., WL14; light gray), or 35 (i.e., WL35; dark gray) days of waterlogging (DOW). Data are mean ± standard deviation. FW: fresh weight. For each waterlogging duration, according to Tukey’s post hoc test (p ≤ 0.05), different letters indicate significant differences among means (p ≤ 0.05).
Figure 6
Figure 6
(a) Leaf K+ (b), leaf Ca2+ (c), root K+, and (d) root Ca2+ content of the durum wheat cultivars Emilio Lepido (solid) and Svevo (pattern) subjected to 0 (i.e., control; white), 14 (i.e., WL14; light gray), or 35 (i.e., WL35; dark gray) days of waterlogging (DOW). Data are mean ± standard deviation. FW: fresh weight. For each waterlogging duration, according to Tukey’s post hoc test (p ≤ 0.05), different letters indicate significant differences among means (p ≤ 0.05).
Figure 7
Figure 7
(a) Number of culms per plant (b), shoot biomass (c), root biomass, and (d) shoot-to-root ratio of the durum wheat cultivars Emilio Lepido (solid) and Svevo (pattern) subjected to 0 (i.e., control; white), 14 (i.e., WL14; light gray), or 35 (i.e., WL35; dark gray) days of waterlogging (DOW). Data are mean ± standard deviation. DW: dry weight. For each waterlogging duration, according to Tukey’s post hoc test (p ≤ 0.05), different letters indicate significant differences among means (p ≤ 0.05).
Figure 8
Figure 8
Discrimination between cultivar (Emilio Lepido, black; Svevo, red), waterlogging treatment (control, open; waterlogged, closed), and waterlogging duration (14 days, circle; 35 days, square) on the basis of canonical discriminant analysis applied to the full set of parameters collected at the end of waterlogging treatments. The first two canonicals are shown (Can1 and Can2).

References

    1. Semenov M.A., Stratonovitch P., Alghabari F., Gooding M.J. Adapting wheat in Europe for climate change. J. Cereal Sci. 2014;59:245–256. doi: 10.1016/j.jcs.2014.01.006. - DOI - PMC - PubMed
    1. Maccaferri M., Sanguineti M.C., Corneti S., Ortega J.L.A., Salem M.B., Bort J., DeAmbrogio E., Garcia del Moral L.F., Demontis A., El-Ahmed A., et al. Quantitative trait loci for grain yield and adaptation of durum wheat (Triticum durum Desf.) across a wide range of water availability. Genetics. 2008;178:489–511. doi: 10.1534/genetics.107.077297. - DOI - PMC - PubMed
    1. Giorgi F., Lionello P. Climate change projections for the Mediterranean region. Glob. Plan. Change. 2008;63:90–104. doi: 10.1016/j.gloplacha.2007.09.005. - DOI
    1. Herzog M., Striker G.G., Colmer T.D., Pedersen O. Mechanisms of waterlogging tolerance in wheat—A review of root and shoot physiology. Plant Cell Environ. 2016;39:1068–1086. doi: 10.1111/pce.12676. - DOI - PubMed
    1. Pampana S., Masoni A., Arduini I. Grain yield of durum wheat as affected by waterlogging at tillering. Cereal Res. Commun. 2016;44:706–716. doi: 10.1556/0806.44.2016.026. - DOI

LinkOut - more resources