

Mobile Biomonitoring of Atmospheric Pollution: A New Perspective for the Moss-Bag Approach
- PMID: 34834748
- PMCID: PMC8621684
- DOI: 10.3390/plants10112384
Mobile Biomonitoring of Atmospheric Pollution: A New Perspective for the Moss-Bag Approach
Abstract
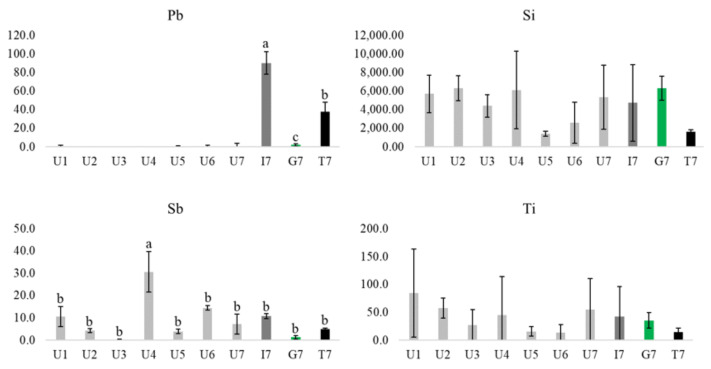
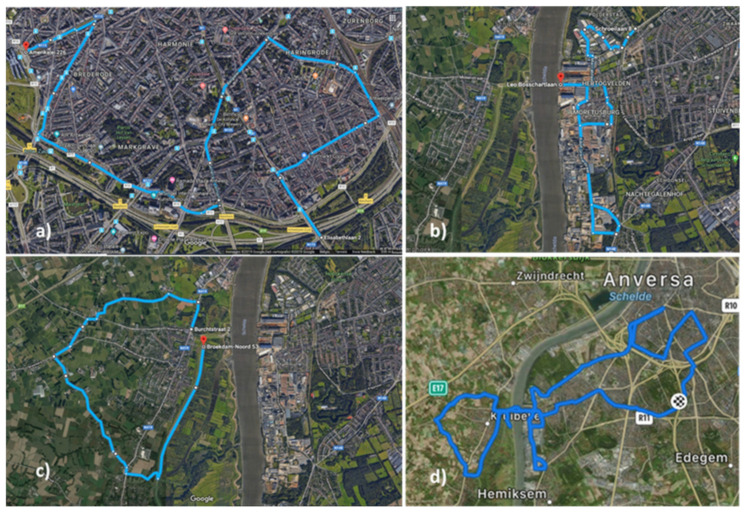
In this work the potential of moving moss-bags, fixed to bicycles, to intercept particulate matter (PM) and linked metal(loid)s was tested for the first time. Seven volunteers carried three moss-bags for fifty days while commuting by bicycle in the urban area of Antwerp, Belgium. Moreover, one bike, equipped with mobile PM samplers, travelled along four routes: urban, industrial, green route and the total path, carrying three moss-bags at each route. The saturation isothermal remanent magnetization (SIRM) signal and chemical composition (assessed by HR-ICP-MS) of the moss samples indicated that the industrial route was the most polluted. Element fluxes (i.e., the ratio between element daily uptake and the specific leaf area) could discriminate among land uses; particularly, they were significantly higher in the industrial route for Ag, As, Cd and Pb; significantly lowest in the green route for As and Pb; and comparable for all accumulated elements along most urban routes. A comparison with a previous experiment carried out in the same study area using similar moss-bags at static exposure points, showed that the element fluxes were significantly higher in the mobile system. Finally, PM2.5 and PM10 masses measured along the four routes were consistent with element fluxes.
Keywords: Hypnum cupressiforme; SIRM; air biomonitoring; elemental pollution.
Conflict of interest statement
The authors declare that they have no known competing financial interest or personal relationship that could have appeared to influence the work reported in this paper.
Figures


References
-
- Duan K., Sun G., Zhang Y., Yahya K., Wang K., Madden J.M., Caldwell P.V., Cohen E.C., McNulty S.G. Impact of air pollution induced climate change on water availability and ecosystem productivity in the conterminous United States. Clim. Chang. 2017;140:259–272. doi: 10.1007/s10584-016-1850-7. - DOI
-
- Wei X., Lyu S., Yu Y., Wang Z., Liu H., Pan D., Chen J. Phylloremediation of air pollutants: Exploiting the potential of plant leaves and leaf-associated microbes. [(accessed on 3 November 2021)];Front. Plant. Sci. 2017 8:1–23. doi: 10.3389/fpls.2017.01318. Available online: https://www.frontiersin.org/articles/10.3389/fpls.2017.01318/full. - DOI - PMC - PubMed
-
- Oves M., Khan M.S., Zaidi A., Ahmad E. Soil contamination, nutritive value, and human health risk assessment of heavy metals: An overview. In: Zaidi A., Wani P., Khan M., editors. Toxicity of Heavy Metals to Legumes and Bioremediation. Springer; Vienna, Austria: 2012. pp. 1–27.
LinkOut - more resources
Full Text Sources
Research Materials
