. 2021 Oct 27;9(11):1247.
doi: 10.3390/vaccines9111247.

Alphavirus-Driven Interferon Gamma (IFNg) Expression Inhibits Tumor Growth in Orthotopic 4T1 Breast Cancer Model

Affiliations

Alphavirus-Driven Interferon Gamma (IFNg) Expression Inhibits Tumor Growth in Orthotopic 4T1 Breast Cancer Model

Olga Trofimova et al. Vaccines (Basel). .

Abstract

Interferon gamma (IFNg) is a pleiotropic cytokine that can potentially reprogram the tumor microenvironment; however, the antitumor immunomodulatory properties of IFNg still need to be validated due to variable therapeutic outcomes in preclinical and clinical studies. We developed a replication-deficient Semliki Forest virus vector expressing IFNg (SFV/IFNg) and evaluated its immunomodulatory antitumor potential in vitro in a model of 3D spheroids and in vivo in an immunocompetent 4T1 mouse breast cancer model. We demonstrated that SFV-derived, IFN-g-stimulated bone marrow macrophages can be used to acquire the tumoricidal M1 phenotype in 3D nonattached conditions. Coculturing SFV/IFNg-infected 4T1 spheroids with BMDMs inhibited spheroid growth. In the orthotopic 4T1 mouse model, intratumoral administration of SFV/IFNg virus particles alone or in combination with the Pam3CSK4 TLR2/1 ligand led to significant inhibition of tumor growth compared to the administration of the control SFV/Luc virus particles. Analysis of the composition of intratumoral lymphoid cells isolated from tumors after SFV/IFNg treatment revealed increased CD4+ and CD8+ and decreased T-reg (CD4+/CD25+/FoxP3+) cell populations. Furthermore, a significant decrease in the populations of cells bearing myeloid cell markers CD11b, CD38, and CD206 was observed. In conclusion, the SFV/IFNg vector induces a therapeutic antitumor T-cell response and inhibits myeloid cell infiltration in treated tumors.

Keywords: CD38; Pam3CSK4; alphavirus; bone-marrow-derived macrophages; cancer immunotherapy; interferon gamma; spheroids; viral vectors.


Conflict of interest statement

The authors declare no conflict of interest.

Figures

Figure 1
Figure 1
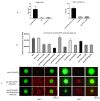
Infection of the 4T1/eGFP cancer cell spheroids with recombinant SFV/DS-Red virus. The 4T1/eGFP cells (3 × 10³ cells per well) were plated into 96-well ultralow attachment plates. The next day, the spheroids were infected with SFV/DS-Red virus (105 i.u./well) either with or without shaking during incubation with the virus (1 h 10 min). Then, the spheroids were incubated for 2 days to allow DS-Red transgene expression. Confocal microscopy was performed using a Leica TCS SP8 microscope, and the images were processed by LasX software as described in the methods. (a) Maximum intensity projection confocal images of the 4T1/eGFP spheroids infected with SFV/DS-Red virus (representative images). (b) Graphical analysis of the mean fluorescence intensity changes from the spheroid upper rim to the spheroid bottom. The eGFP and DS-Red signal curves are indicated by arrows; 48 planes, z step 5 µm. (c) Total fluorescence intensity of the spheroids incubated with or without shaking during infection and the uninfected spheroid controls. Data are presented as the mean of total fluorescence of four spheroids in each group. Error bars represent the standard deviation, n = 4. Statistical analysis was performed by Tukey’s multiple comparison test.
Figure 2
Figure 2
SFV virus-derived IFNg (vdIFNg) activates BMDMs to the M1 phenotype in monolayers (2D) and under free-floating conditions (3D). BMDMs (M0) were seeded in 12-well plates (2D) and in 96-well ultralow attachment plates and incubated for 2 days in the presence of 50 ng/mL vdIFNg and 100 ng/mL Pam3 to polarize macrophages to an M1-like phenotype (M1). M0 control represents BMDMs incubated with vdLuc supernatant (SFV/Luc conditioned medium) obtained in a similar manner as vdIFNg by infection of BHK-21 cells with the respective virus (SFV/Luc, SFV/IFNg). M0 represents untreated BMDMs. (a) Production of nitric oxide (NO) by macrophages activated to M1 under 2D and 3D conditions. The level of nitric oxide was determined in cell culture supernatants after 2 days of BMDM activation with vdIFNg under two different conditions (2D, 3D). (b) Flow cytometry analysis of macrophage surfaces and intracellular markers after 2 days of activation in 2D and 3D conditions. The diagram shows % of total single cells, the bars represent the mean values ± SD. (c) Representative images of flow cytometry illustrating the increase in the MHCII, CD38, and iNOs markers in M1 macrophages under 3D cultivation.
Figure 3
Figure 3
Coculturing of SFV/IFNg-infected 4T1/eGFP spheroids with macrophages. Single 4T1/eGFP spheroids were generated from 3000 cells in 96-well ultralow attachment plates. The next day, the spheroids were infected with either SFV/IFNg or SFV/Luc (5 × 10⁴ i.u./well) or incubated with PBS as the uninfected control. The next day after infection, BMDMs (3 × 10⁴ cells/well) were added to the spheroids (+M0, day 0). In total, twelve combination groups (six single spheroids in each group, n = 6) were prepared: sph—uninfected spheroids (PBS); sph+Pam3; sph+Pam3+M0; sph+SFV/Luc+Pam3+M0; sph+SFV/IFNg+Pam3+M0; sph+SFV/Luc+Pam3; sph+SFV/IFNg+Pam3; sph+SFV/Luc; sph+SFV/IFNg; sph+M0; sph+SFV/Luc+M0; sph+SFV/IFNg+M0. Pam3 was added to a final concentration of 100ng/mL to respective groups. (a) The production of vdIFNg by spheroids was measured in cell culture supernatants by ELISAs 18 h after infection, before the macrophages were added. The production of NO by macrophages was measured in cell culture supernatants after two days of incubation with infected spheroids. (b) The total eGFP fluorescence measured by fluorimetry at day 10 of the incubation. (c) Representative fluorescence microscopy images of spheroids incubated with prestained macrophages (red) at day 0 and day 7. Bars represent the mean values ± SD, n = 6.
Figure 4
Figure 4
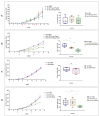
The effect of M1 macrophages polarized by SFV-derived IFNg on 4T1(Luc2) tumor growth. The 4T1(Luc2) cells (1 × 10⁴) were orthotopically coinjected with 2 × 10⁴ M0 (4T1(Luc2)+M0) or M1 (4T1(Luc2)+M1) macrophages in BALB/c mice (n = 5 per group) at day 0. (a) In vivo bioluminescent imaging of 4T1(Luc2) tumors expressing luciferase (days 5–11). (b) Quantitative analysis of tumor bioluminescence and the tumor weights. (c) Bioluminescence imaging of lungs isolated from the tumor-bearing mice. Bars represent the means ± SD (n = 5); *—significant difference (p < 0.05); ns—nonsignificant.
Figure 5
Figure 5
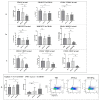
Flow cytometry analysis of immune cells isolated from tumors generated by implantation of 4T1(Luc2) cells premixed with M0 or M1 macrophages. Tumors were homogenized and a single cell suspension was used for immunostaining (see Materials and methods for the details). Flow cytometry was performed to quantify the immune cell populations (%): (a) CD11b+; MHCII+; CD4+; CD8+ in total single cells and CD25+/FoxP3+ in the CD4+ population; and (b) double positive CD11b+/CD38+, CD11b+/CD206+ cells in total single cells. Representative flow cytometry gating data of CD11b+ and CD38+ cells are shown. Bars represent the means ± SD (n = 5); * p < 0.05; ** p < 0.01; ns—nonsignificant.
Figure 6
Figure 6
Inhibition of 4T1 tumor growth by i.t. injection of SFV/IFNg virus. The 4T1 mouse breast tumors were established by subcutaneous (sc.) or orthotopic injections of 2.5 × 10⁵ and 1.25 × 10⁵ 4T1 cells, respectively. Mice received two i.t. injections of SFV vectors (4 × 10⁷ i.u./tumor) or PBS control, as indicated by red arrow time points. The tumor growth curves are shown on the left and the tumor weights of the groups are shown on the right. (a) Treatment of subcutaneous tumors with SFV/IFNg, SFV/Luc, and PBS (control). The next day after virus administration, mice in these groups received i.t. injections of Pam3 solution (10 µg/tumor at day 8 after first virus administration and 15 µg/tumor at day 14 after second virus administration). (b) Treatment of orthotopic tumors with SFV/IFNg, SFV/Luc, and PBS (control). The day after virus administration, mice in these groups similarly received i.t. injections of Pam3 solution (10 µg/tumor at day 5 after first virus administration and 15 µg/tumor at day 11 after second virus administration). (c) Treatment of orthotopic tumors with only Pam3 (or PBS) solution: first Pam3 (10 µg/tumor) i.t. injection at day 5; second Pam3 i.t. injection (15 µg/tumor) at day 11. (d) Treatment of orthotopic tumors only with SFV/IFNg, SFV/Luc, and PBS (control), without the subsequent Pam3 injection. Bars represent the means ± SD (n = 5); * p < 0.05; ** p < 0.01; ns—nonsignificant.
Figure 7
Figure 7
Flow cytometry of the 4T1 tumors treated with SFV/IFNg, SFV/Luc or PBS (mice were treated as presented in Figure 6d). Tumors were resected, homogenized to obtain a single cell suspension, and the total isolated cells were subjected for immunostaning followed by analysis of forward and side (SSC-A/FSC-A) scattering of cell populations. (a) Schematic representation of the identification of four distinct single-cell populations (representative pictures). (b) Percentage of the respective populations within total single cells (five mice per group). (c) Representative SSC-A/FSC-A data from the PBS, SFV/Luc, and SFV/IFNg groups. The pronounced P2 populations are indicated by arrows. Bars represent the means ± SD (n = 5); ** p < 0.01.
Figure 8
Figure 8
Flow cytometry analysis of T cells in the tumors treated with SFV/IFNg, SFV/Luc, or PBS in orthotopic 4T1 mouse breast cancer model (mice were treated as presented in Figure 6d). Resected tumors were homogenized to obtain a single cell suspension, which was used for immunostaining with antibodies against surface markers (CD3, CD4, CD8, CD25) and intracellular markers (FoxP3) in one mixture. (a) Percentages of cell populations. Th cells were identified as CD3+/CD4+; CTL cells as CD3+/CD8+, and T-regs as CD4+/CD25+/FoxP3+ populations. (b) Representative pictures of forward and side (SSC-A/FSC-A) scattering of the cell populations. Arrows indicate the increased population of lymphocytes in the SFV/IFNg group. Bars represent the means ± SD (n = 5); * p < 0.05; ** p < 0.01; ns—nonsignificant.
Figure 9
Figure 9
Flow cytometry analysis of myeloid cells in the tumors treated with SFV/IFNg, SFV/Luc, or PBS in an orthotopic 4T1 mouse breast cancer model. Mice were treated as shown in Figure 6d. Resected tumors were homogenized to obtain a single cell suspension, which was used for immunostaining with antibodies against surface markers (CD11b, CD206, MHCII, CD38) and intracellular markers (Arginase 1, iNOs) in one mixture. (a) Percentages of surface markers CD11b, CD11b (high), and double-positive CD206/CD11b. (b) Percentages of surface markers MHCII (high) and CD11b+MHCII. (c) Percentages of surface markers CD11b+/CD38+ and CD11b/CD38+ (d) Percentages of intracellular markers (Arginase 1; iNOs, inducible NO synthase); representative images of Arginase 1 and iNOs gating in the CD11b+ population are shown. Bars represent the means ± SD (n = 5); * p < 0.05; ** p < 0.01; ns—nonsignificant.

Similar articles

Cited by

References

    1. Berraondo P., Sanmamed M.F., Ochoa M.C., Etxeberria I., Aznar M.A., Pérez-Gracia J.L., Rodríguez-Ruiz M.E., Ponz-Sarvise M.E., Melero I. Cytokines in clinical cancer immunotherapy. Br. J. Cancer. 2019;120:6–15. doi: 10.1038/s41416-018-0328-y. - DOI - PMC - PubMed
    1. Esquivel-Velázquez M., Ostoa-Saloma P., Palacios-Arreola M.I., Nava-Castro K.E., Castro J.I., Morales-Montor J. The role of cytokines in breast cancer development and progression. J. Interferon Cytokine Res. 2015;35:1–16. doi: 10.1089/jir.2014.0026. - DOI - PMC - PubMed
    1. Castro F., Cardoso A.P., Gonçalves R.M., Serre K., Oliveira M.J. Interferon-gamma at the crossroads of tumor immune surveillance or evasion. Front. Immunol. 2018;9:847. doi: 10.3389/fimmu.2018.00847. - DOI - PMC - PubMed
    1. Chin Y.E., Kitagawa M., Su W.C., You Z.H., Iwamoto Y., Fu X.Y. Cell growth arrest and induction of cyclin-dependent kinase inhibitor p21 WAF1/CIP1 mediated by STAT1. Science. 1996;272:719–722. doi: 10.1126/science.272.5262.719. - DOI - PubMed
    1. Kalanjeri S., Sterman D.H. Gene therapy in interventional pulmonology: Interferon gene delivery with focus on thoracic malignancies. Curr. Respir. Care Rep. 2012;1:54–66. doi: 10.1007/s13665-011-0008-3. - DOI