Review
. 2021 Nov 4;9(11):1279.
doi: 10.3390/vaccines9111279.

Targeting COVID Vaccine Hesitancy in Rural Communities in Tennessee: Implications for Extending the COVID-19 Pandemic in the South

Affiliations
Review

Targeting COVID Vaccine Hesitancy in Rural Communities in Tennessee: Implications for Extending the COVID-19 Pandemic in the South

Donald J Alcendor. Vaccines (Basel). .

Abstract

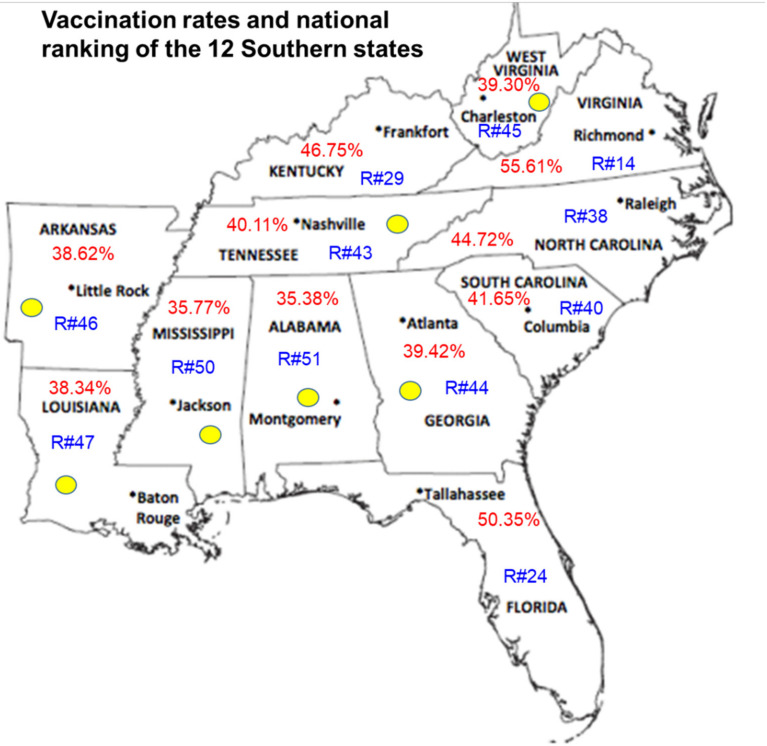
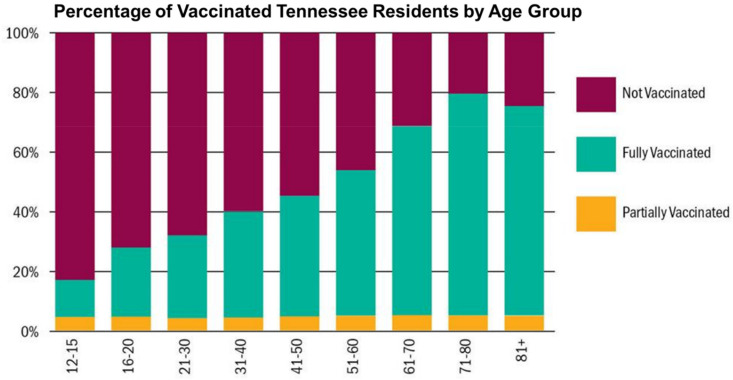
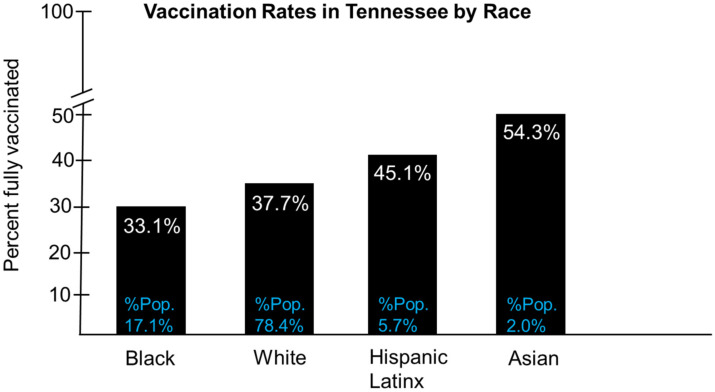
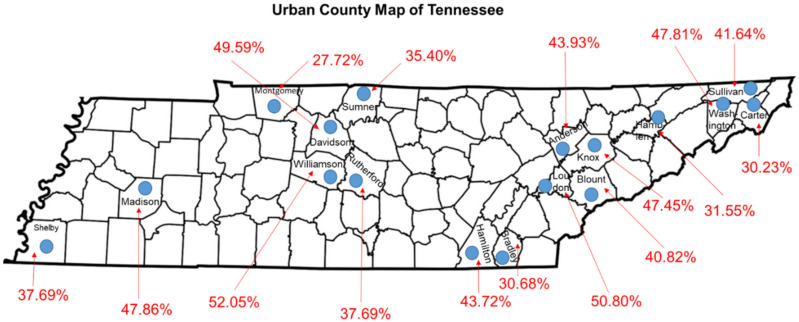
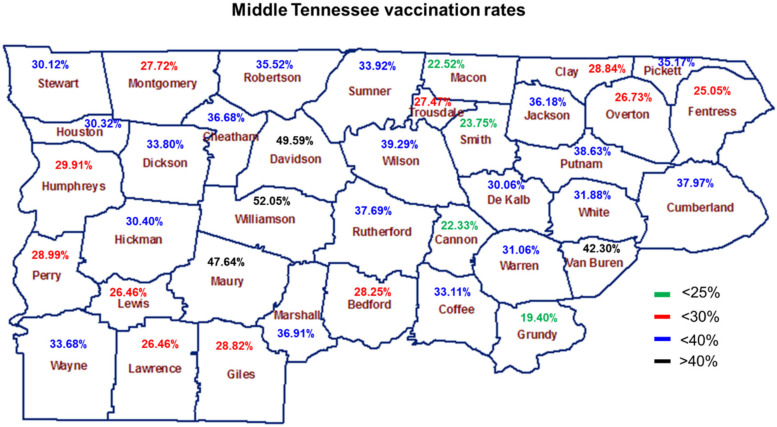
Approximately 40% of Tennesseans are vaccinated fully, due mainly to higher vaccination levels within urban counties. Significantly lower rates are observed in rural counties. Surveys suggest COVID-19 vaccine hesitancy is entrenched mostly among individuals identifying as white, rural, Republican, and evangelical Christian. Rural counties represent 70 of the total 95 counties in Tennessee, and vaccine hesitancy signifies an immediate public health crisis likely to extend the COVID-19 pandemic. Tennessee is a microcosm of the pandemic's condition in the Southern U.S. Unvaccinated communities are the greatest contributors of new COVID-19 infections, hospitalizations, and deaths. Rural Tennesseans have a long history of cultural conservatism, poor health literacy, and distrust of government and medical establishments and are more susceptible to misinformation and conspiracy theories. Development of novel strategies to increase vaccine acceptance is essential. Here, I examine the basis of COVID-19 following SARS-CoV-2 infection and summarize the pandemic's extent in the South, current vaccination rates and efforts across Tennessee, and underlying factors contributing to vaccine hesitancy. Finally, I discuss specific strategies to combat COVID-19 vaccine hesitancy. We must develop novel strategies that go beyond financial incentives, proven ineffective toward vaccinations. Successful strategies for vaccine acceptance of rural Tennesseans could increase acceptance among unvaccinated rural U.S. populations.

Keywords: COVID-19; Tennessee; rural; urban; vaccination rate; vaccine hesitancy.


Conflict of interest statement

The author declares no competing interests. The funders did not participate in the design, preparation, data analysis, or the decision to publish the manuscript.

Figures

Figure 1
Figure 1
Vaccination rates and national rankings of the 12 Southern states. Vaccination rates within the 12 Southern states are reflected in red text, vaccination rate rankings in the U.S. are reflected in blue text, and states with the lowest vaccination rates in the South are identified with yellow ovals. Vaccination rates were obtained from a statewide https://www.tn.gov/health/cedep/ncov/data.html (accessed on 21 July 2021), vaccine tracker database.
Figure 2
Figure 2
Percentage of Tennesseans unvaccinated, fully vaccinated, and partially vaccinated by age group as of 11 July 2021. The data shows the percentage of individuals vaccinated and unvaccinated by age. The percentage of residents who remain unvaccinated appears as red bars. The percentage of residents who are vaccinated fully appear as green bars, and those partially vaccinated appear as yellow bars (Source: Tennessee Department of Health https://www.tn.gov/health/cedep/ncov/data.html; accessed on 11 July 2021).
Figure 3
Figure 3
Vaccination rates in Tennessee by race. Vaccination rates in Blacks, Non-Hispanic whites, Hispanic/Latinx, and Asians appear as the percentage of the population they represent (Source https://www.tn.gov/health/cedep/ncov/data.html (accessed on 11 July 2021).
Figure 4
Figure 4
Vaccination rates in the 17 urban Tennessee counties. Urban counties are labelled in black and designated as blue ovals. Vaccinations are given as percentages in red text. Vaccination rates were obtained from the Tennessee Department of Health. https://www.tn.gov/health/cedep/ncov/data.html (accessed on 11 July 2021).
Figure 5
Figure 5
Vaccination rates for the 38 counties in Middle Tennessee as of 18 July 2021. Counties in Middle Tennessee are labeled in brown text. Vaccination rates < 25% are shown in green text, vaccination rates < 30% are shown in red text, vaccination rates < 40% are shown in blue text, and vaccination rates > 40% are shown in black text. Vaccination rates were obtained from the Tennessee Department of Health https://www.tn.gov/health/cedep/ncov/data.html (accessed on 11 July 2021).

Similar articles

Cited by

References

    1. Bassetti M., Vena A.D., Giacobbe R. The Novel Chinese Coronavirus (2019nCoV) Infections: Challenges for fighting the storm. Eur. J. Clin. Investig. 2020;50:e13209. doi: 10.1111/eci.13209. - DOI - PMC - PubMed
    1. Lai C.C., Shih T.P., Ko W.C., Tang H.J., Hsueh P.R. Severe acute respiratory syndrome coronavirus 2 (SARS-CoV-2) and coronavirus disease-2019 (COVID-19): The epidemic and the challenges. Int. J. Antimicrob. Agents. 2020;3:105924. doi: 10.1016/j.ijantimicag.2020.105924. - DOI - PMC - PubMed
    1. Li Q., Guan X., Wu P., Wang X., Zhou L., Tong Y. Early transmission dynamics in Wuhan, China, of novel coronavirus-infected pneumonia. N. Engl. J. Med. 2020;13:1199–1207. doi: 10.1056/NEJMoa2001316. - DOI - PMC - PubMed
    1. Huang C., Wang Y., Li X., Ren L., Zhao J., Hu Y. Clinical features of patients infected with 2019 novel coronavirus in Wuhan, China. Lancet. 2020;395:497–506. doi: 10.1016/S0140-6736(20)30183-5. - DOI - PMC - PubMed
    1. Hartenian E., Nandakumar D., Lari A., Ly M., Tucker J.M., Glaunsinger B.A. The molecular virology of coronaviruses. J. Biol. Chem. 2020;37:12910–12934. doi: 10.1074/jbc.REV120.013930. - DOI - PMC - PubMed

LinkOut - more resources