. 2021 Oct 29;9(11):2259.
doi: 10.3390/microorganisms9112259.

Elevated Anti-SARS-CoV-2 Antibodies and IL-6, IL-8, MIP-1β, Early Predictors of Severe COVID-19

Affiliations

Elevated Anti-SARS-CoV-2 Antibodies and IL-6, IL-8, MIP-1β, Early Predictors of Severe COVID-19

Helena Codina et al. Microorganisms. .

Abstract

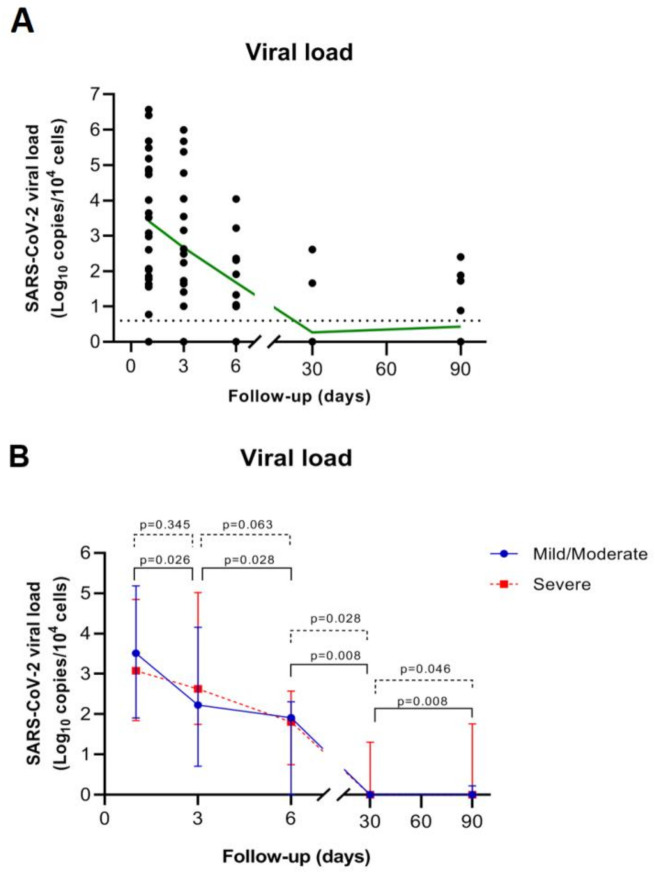
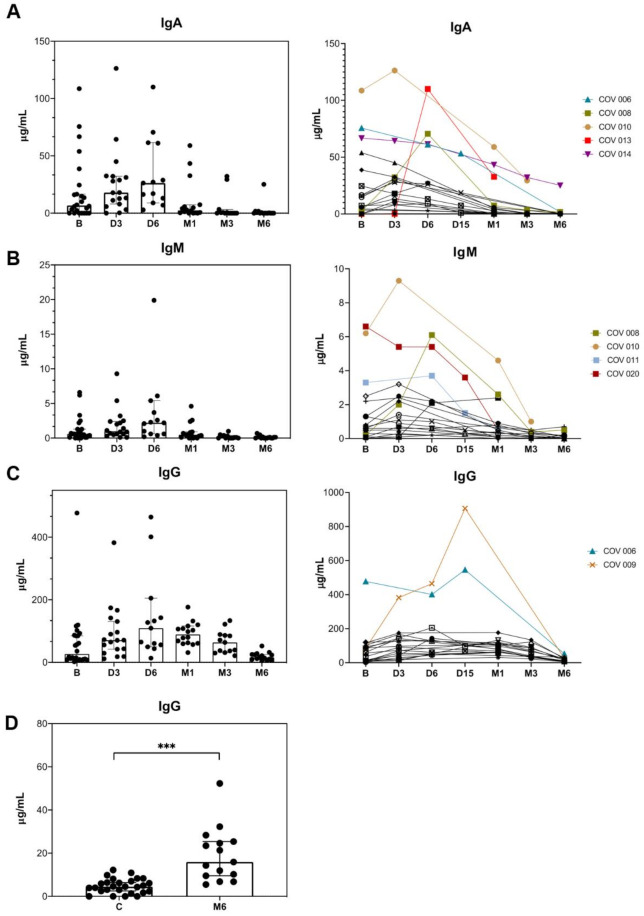
Viral and host immune kinetics during acute COVID-19 and after remission of acute symptoms need better characterization. SARS-CoV-2 RNA, anti-SARS-CoV-2 IgA, IgM, and IgG antibodies, and proinflammatory cytokines were measured in sequential samples from hospitalized COVID-19 patients during acute infection and six months following diagnosis. Twenty four laboratory confirmed COVID-19 patients with mild/moderate and severe COVID-19 were included. Most were males (83%) with a median age of 61 years. Twenty one percent were admitted to the intensive care unit (ICU) and eight of them (33.3%) met the criteria for severe COVID-19 disease. A delay in SARS-CoV-2 levels' decline during the first six days of follow up, and viral load persistence until month 3 were related to severe COVID-19, but not viral load levels at the diagnosis. Higher levels of anti-SARS-CoV-2 IgA, IgM, IgG and the cytokines IL-6, IL-8 and MIP-1β at the diagnosis time were related to the severe COVID-19 outcome. Higher levels of MIP-1β, IL-1β, MIP-1α and IFN-γ were observed at month 1 and 3 during mild/moderate disease, compared to severe COVID-19. IgG persisted at low levels after six months of diagnosis. In conclusion, higher concentrations of IgA, IgM, and IgG, and IL-6, IL-8 and MIP-1β are identified as early predictors of COVID-19 severity, whereas no significant association is found between baseline SARS-COV-2 viral load and COVID-19 severity.

Keywords: SARS-CoV-2; anti-SARS-CoV-2 antibodies; cytokines; severe COVID-19; viral load.


Conflict of interest statement

The authors declare that the research was conducted in the absence of any commercial or financial relationships that could be construed as a potential conflict of interest.

Figures

Figure 1
Figure 1
SARS-CoV-2 viral load kinetics. (A) SARS-CoV-2 RNA levels among the overall study population during the study period. The black dots represent the aligned individual values obtained from each time point. The green line represents the connected mean values. The dotted line indicates the established experimental threshold (below the lowest positive sample obtained in our study). (B) Median SARS-CoV-2 RNA levels in patients with mild/moderate versus severe COVID-19. The solid blue line with circles represents the mild/moderate group and dotted red line with squares represents the severe group. Wilcoxon signed rank test was performed for the decline of viral load between time points; p: p-value.
Figure 2
Figure 2
Absolute levels at different time points during the study period and antibodies IgA (A), IgM (B) and IgG (C) kinetics in specific patients. Absolute levels of IgA (A), IgM (B) and IgG (C) among the overall study population (n = 24) at baseline (B), day 3 (D3), day 6 (D6), month 1 (M1), month 3 (M3) and month 6 (M6) after SARS-CoV-2 infection and changes of serum IgA (A), IgM (B) and IgG (C) antibodies in specific patients (n = 19) at baseline (B), day 3 (D3), day 6 (D6), month 1 (M1), month 3 (M3) and month 6 (M6) after SARS-CoV-2 infection. Patients COV 006, COV 008, COV 009, COV 010, COV 011, COV 013, COV 014 and COV 020 belong to the severe group. (D) Comparison of IgG levels between uninfected controls (c) and patients after 6 months of SARS-CoV-2 infection. Mann–Whitney U test. ***, p-value < 0.0001.
Figure 3
Figure 3
Cytokine kinetics in patients with mild/moderate versus severe COVID-19 during the study period. Cytokine levels are expressed as median ± IQR. The solid blue line with circles represents the mild/moderate group (n = 12) and dotted red line with squares represents severe group (n = 6). Differences between both groups at each time point were assessed using Mann–Whitney U test. *, p-value < 0,05; **, p-value < 0.001.

Similar articles

Cited by

References

    1. Chen N., Zhou M., Dong X., Qu J., Gong F., Han Y., Qiu Y., Wang J., Liu Y., Wei Y., et al. Epidemiological and clinical characteristics of 99 cases of 2019 novel corona-virus pneumonia in Wuhan, China: A descriptive study. Lancet. 2020;395:507–513. doi: 10.1016/S0140-6736(20)30211-7. - DOI - PMC - PubMed
    1. Xu Z., Shi L., Wang Y., Zhang J., Huang L., Zhang C., Liu S., Zhao P., Liu H., Zhu L., et al. Pathological findings of COVID-19 associated with acute respiratory distress syndrome. Lancet Respir. Med. 2020;8:420–422. doi: 10.1016/S2213-2600(20)30076-X. - DOI - PMC - PubMed
    1. Hu J., Wang Y. The Clinical Characteristics and Risk Factors of Severe COVID-19. Gerontology. 2021;67:255–266. doi: 10.1159/000513400. - DOI - PMC - PubMed
    1. Qin C., Zhou L., Hu Z., Zhang S., Yang S., Tao Y., Xie C., Ma K., Shang K., Wang W., et al. Dysregulation of Immune Response in Patients With Coronavirus 2019 (COVID-19) in Wuhan, China. Clin. Infect. Dis. 2020;71:762–768. doi: 10.1093/cid/ciaa248. - DOI - PMC - PubMed
    1. Guo L., Ren L., Yang S., Xiao M., Chang D., Yang F., Cruz C.S.D., Wang Y., Wu C., Xiao Y., et al. Profiling Early Humoral Response to Diagnose Novel Coronavirus Disease (COVID-19) Clin. Infect. Dis. 2020;71:778–785. doi: 10.1093/cid/ciaa310. - DOI - PMC - PubMed