. 2021 Nov 22;9(11):2407.
doi: 10.3390/microorganisms9112407.

New Insights into the Host-Pathogen Interaction of Mycoplasma gallisepticum and Avian Metapneumovirus in Tracheal Organ Cultures of Chicken

Affiliations

New Insights into the Host-Pathogen Interaction of Mycoplasma gallisepticum and Avian Metapneumovirus in Tracheal Organ Cultures of Chicken

Nancy Rüger et al. Microorganisms. .

Abstract

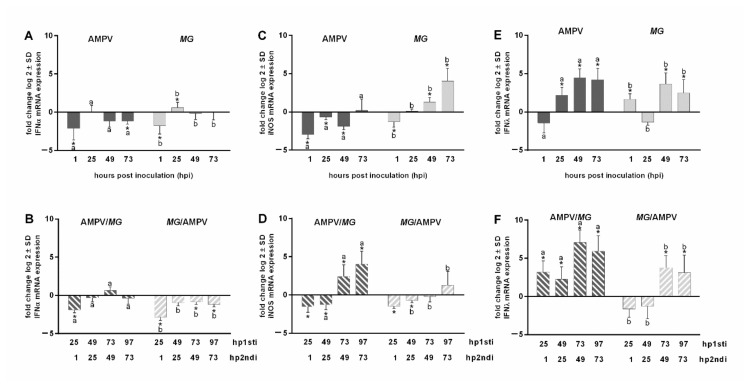
Respiratory pathogens are a health threat for poultry. Co-infections lead to the exacerbation of clinical symptoms and lesions. Mycoplasma gallisepticum (M. gallispeticum) and Avian Metapneumovirus (AMPV) are two avian respiratory pathogens that co-circulate worldwide. The knowledge about the host-pathogen interaction of M. gallispeticum and AMPV in the chicken respiratory tract is limited. We aimed to investigate how co-infections affect the pathogenesis of the respiratory disease and whether the order of invading pathogens leads to changes in host-pathogen interaction. We used chicken tracheal organ cultures (TOC) to investigate pathogen invasion and replication, lesion development, and selected innate immune responses, such as interferon (IFN) α, inducible nitric oxide synthase (iNOS) and IFNλ mRNA expression levels. We performed mono-inoculations (AMPV or M. gallispeticum) or dual-inoculations in two orders with a 24-h interval between the first and second pathogen. Dual-inoculations compared to mono-inoculations resulted in more severe host reactions. Pre-infection with AMPV followed by M. gallispeticum resulted in prolonged viral replication, more significant innate immune responses, and lesions (p < 0.05). AMPV as the secondary pathogen impaired the bacterial attachment process. Consequently, the M. gallispeticum replication was delayed, the innate immune response was less pronounced, and lesions appeared later. Our results suggest a competing process in co-infections and offer new insights in disease processes.

Keywords: Mycoplasma gallisepticum; TOC; avian metapneumovirus; co-infection; innate immunity; interferon.


Conflict of interest statement

The authors declare no conflict of interest.

Figures

Figure 1
Figure 1
Effect of the inoculation scheme on AMPV and M. gallispeticum replication during the early phase post inoculation (pi) Five TOCs per group were taken at 1, 25, 49, 73, and 97 hpi (hpAMPVi and/or hpMGi) and processed for AMPV (A) and M. gallispeticum (MG) (B) quantification. Values were normalized against the RPL13 housekeeping gene. Normalized data are presented as mean 40–Ct. Samples of the same experimental setup were used for immunohistochemical staining of AMPV (C) and M. gallispeticum (D). Antigen-positive cells were counted in three microscopic fields per TOC. The average of five rings per time point per group was calculated. Error bars indicate standard deviation (SD). Small letters indicate significant differences between different inoculation groups at the same time point. (A,B) Tukey HSD all-pairwise comparison test. (C,D) Kruskal–Wallis all-pairwise comparison test. M. gallispeticum indicates M. gallispeticum inoculation, AMPV indicates AMPV inoculation. Single symbols within the graph represent different inoculation time points. Graphs represent summarized data of two independent repeats of experiment.
Figure 2
Figure 2
Ultrastructural insights into the adherence and colonization of M. gallispeticum at the epithelial surface of chicken TOC. Electron microscopic images of the epithelial surface of chicken TOCs inoculated with M. gallispeticum and/or AMPV. (A) M. gallispeticum-inoculated, 73 hpMGi, ×16,000 magnification, (B) M. gallispeticum/AMPV- inoculated, 25 hpMGi/1hpAMPVi, ×25,000 magnification. Five TOCs/group/time point were taken at 1, 25, 49, and 73 h post mono- or second inoculation. White arrowheads indicate attached and cell-invading mycoplasmas, and white arrows indicate intracellular located mycoplasma.
Figure 3
Figure 3
Ultrastructural insights into the adherence and colonization of AMPV at the epithelial surface of chicken TOC. Electron microscopic images of the epithelial surface of chicken TOCs inoculated with M. gallispeticum and/or AMPV. (C1) AMPV-inoculated, 15mpAMPVi, ×12,500 and (C2) ×40,000 magnification; (D1) AMPV-inoculated, 15mpAMPVi, ×50,000 magnification. Five TOCs/group/time point were taken at 1, 25, 49, and 73 h post mono- or second inoculation. Black-outlined arrowheads indicate virus-like particles. Black box indicates section on next image (D2).
Figure 4
Figure 4
Progress of ciliostasis in chicken TOCs 1–10 days after inoculation with M. gallispeticum and/or AMPV. Graphs represent the average daily ciliary activity (in %) of 10 TOCs/group (Exp.1). TOCs were randomly allocated to five different inoculation groups: M. gallispeticum (MG) mono, AMPV mono, M. gallispeticum/AMPV (MG/AMPV), AMPV/M. gallispeticum (AMPV/MG), and control. The TOCs were observed daily for ciliary activity up to 10 days post inoculation (dpi). Error bars indicate the standard deviation (SD). Letters indicate significant differences between the five different inoculation groups at the same time points, with p < 0.05, Kruskal–Wallis all-pairwise comparison test. Graphs represent the summarized data of two independent repeats.
Figure 5
Figure 5
Histopathological examination of the lesion development at the epithelial surface of chicken TOCs with M. gallispeticum and/or AMPV. Microscopic images of the AMPV-, M. gallispeticum-, M. gallispeticum/AMPV-, AMPV/M. gallispeticum-inoculated and control groups. (A) 97 hpAMPVi, (B) 97 hpMGi, (C.2) 121 hpMGi/97 hpAMPVi, (D) 121 hpAMPVi/97 hpMGi, (E) non-inoculated control, all × 400 magnification. Gray arrows indicate partial ciliary destruction. Asterisks indicate total destruction of cilia. Black box indicates magnification of selected area with ciliary destruction. (C) 121 hpMGi/97 hpAMPVi.
Figure 6
Figure 6
Quantification of IFNα (A,B), iNOS (C,D) and IFNλ (E,F) mRNA expression after AMPV and M. gallispeticum mono- and co-infection. TOCs were either mono- (A,C,E) or co-infected (B,D,F) with AMPV and M. gallispeticum (MG). Five TOCs/group/time point were taken. ΔCt values were normalized to the RPL13 RNA expressions and the log 2-fold change was calculated. The mRNA expressions are presented as log 2-fold change compared to the control groups. Error bars indicate the standard deviation (SD). Asterisks indicate significant differences between the mRNA expression levels of the inoculation group and the negative (pathogen-free) group at the same time point, with p < 0.05, Wilcoxon Rank sum test. Small letters indicate significant differences between two respective groups at the same time point (p < 0.05, Wilcoxon Rank sum test). Graphs represent the summarized data of two independent repeats.
Figure 7
Figure 7
Quantification of AMPV and M. gallispeticum in correlation to the IFNα mRNA expression. (A) AMPV-inoculated group and (B) M. gallispeticum (MG)-inoculated group, with 10 samples/group/time point. TOC (n = 10/group/time point) were inoculated with M. gallispeticum and/or AMPV. Error bars indicate the standard deviations (SD). Asterisks indicate significant differences between the mRNA expression levels of the inoculated group and the control group at the same time point, with p < 0.05, two sample t-test. Letters indicate significant differences in the pathogen load between two consecutive time points (p < 0.05, Tukey HSD all-pairwise comparison test). Graphs represent the summarized data of two independently repeated experiments.

Similar articles

Cited by

References

    1. Mohammed H.O., Carpenter T.E., Yamamoto R. Economic Impact of Mycoplasma gallisepticum and M. synoviae in Commercial Layer Flocks. Avian Dis. 1987;31:477. doi: 10.2307/1590727. - DOI - PubMed
    1. Felice V., Lupini C., Mescolini G., Silveira F., Guerrini A., Catelli E., Di Francesco A. Molecular detection and characterization of Mycoplasma gallisepticum and Mycoplasma synoviae strains in backyard poultry in Italy. Poult. Sci. 2020;99:719–724. doi: 10.1016/j.psj.2019.12.020. - DOI - PMC - PubMed
    1. Sid H., Benachour K., Rautenschlein S. Co-infection with Multiple Respiratory Pathogens Contributes to Increased Mortality Rates in Algerian Poultry Flocks. Avian Dis. 2015;59:440–446. doi: 10.1637/11063-031615-Case.1. - DOI - PubMed
    1. Sid H., Hartmann S., Petersen H., Ryll M., Rautenschlein S. Mycoplasma gallisepticum modifies the pathogenesis of influenza A virus in the avian tracheal epithelium. Int. J. Med Microbiol. 2016;306:174–186. doi: 10.1016/j.ijmm.2016.04.001. - DOI - PubMed
    1. Hutton S., Bettridge J., Christley R., Habte T., Ganapathy K. Detection of infectious bronchitis virus 793B, avian metapneumovirus, Mycoplasma gallisepticum and Mycoplasma synoviae in poultry in Ethiopia. Trop. Anim. Heal. Prod. 2016;49:317–322. doi: 10.1007/s11250-016-1195-2. - DOI - PMC - PubMed

LinkOut - more resources