. 2021 Oct 28;13(11):3856.
doi: 10.3390/nu13113856.

Meal Patterns and Food Choices of Female Rats Fed a Cafeteria-Style Diet Are Altered by Gastric Bypass Surgery

Affiliations

Meal Patterns and Food Choices of Female Rats Fed a Cafeteria-Style Diet Are Altered by Gastric Bypass Surgery

Ginger D Blonde et al. Nutrients. .

Abstract

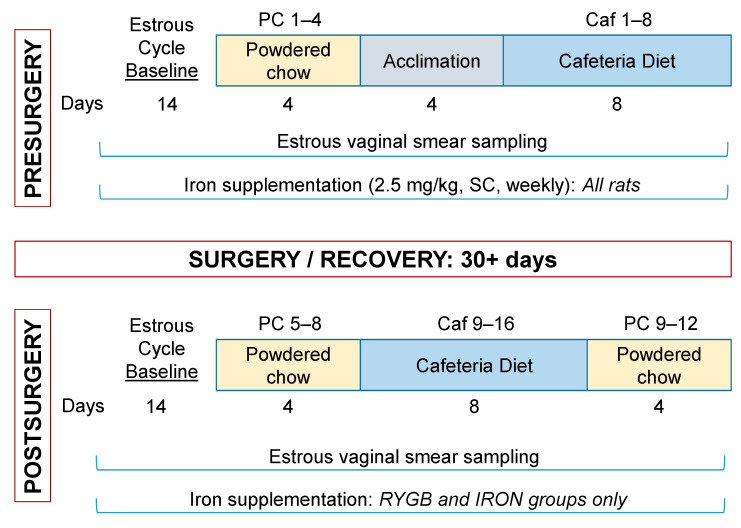
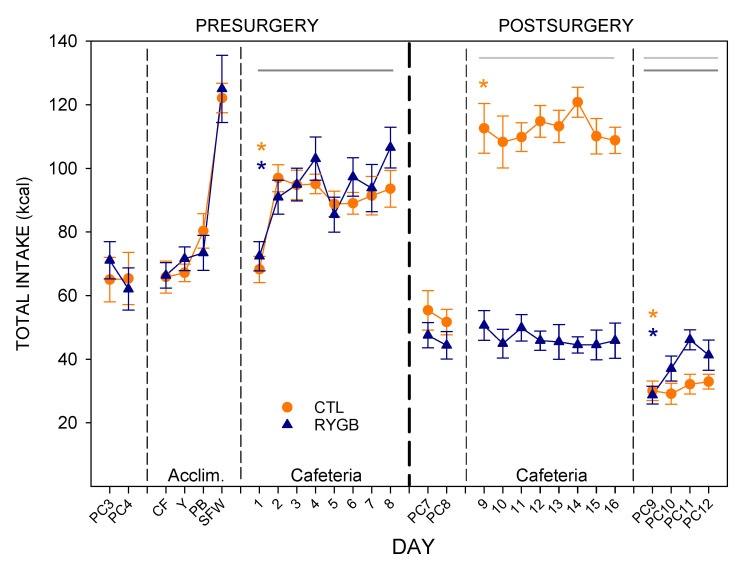
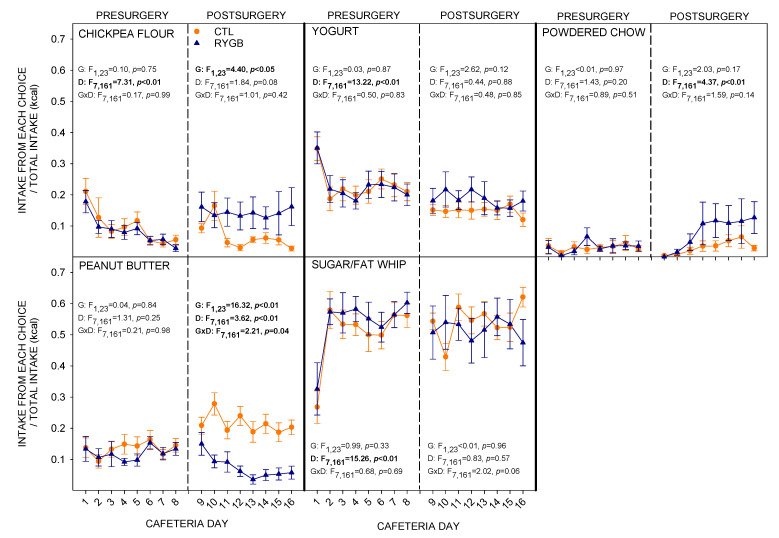
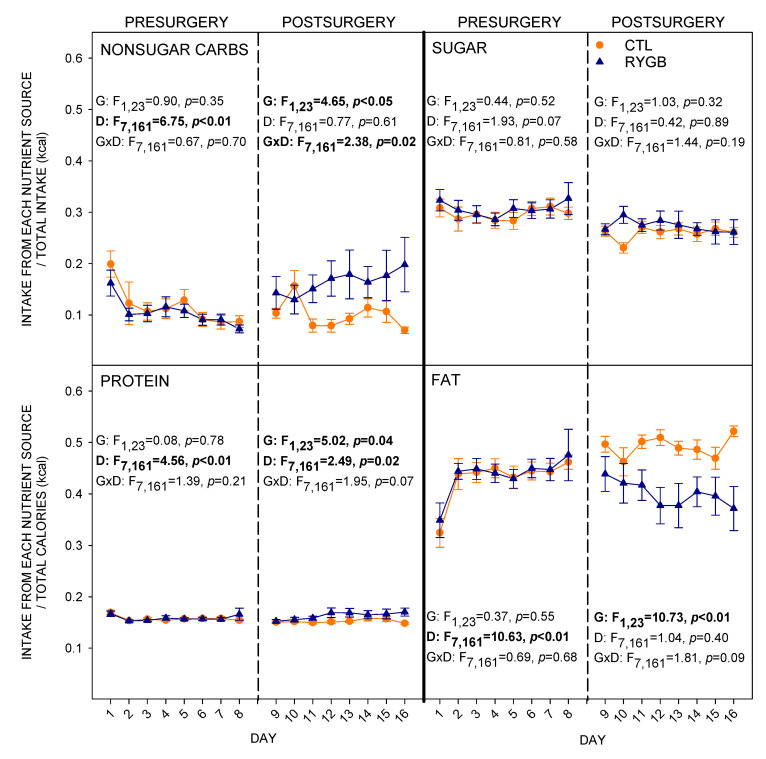
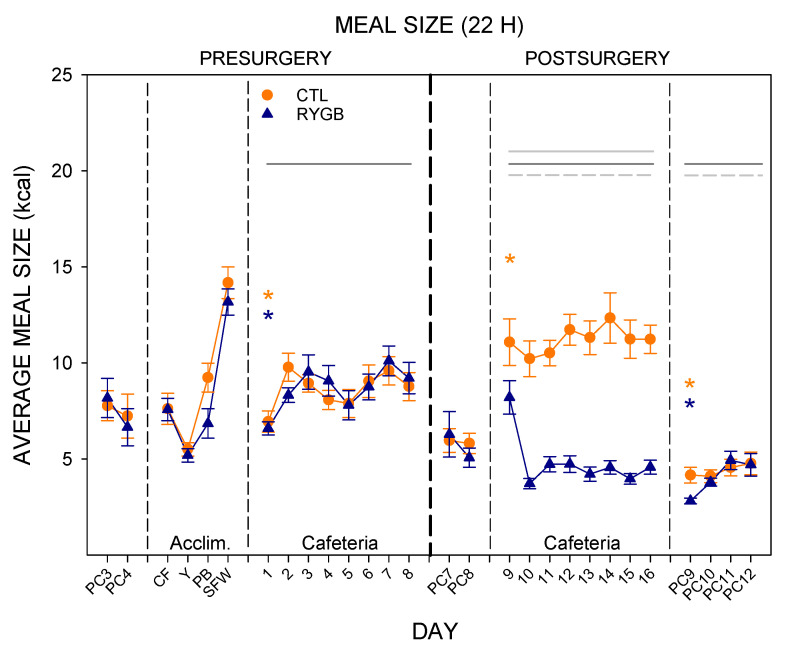
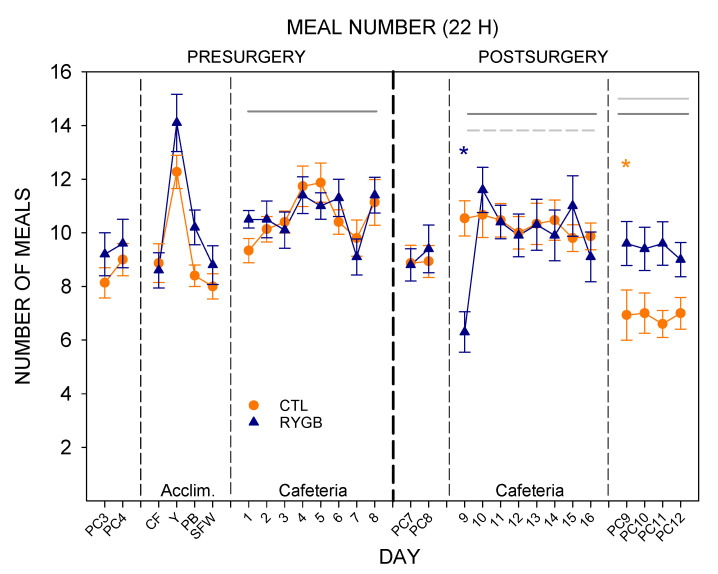
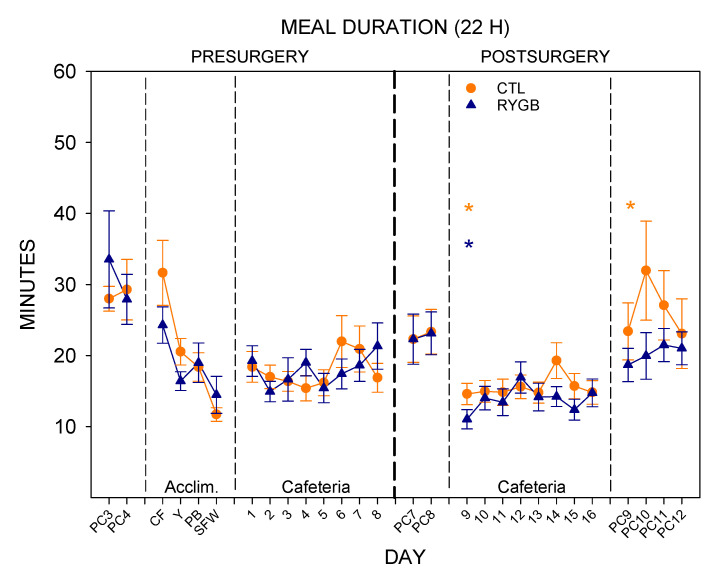
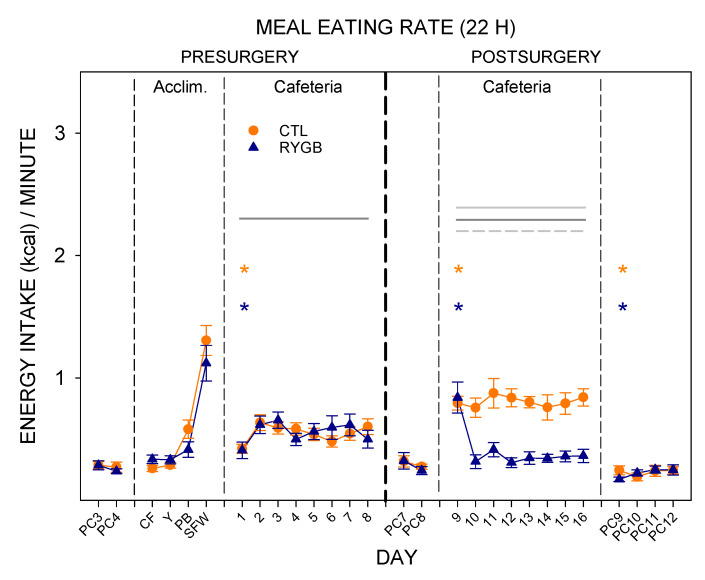
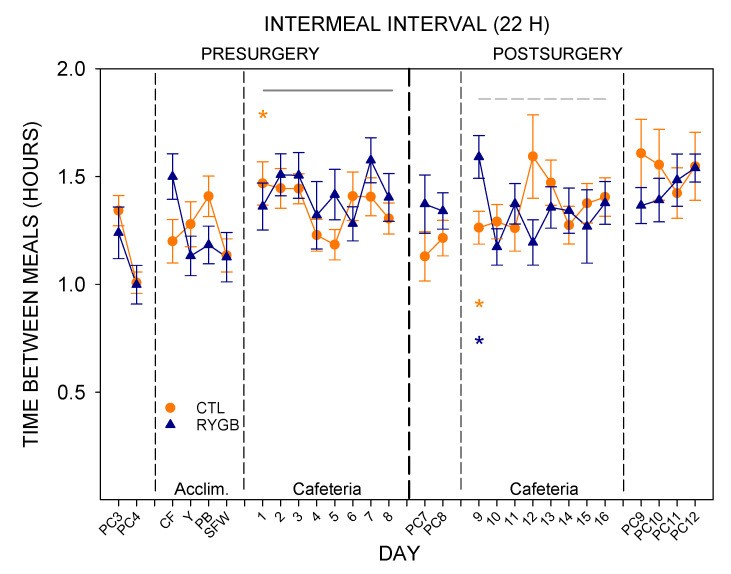
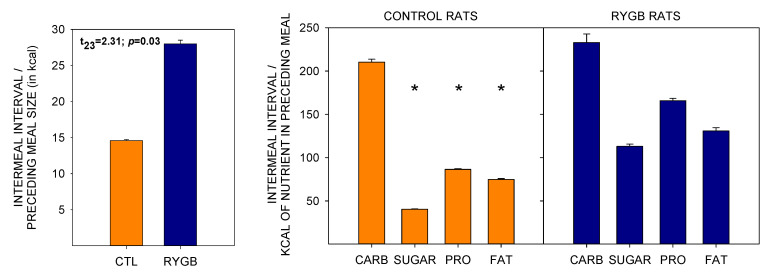
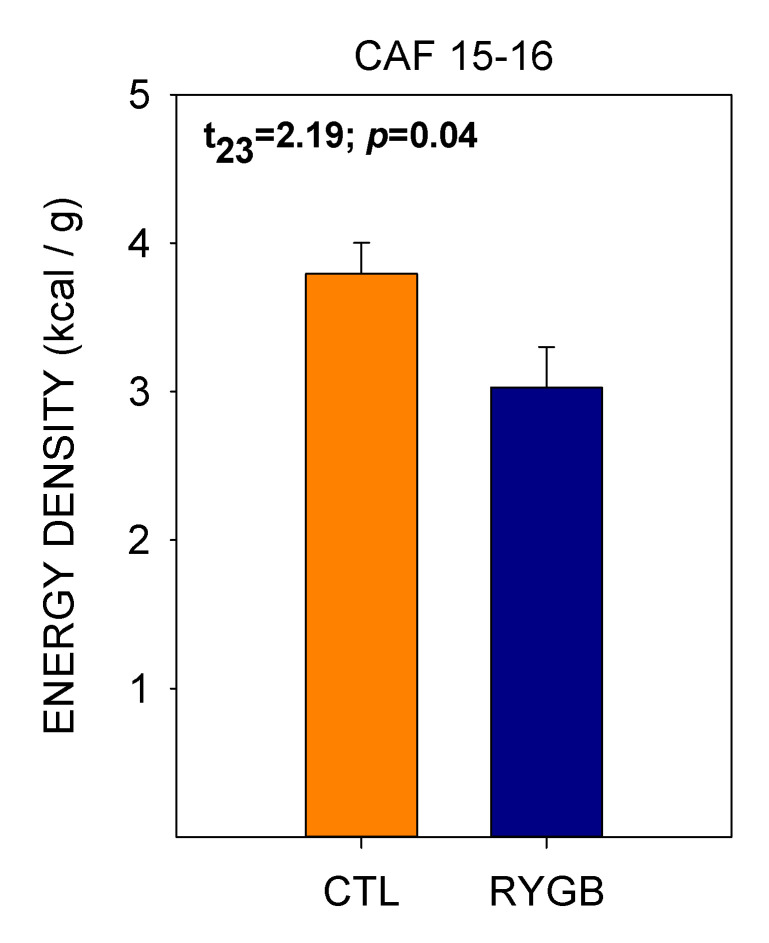
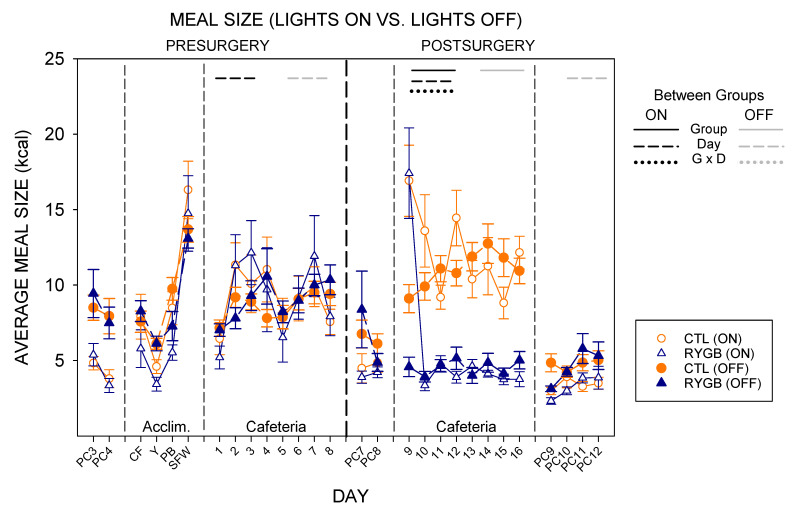
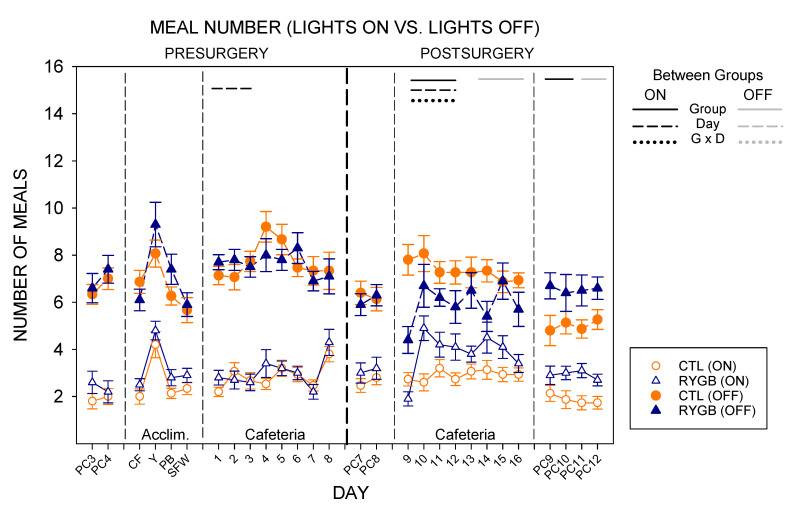
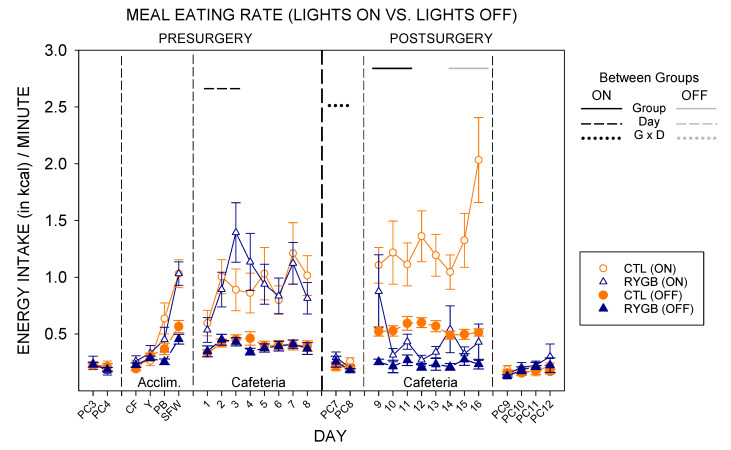
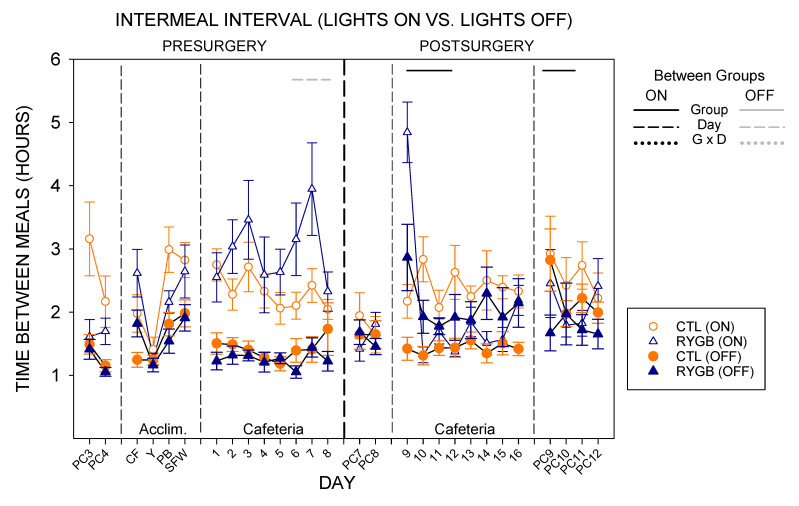
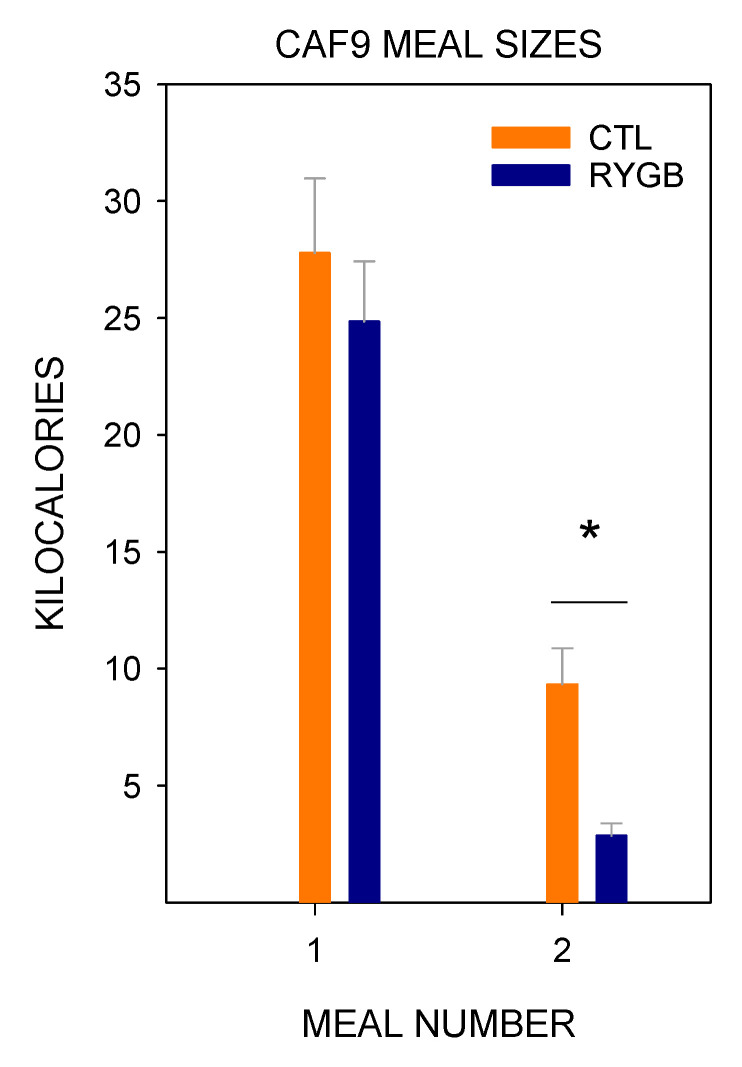
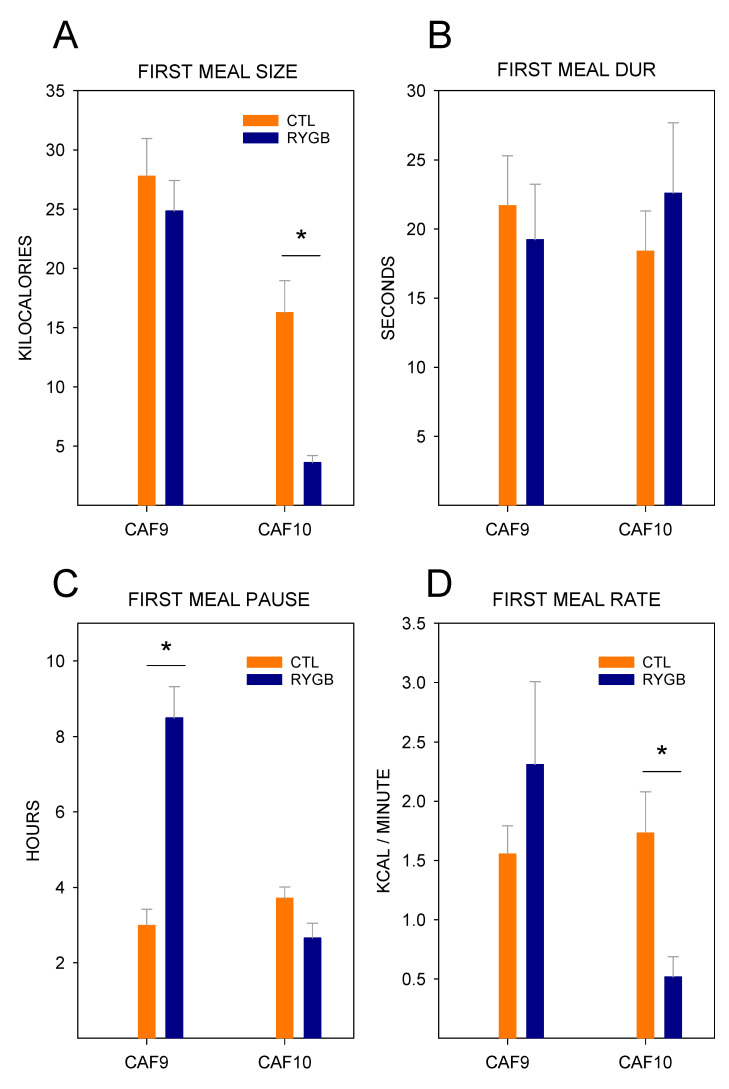
After Roux-en-Y gastric bypass surgery (RYGB), rats tend to reduce consumption of high-sugar and/or high-fat foods over time. Here, we sought to investigate the behavioral mechanisms underlying these intake outcomes. Adult female rats were provided a cafeteria diet comprised of five palatable foodstuffs varying in sugar and fat content and intake was monitored continuously. Rats were then assigned to either RYGB, or one of two control (CTL) groups: sham surgery or a nonsurgical control group receiving the same prophylactic iron treatments as RYGB rats. Post-sur-gically, all rats consumed a large first meal of the cafeteria diet. After the first meal, RYGB rats reduced intake primarily by decreasing the meal sizes relative to CTL rats, ate meals more slowly, and displayed altered nycthemeral timing of intake yielding more daytime meals and fewer nighttime meals. Collectively, these meal patterns indicate that despite being motivated to consume a cafeteria diet after RYGB, rats rapidly learn to modify eating behaviors to consume foods more slowly across the entire day. RYGB rats also altered food preferences, but more slowly than the changes in meal patterns, and ate proportionally more energy from complex carbohydrates and protein and proportionally less fat. Overall, the pattern of results suggests that after RYGB rats quickly learn to adjust their size, eating rate, and distribution of meals without altering meal number and to shift their macronutrient intake away from fat; these changes appear to be more related to postingestive events than to a fundamental decline in the palatability of food choices.

Keywords: Roux-en-Y gastric bypass; cafeteria diet; food choice; macronutrient selection; meal pattern analysis; rat.


Conflict of interest statement

The authors declare no conflict of interest.

Figures

Figure 1
Figure 1
The five-Item Food Choice Monitor. Top: a set of customized cages connected to a computer. Bottom left: the front of a single cage, showing the components to measure food intake—the stainless-steel food hood, glass jars, HDPE jar holders and load cells to measure food intake. Bottom right: the back of a single cage, with the stainless-steel nest flanked by bottles set into the lick blocks, connected by cable to the interface box under the base of the unit.
Figure 2
Figure 2
Experimental schedule.
Figure 3
Figure 3
Daily Energy Intake across All 22-h Periods during Meal Pattern Monitoring. Mean (±SE) for CTL rats (combined SHAM and IRON groups, n = 14; orange circles) and RYGB (n = 11; blue triangles) rats for powdered chow days (PC), acclimation days for each food (Acclim.; CF: chickpea flour; Y: yogurt; PB: peanut butter; SFW: sugar/fat whip), and cafeteria diet days. Dashed vertical lines indicate transitions between diet conditions (thin dashed) and between pre- and postsurgical phases (thick dashed). Statistically significant results from two-way mixed ANOVAs (Table 2) are indicated by horizontal lines: Gray solid (group), dark gray solid (day), or gray dashed (group × day interaction). *: Statistically significant result of a paired t-test for the group indicated by color, comparing the marked day to the previous day (Table 3).
Figure 4
Figure 4
Daily Proportion of Energy from Each Food Choice in the Cafeteria Diet. Mean (±SE) proportion of energy (in kcal) across both pre-surgical and post-surgical days are presented for CTL (combined SHAM and IRON groups, n = 14; orange circles) and RYGB (n = 11; blue triangles). Inset: results from two-way mixed ANOVAs (G: group, D: day, G × D: group × day), with significant results in bold.
Figure 5
Figure 5
Daily Proportion of Energy from Each Primary Nutrient Source. Mean (±SE) proportion of energy (in kcal) across both pre-surgical and post-surgical days are presented for CTL (combined SHAM and IRON groups, n = 14; orange circles) and RYGB (n = 11; blue triangles). Inset: results from two-way mixed ANOVAs (G: group, D: day, G × D: group × day), with significant results in bold.
Figure 6
Figure 6
Meal Sizes across All 22-H Periods during Meal Pattern Monitoring. Mean (±SE) for CTL (combined SHAM and IRON groups, n = 14; orange circles) and RYGB (n = 11; blue triangles) rats for powdered chow days (PC), acclimation days for each food (Acclim.; CF: chickpea flour; Y: yogurt; PB: peanut butter; SFW: sugar/fat whip), and cafeteria diet days. Dashed vertical lines indicate transitions between diet conditions (thin dashed) and between pre- and post-surgical phases (thick dashed). Statistically significant results from two-way mixed ANOVAs (Table 4) are indicated by horizontal lines: Gray solid (group), dark gray solid (day), or gray dashed (group × day interaction). *: Statistically significant result of a paired t-test (Table 5) for the group indicated by color, comparing the marked day to the previous day.
Figure 7
Figure 7
Meal Number across All 22-H Periods during Meal Pattern Monitoring. Mean (±SE) for CTL (combined SHAM and IRON groups, n = 14; orange circles) and RYGB (n = 11; blue triangles) rats for powdered chow days (PC), acclimation days for each food (Acclim.; CF: chickpea flour; Y: yogurt; PB: peanut butter; SFW: sugar/fat whip), and cafeteria diet days. Dashed vertical lines indicate transitions between diet conditions (thin dashed) and between pre- and post-surgical phases (thick dashed). Statistically significant results from two-way mixed ANOVAs (Table 6) are indicated by horizontal lines: Gray solid (group), dark gray solid (day), or gray dashed (group × day interaction). *: Statistically significant result of a paired t-test (Table 7) for the group indicated by color, comparing the marked day to the previous day.
Figure 8
Figure 8
Meal Duration across All 22-H Periods during Meal Pattern Monitoring. Mean (±SE) meal size (in min) for CTL (combined SHAM and IRON groups, n = 14; orange circles) and RYGB (n = 11; blue triangles) rats for powdered chow days (PC), acclimation days for each food (Acclim.; CF: chickpea flour; Y: yogurt; PB: peanut butter; SFW: sugar/fat whip), and cafeteria diet days. Dashed vertical lines indicate transitions between diet conditions (thin dashed) and between pre- and post-surgical phases (thick dashed). Statistically significant results from two-way mixed ANOVAs (Table 8) are indicated by horizontal lines: Gray solid (group), dark gray solid (day), or gray dashed (group × day interaction). *: Statistically significant result of a paired t-test (Table 9) for the group indicated by color, comparing the marked day to the previous day.
Figure 9
Figure 9
Meal Eating Rate across all 22-H Periods during Meal Pattern Monitoring. Mean (±SE) rate of consumption in kilocalories/minute for CTL (combined SHAM and IRON groups, n = 14; orange circles) and RYGB (n = 11; blue triangles) rats for powdered chow days (PC), acclimation days for each food (Acclim.; CF: chickpea flour; Y: yogurt; PB: peanut butter; SFW: sugar/fat whip), and cafeteria diet days. Dashed vertical lines indicate transitions between diet conditions (thin dashed) and between pre- and post-surgical phases (thick dashed). Statistically significant results from two-way mixed ANOVAs (Table 10) are indicated by horizontal lines: Gray solid (group), dark gray solid (day), or gray dashed (group × day interaction). *: Statistically significant result of a paired t-test (Table 11) for the group indicated by color, comparing the marked day to the previous day.
Figure 10
Figure 10
Intermeal Intervals across All 22-H Periods during Meal Pattern Monitoring. Mean (±SE) time between meals (in hours) for CTL (combined SHAM and IRON groups, n = 14; orange circles) and RYGB (n = 11; blue triangles) rats for powdered chow days (PC), acclimation days for each food (Acclim.; CF: chickpea flour; Y: yogurt; PB: peanut butter; SFW: sugar/fat whip), and cafeteria diet days. Dashed vertical lines indicate transitions between diet conditions (thin dashed) and between pre- and post-surgical phases (thick dashed). Statistically significant results from two-way mixed ANOVAs (Table 12) are indicated by horizontal lines: Gray solid (group), dark gray solid (day), or gray dashed (group × day interaction). *: Statistically significant result of a paired t-test (Table 13) for the group indicated by color, comparing the marked day to the previous day.
Figure 11
Figure 11
Satiety Ratios in a Meal and from Each Nutrient Type. Mean (±SE) satiety ratios for CTL (orange) and RYGB (blue) groups for meals from the last two days of post-surgical cafeteria diet access (days 15–16), calculated by dividing the intermeal interval (in min) by the total kilocalories in the previous meal (left), or by the kilocalories from a single nutrient type in the previous meal (right). The result of a two-sample t-test comparing satiety ratios of a full meal is inset in the left panel. Two-sample t-tests between groups were run to compare satiety ratios for each nutrient type. Carbohydrates: t23 = 0.98; p = 0.09; Sugar: t23 = 3.17, p < 0.01; Protein: t23 = 3.91, p < 0.01; Fat: t23 = 2.31; p = 0.03. *: significant results of two-sample t-tests comparing between groups.
Figure 12
Figure 12
Energy Density of Meals. Mean (±SE) energy density for all meals consumed during the last cafeteria diet days by CTL (n = 14; orange bars) and RYGB (n = 11; blue bars). Inset: results of t-tests comparing groups.
Figure 13
Figure 13
Meal Size for Meals with Lights On vs. Lights Off. Average (±SE) meal sizes when lights were on (open symbols) or off (filled symbols) for each day for CTL (combined SHAM and IRON groups, n = 14; orange circles) and RYGB (n = 11; blue triangles) rats for powdered chow days (PC), acclimation days for each food (Acclim.; CF: chickpea flour; Y: yogurt; PB: peanut butter; SFW: sugar/fat whip), and cafeteria diet days. Dashed vertical lines indicate transitions between diet conditions (thin dashed) and between pre- and post-surgical phases (thick dashed). Statistically significant results from between-group two-way mixed ANOVAs (Table 14) are indicated by the legend; within-group ANOVA results are found in Table 15.
Figure 14
Figure 14
Meal Number for Meals with Lights On vs. Lights Off. Average (±SE) meal number when lights were on (open symbols) or off (filled symbols) for each day for CTL (combined SHAM and IRON groups, n = 14; orange circles) and RYGB (n = 11; blue triangles) rats for powdered chow days (PC), acclimation days for each food (Acclim.; CF: chickpea flour; Y: yogurt; PB: peanut butter; SFW: sugar/fat whip), and cafeteria diet days. Dashed vertical lines indicate transitions between diet conditions (thin dashed) and between pre- and postsurgical phases (thick dashed). Statistically significant results from between-group two-way mixed ANOVAs (Table 16) are indicated by the legend; within-group ANOVA results are presented in Table 17.
Figure 15
Figure 15
Meal Eating Rate for Meals with Lights On vs. Lights Off. Mean (±SE) rate of consumption in kilocalories/minute when lights were on (open symbols) or off (filled symbols) for each day for CTL (combined SHAM and IRON groups, n = 14; orange circles) and RYGB (n = 11; blue triangles) rats for powdered chow days (PC), acclimation days for each food (Acclim.; CF: chickpea flour; Y: yogurt; PB: peanut butter; SFW: sugar/fat whip), and cafeteria diet days. Dashed vertical lines indicate transitions between diet conditions (thin dashed) and between pre- and post-surgical phases (thick dashed). Statistically significant results from between-group two-way mixed ANOVAs (Table 18) are indicated by the legend; within-group ANOVA results are presented in Table 19.
Figure 16
Figure 16
Intermeal Interval for Meals with Lights On vs. Lights Off. Mean (±SE) intermeal interval in hours when lights were on (open symbols) or off (filled symbols) for each day for CTL (combined SHAM and IRON groups, n = 14; orange circles) and RYGB (n = 11; blue triangles) rats for powdered chow days (PC), acclimation days for each food (Acclim.; CF: chickpea flour; Y: yogurt; PB: peanut butter; SFW: sugar/fat whip), and cafeteria diet days. Dashed vertical lines indicate transitions between diet conditions (thin dashed) and between pre- and post-surgical phases (thick dashed). Statistically significant results from between-group two-way mixed ANOVAs (Table 20) are indicated by the legend; within-group ANOVA results are presented in Table 21.
Figure 17
Figure 17
Energy Consumed in the First and Second Meal of Cafeteria Diet Postsurgically. Mean (±SE) meal size (in kcal) for Control (CTL; combined SHAM and IRON groups, n = 14) and RYGB (n = 11) rats. *: Significant results (p < 0.05) from two-sample t-tests.
Figure 18
Figure 18
Meal Patterns for the First Meal Consumed on the First Day of Cafeteria Diet Exposure Postsurgically (CAF9) and the Second Day (CAF10). Mean (±SE) size (A), duration (B), postmeal pause (C) and first meal rate (D) for CTL (combined SHAM and IRON groups, n = 14) and RYGB (n = 11) rats. *: Significant results (p ≤ 0.05) from two-sample t-tests.

Similar articles

Cited by

References

    1. Buchwald H., Avidor Y., Braunwald E. Bariatric surgery. A systematic review and meta-analysis. ACC Curr. J. Rev. 2005;14:13. doi: 10.1016/j.accreview.2004.12.068. - DOI - PubMed
    1. Buchwald H., Estok R., Fahrbach K., Banel D., Jensen M.D., Pories W.J., Bantle J.P., Sledge I. Weight and Type 2 Diabetes after Bariatric Surgery: Systematic Review and Meta-analysis. Am. J. Med. 2009;122:248–256.e5. doi: 10.1016/j.amjmed.2008.09.041. - DOI - PubMed
    1. Batterham R.L., Cummings D.E. Mechanisms of Diabetes Improvement Following Bariatric/Metabolic Surgery. Diabetes Care. 2016;39:893–901. doi: 10.2337/dc16-0145. - DOI - PMC - PubMed
    1. Sjöström L., Lindroos A.-K., Peltonen M., Torgerson J., Bouchard C., Carlsson B., Dahlgren S., Larsson B., Narbro K., Sjöström C.D., et al. Lifestyle, Diabetes, and Cardiovascular Risk Factors 10 Years after Bariatric Surgery. N. Engl. J. Med. 2004;351:2683–2693. doi: 10.1056/NEJMoa035622. - DOI - PubMed
    1. Adams T.D., Gress R.E., Smith S.C., Halverson R.C., Simper S.C., Rosamond W.D., LaMonte M.J., Stroup A.M., Hunt S.C. Long-Term Mortality after Gastric Bypass Surgery. N. Engl. J. Med. 2007;357:753–761. doi: 10.1056/NEJMoa066603. - DOI - PubMed