. 2021 Nov 22;13(11):4177.
doi: 10.3390/nu13114177.

Blackcurrant Improves Diabetic Cardiovascular Dysfunction by Reducing Inflammatory Cytokines in Type 2 Diabetes Mellitus Mice

Affiliations

Blackcurrant Improves Diabetic Cardiovascular Dysfunction by Reducing Inflammatory Cytokines in Type 2 Diabetes Mellitus Mice

Hye-Yoom Kim et al. Nutrients. .

Abstract

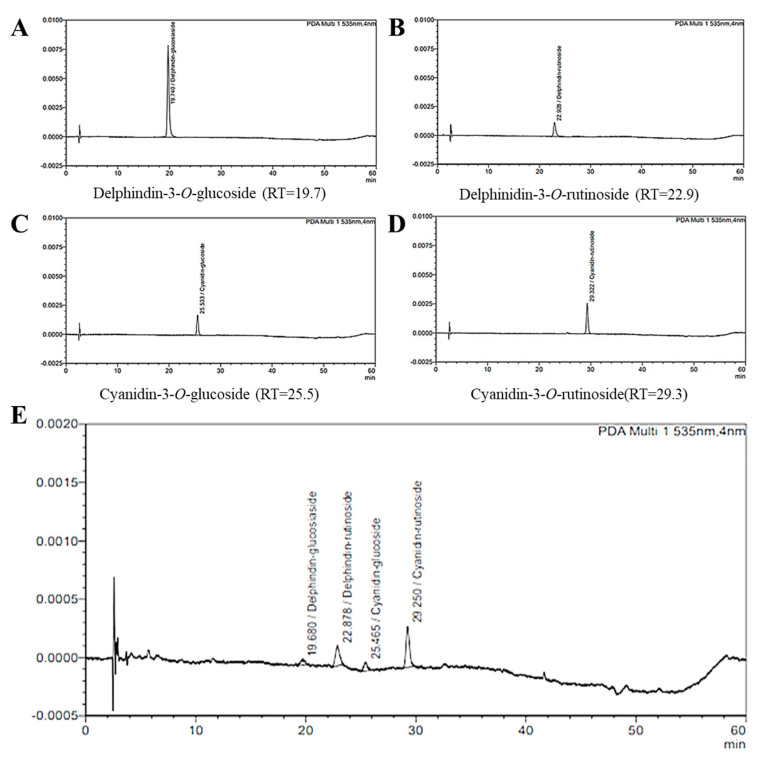
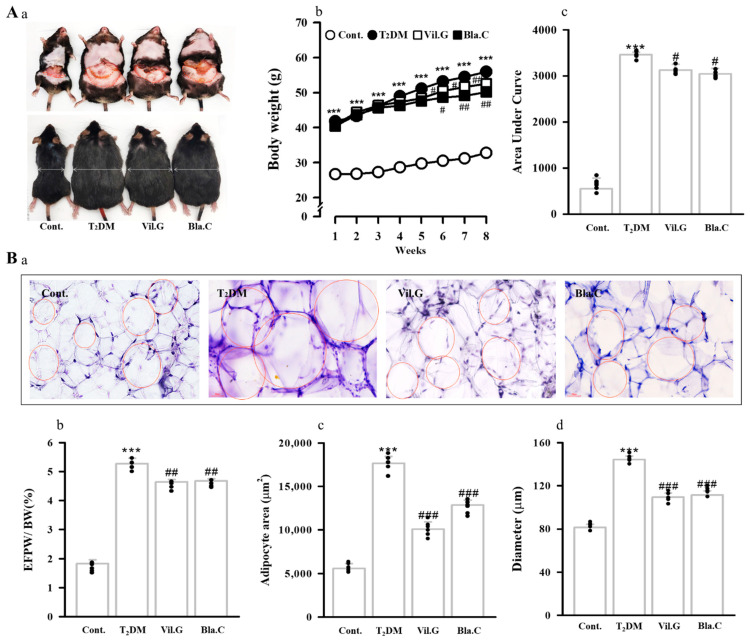
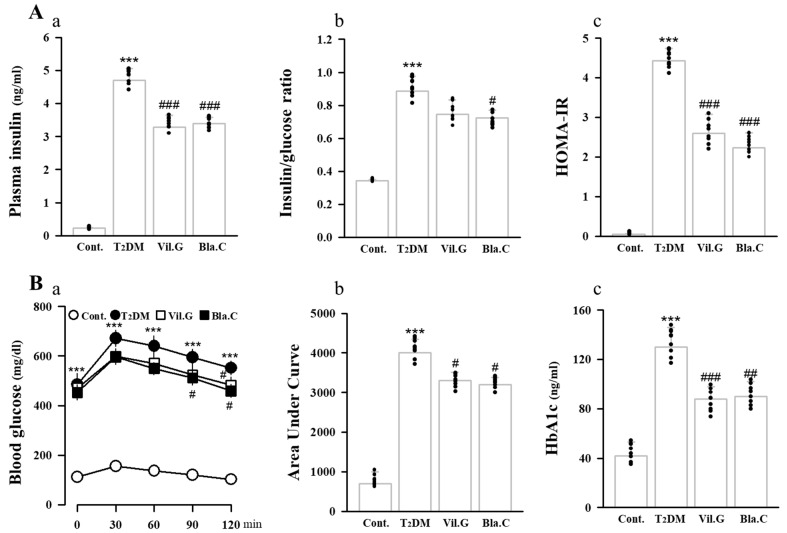
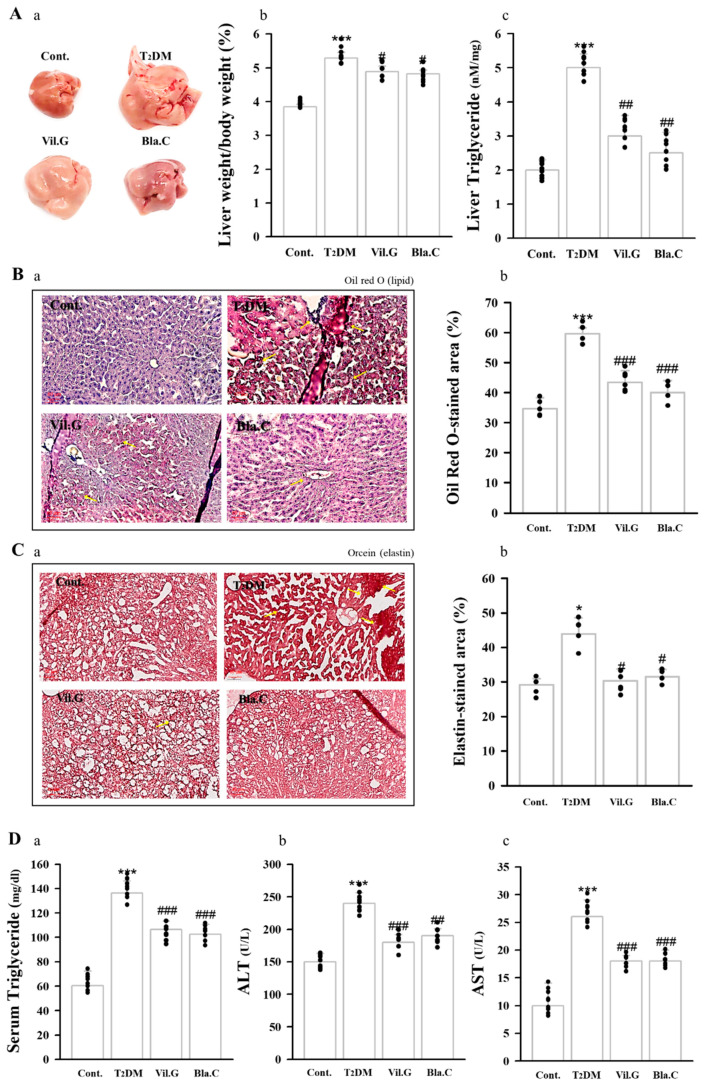
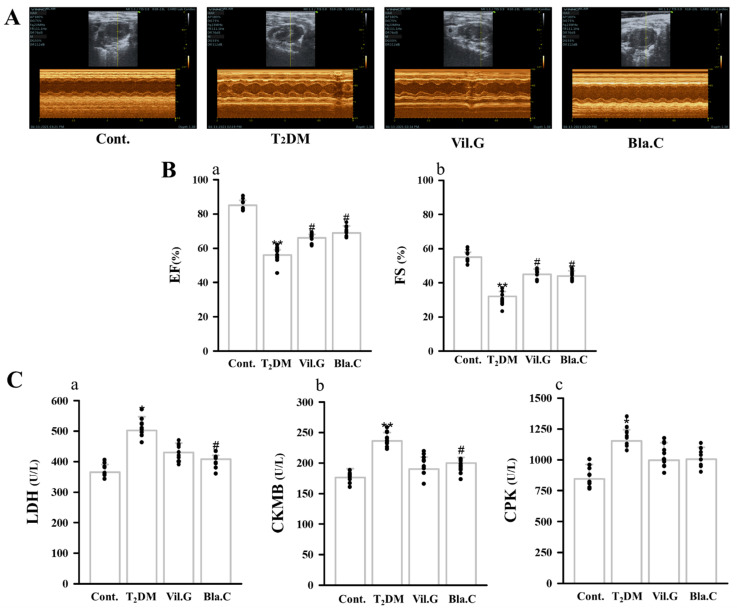
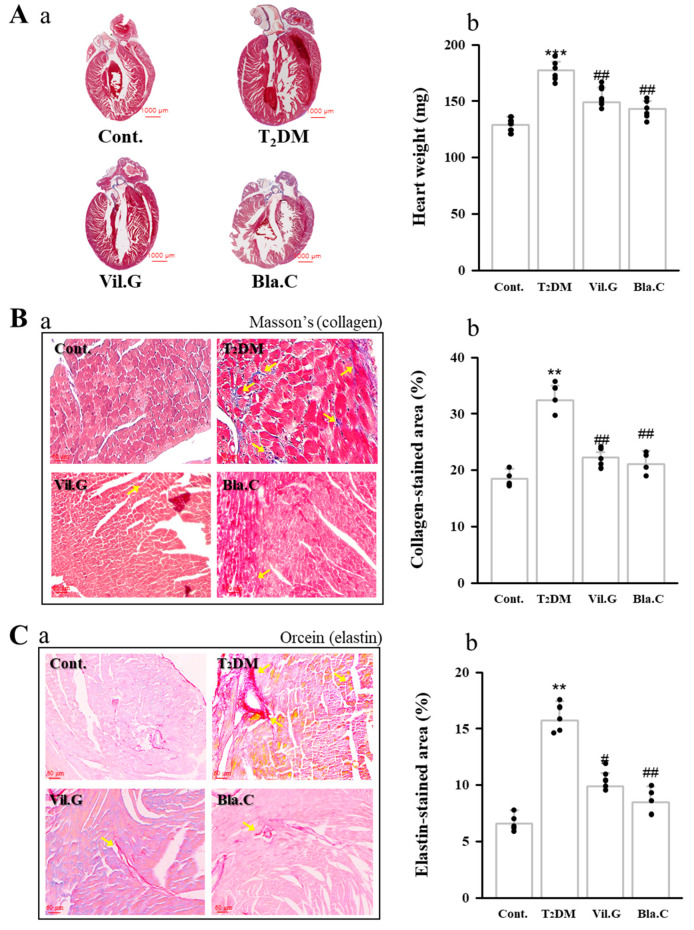
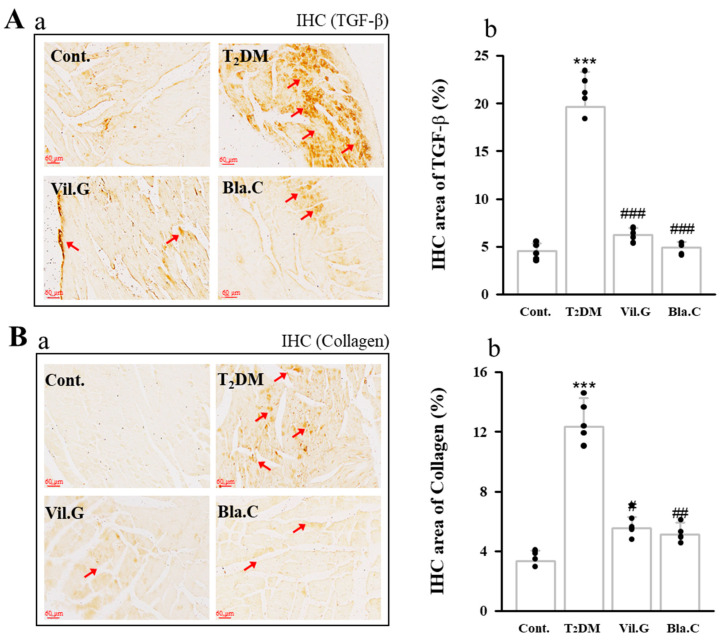
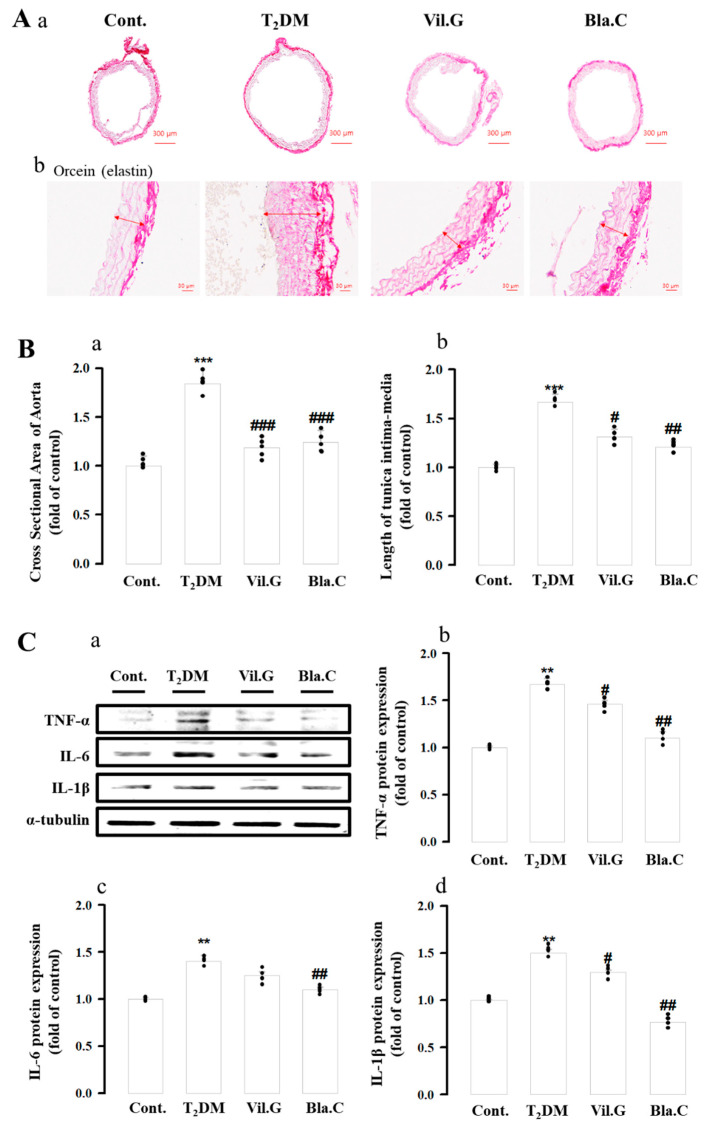
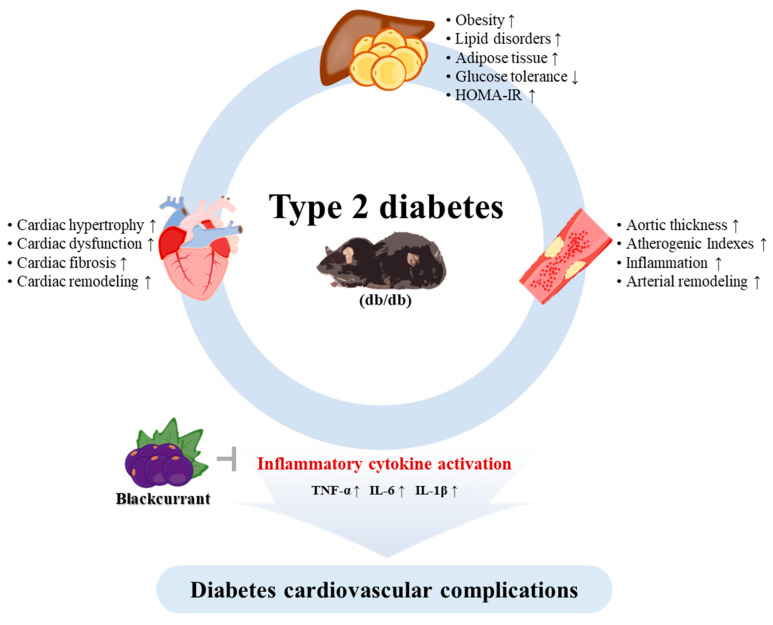
Diabetic cardiovascular dysfunction is a representative complication of diabetes. Inflammation associated with the onset and exacerbation of type 2 diabetes mellitus (T2DM) is an essential factor in the pathogenesis of diabetic cardiovascular complications. Diabetes-induced myocardial dysfunction is characterized by myocardial fibrosis, which includes structural heart changes, myocardial cell death, and extracellular matrix protein accumulation. The mice groups in this study were divided as follows: Cont, control (db/m mice); T2DM, type 2 diabetes mellitus mice (db/db mice); Vil.G, db/db + vildagliptin 50 mg/kg/day, positive control, dipeptidyl peptidase-4 (DPP-4) inhibitor; Bla.C, db/db + blackcurrant 200 mg/kg/day. In this study, Bla.C treatment significantly improved the homeostatic model evaluation of glucose, insulin, and insulin resistance (HOMA-IR) indices and diabetic blood markers such as HbA1c in T2DM mice. In addition, Bla.C improved cardiac function markers and cardiac thickening through echocardiography. Bla.C reduced the expression of fibrosis biomarkers, elastin and type IV collagen, in the left ventricle of a diabetic cardiopathy model. Bla.C also inhibited TD2M-induced elevated levels of inflammatory cytokines in cardiac tissue (IL-6, IL-1β, TNF-α, and TGF-β). Thus, Bla.C significantly improved cardiac inflammation and cardiovascular fibrosis and dysfunction by blocking inflammatory cytokine activation signals. This showed that Bla.C treatment could ameliorate diabetes-induced cardiovascular complications in T2DM mice. These results provide evidence that Bla.C extract has a significant effect on the prevention of cardiovascular fibrosis, inflammation, and consequent diabetes-induced cardiovascular complications, directly or indirectly, by improving blood glucose profile.

Keywords: blackcurrant; cardiovascular; diabetic cardiomyopathy; inflammation; type 2 diabetes mellitus.


Conflict of interest statement

The authors declare they have no conflict of interest.

Figures

Figure 1
Figure 1
High−performance liquid chromatography (HPLC) chromatograms of quercetin-3-O-glucuronide from blackcurrant extract (detection at 330 nm). Standard compounds: delphindin-3-O-glucoside (RT = 19.7) (A); delphinidin-3-O-rutinoside (RT = 22.9) (B); cyanidin-3-O-glucoside (RT = 25.5) (C); cyanidin-3-O-rutinoside (RT = 29.3) (D). Blackcurrant extract (E).
Figure 2
Figure 2
Effect of blackcurrant treatment on the changes in body weight and epididymal fat pad in type 2 diabetes mellitus mice (T2DM mice). Representative image of visceral fat distribution for each mice group (Aa). Changes in body weight ((Ab), n = 8 per group). Integral area under the curve (AUC, (Ac)). Representative microscope images of Oil Red O staining of epididymal fat pad ((Ba), n = 3 per group). Bottom panel indicates the weight, area, and size (BbBd) of adipose cells. BW, body weight; EFPW, epididymal fat pad weight; Cont, control (db/m mice); T2DM, type 2 diabetes mellitus mice (db/db mice); Vil.G, db/db + vildagliptin 50 mg/kg/day, positive control, dipeptidyl peptidase-4 (DPP-4) inhibitor; Bla.C, db/db + blackcurrant 200 mg/kg/day. Data are shown as mean ± S.E. *** p < 0.001 vs. Cont.; # p < 0.05, ## p < 0.01, ### p < 0.001 vs. T2DM.
Figure 3
Figure 3
Hematological changes upon blackcurrant treatment in type 2 diabetes mellitus mice (T2DM mice). Measurements of insulin (Aa), insulin/glucose ratio (Ab), and HOMA-IR (Ac) in plasma. Oral administration of 2 mg/kg glucose for glucose tolerance test (OGTT, (Ba)). Glucose tolerance test expressed as area under curve (Bb). Hemoglobin A1c (HbA1c) test for diabetes (Bc). OGTT, oral glucose tolerance test; HbA1c, hemoglobin A1c or glycated hemoglobin; HOMA-IR, homeostatic model assessment for insulin resistance. Cont, control (db/m mice); T2DM, type 2 diabetes mellitus mice (db/db mice); Vil.G, db/db + vildagliptin 50 mg/kg/day, positive control, dipeptidyl peptidase-4 (DPP-4) inhibitor; Bla.C, db/db + blackcurrant 200 mg/kg/day. Data are shown as mean ± S.E. (n = 8 per group) *** p < 0.001 vs. Cont.; # p < 0.05, ## p < 0.01, ### p < 0.001 vs. T2DM.
Figure 4
Figure 4
Effects of blackcurrant on hepatic histopathology and function in type 2 diabetes mellitus mice (T2DM mice). A representative photograph of the liver observed with the naked eye (Aa). Liver weight/body weight ratio (Ab) and liver triglyceride levels (Ac) of type 2 diabetic mice. Representative images of liver tissue stained with Oil Red O (B) and Orcein stain (C) to confirm histopathological changes (n = 3 per group). Yellow arrows indicate the location of lipids (Ba) and elastic fibers (Ca). Graphs quantifying the lipid-stained area (Bb) and elastin-stained area (Cb). Graphic of serum triglyceride (Da), ALT (Db), and AST (Dc) plasma levels in db/db mice (n = 8 per group) Cont, control (db/m mice); T2DM, type 2 diabetes mellitus mice; Vil.G, T2DM + vildagliptin 50 mg/kg/day, positive control, dipeptidyl peptidase-4 (DPP-4) inhibitor; Bla.C, T2DM + blackcurrant 200 mg/kg/day; AST, aspartate aminotransferase; ALT, alanine aminotransferase. Data are shown as mean ± S.E. * p < 0.05, *** p < 0.001 vs. Cont.; # p < 0.05, ## p < 0.01, ### p < 0.001 vs. T2DM.
Figure 5
Figure 5
Effect of blackcurrant on left ventricle (LV) remodeling in type 2 diabetes mellitus mice (T2DM mice). Representative echocardiography images (M-mode) for each group (A). Changes of cardiac function of EF (Ba) and FS (Bb) were measured echocardiography in each group (n = 8 per group). Changes in plasma of the cardiac biomarkers LDH (Ca), CKMB (Cb), and CPK (Cc) (n = 8 per group). EF, ejection fraction; FS, fractional shortening; LDH, lactate dehydrogenase; CKMB, creatine kinase MB isoenzyme; CPK, creatine phosphokinase; Cont, control (db/m mice); T2DM, type 2 diabetes mellitus mice (db/db mice); Vil.G, db/db + vildagliptin 50 mg/kg/day, positive control, dipeptidyl peptidase-4 (DPP-4) inhibitor; Bla.C, db/db + blackcurrant 200 mg/kg/day. Data are shown as mean ± S.E. * p < 0.05 and ** p < 0.01 vs. Cont.; # p < 0.05 vs. T2DM.
Figure 6
Figure 6
Effects of blackcurrant on diabetic cardiomyopathy in type 2 diabetes mellitus mice (T2DM mice). Blackcurrant attenuates hypertrophy (A) and fibrosis (B,C) of myocytes in T2DM mice. Full size image (Aa) weight graph (Ab) the heart to confirm cardiac hypertrophy. Representative images of collagen with Masson’s trichrome stain (Ba) and elastic fibers with Orcein stain (Ca). Yellow arrows indicate the location of fibrosis of collagen fibers (B) and elastic fibers (C) in the left ventricle. Graphs quantifying the collagen-stained area (Bb) and elastin-stained area (Cb). Cont, control (db/m mice); T2DM, type 2 diabetes mellitus mice (db/db mice); Vil.G, db/db+vildagliptin 50 mg/kg/day, positive control, dipeptidyl peptidase-4 (DPP-4) inhibitor; Bla.C, db/db+blackcurrant 200 mg/kg/day. Data are shown as mean ± S.E. ** p < 0.01 and *** p < 0.001 vs. Cont.; # p < 0.05 and ## p < 0.01 vs. T2DM.
Figure 7
Figure 7
Effects of blackcurrant on diabetic cardiomyopathy in type 2 diabetes mellitus mice (T2DM mice). The expression levels of TGF-β (Aa) and collagen (Ba) were confirmed in T2DM mice cardiac tissue slides using immunohistochemistry (IHC) staining in T2DM (magnification 400×, n = 3 per group). Red arrows indicate the location of TGF-β (D) and collagen IV (D) expressed by IHC in left ventricle. Graphs quantifying the IHC-stained expression area of TGF-β (Ab) and IHC-stained expression area of collagen (Bb). Cont, control (db/m mice); T2DM, type 2 diabetes mellitus mice (db/db mice); Vil.G, db/db + vildagliptin 50 mg/kg/day, positive control, dipeptidyl peptidase-4 (DPP-4) inhibitor; Bla.C, db/db + blackcurrant 200 mg/kg/day; TGF-β, transforming growth factor-β. Data are shown as mean ± S.E. *** p < 0.001 vs. Cont.; # p < 0.05, ## p < 0.01, ### p < 0.001 vs. T2DM.
Figure 8
Figure 8
Effects of blackcurrant on diabetic cardiomyopathy in type 2 diabetes mellitus mice (T2DM mice). Blackcurrant attenuates vascular inflammation and fibrosis of thoracic aorta in T2DM mice. Representative images of Orcein staining in T2DM thoracic aortic tissue ((Aa), magnification × 40; (Ab), magnification × 400, n = 4 per group). Graph of the effect of Bla.C on the change in cross-sectional area (Ba) and length of tunica intima–media (Bb) of the thoracic aorta in T2MD mice. The expression of inflammatory cytokines in the thoracic aorta was determined by Western blot analysis (CaCd) (n = 4 per group). Cont, control (db/m mice); T2DM, type 2 diabetes mellitus mice (db/db mice); Vil.G, db/db + vildagliptin 50 mg/kg/day, positive control, dipeptidyl peptidase-4 (DPP-4) inhibitor; Bla.C, db/db + blackcurrant 200 mg/kg/day; TNF-α, tumor necrosis factor alpha; IL-6, interleukin-6; IL-1β, interleukin-1β. Data are shown as mean ± S.E. ** p < 0.01, *** p < 0.001 vs. Cont.; # p < 0.05, ## p < 0.01, ### p < 0.001 vs. T2DM.
Figure 9
Figure 9
Schematic diagram of the effect of blackcurrant in improving diabetes cardiovascular complications. db/db, type 2 diabetes mellitus mice; TNF-α, tumor necrosis factor alpha; IL-6, interleukin-6; IL-1β, interleukin-1β; HOMA-IR, homeostatic model assessment for insulin resistance; ↑, increase; ↓, decrease.

References

    1. King A.J. The use of animal models in diabetes research. Br. J. Pharmacol. 2012;166:877–894. doi: 10.1111/j.1476-5381.2012.01911.x. - DOI - PMC - PubMed
    1. Meléndez G.C., McLarty J.L., Levick S., Du Y., Janicki J.S., Brower G. Interleukin 6 Mediates Myocardial Fibrosis, Concentric Hypertrophy, and Diastolic Dysfunction in Rats. Hypertension. 2010;56:225–231. doi: 10.1161/HYPERTENSIONAHA.109.148635. - DOI - PMC - PubMed
    1. Bertoni A.G., Hundley W.G., Massing M.W., Bonds D.E., Burke G.L., Goff D.C. Heart Failure Prevalence, Incidence, and Mortality in the Elderly with Diabetes. Diabetes Care. 2004;27:699–703. doi: 10.2337/diacare.27.3.699. - DOI - PubMed
    1. Amos A.F., Mccarty D.J., Zimmet P. The rising global burden of diabetes and its complications: Estimates and projections to the year 2010. Diabet. Med. 1997;14:S7–S85. doi: 10.1002/(SICI)1096-9136(199712)14:5+<S7::AID-DIA522>3.0.CO;2-R. - DOI - PubMed
    1. Boudina S., Abel E.D. Diabetic Cardiomyopathy Revisited. Circulation. 2007;115:3213–3223. doi: 10.1161/CIRCULATIONAHA.106.679597. - DOI - PubMed

MeSH terms