. 2021 Nov 27;9(1):235.
doi: 10.1186/s40168-021-01181-z.

Regulation of blood-brain barrier integrity by microbiome-associated methylamines and cognition by trimethylamine N-oxide

Affiliations

Regulation of blood-brain barrier integrity by microbiome-associated methylamines and cognition by trimethylamine N-oxide

Lesley Hoyles et al. Microbiome. .

Abstract

Background: Communication between the gut microbiota and the brain is primarily mediated via soluble microbe-derived metabolites, but the details of this pathway remain poorly defined. Methylamines produced by microbial metabolism of dietary choline and L-carnitine have received attention due to their proposed association with vascular disease, but their effects upon the cerebrovascular circulation have hitherto not been studied.

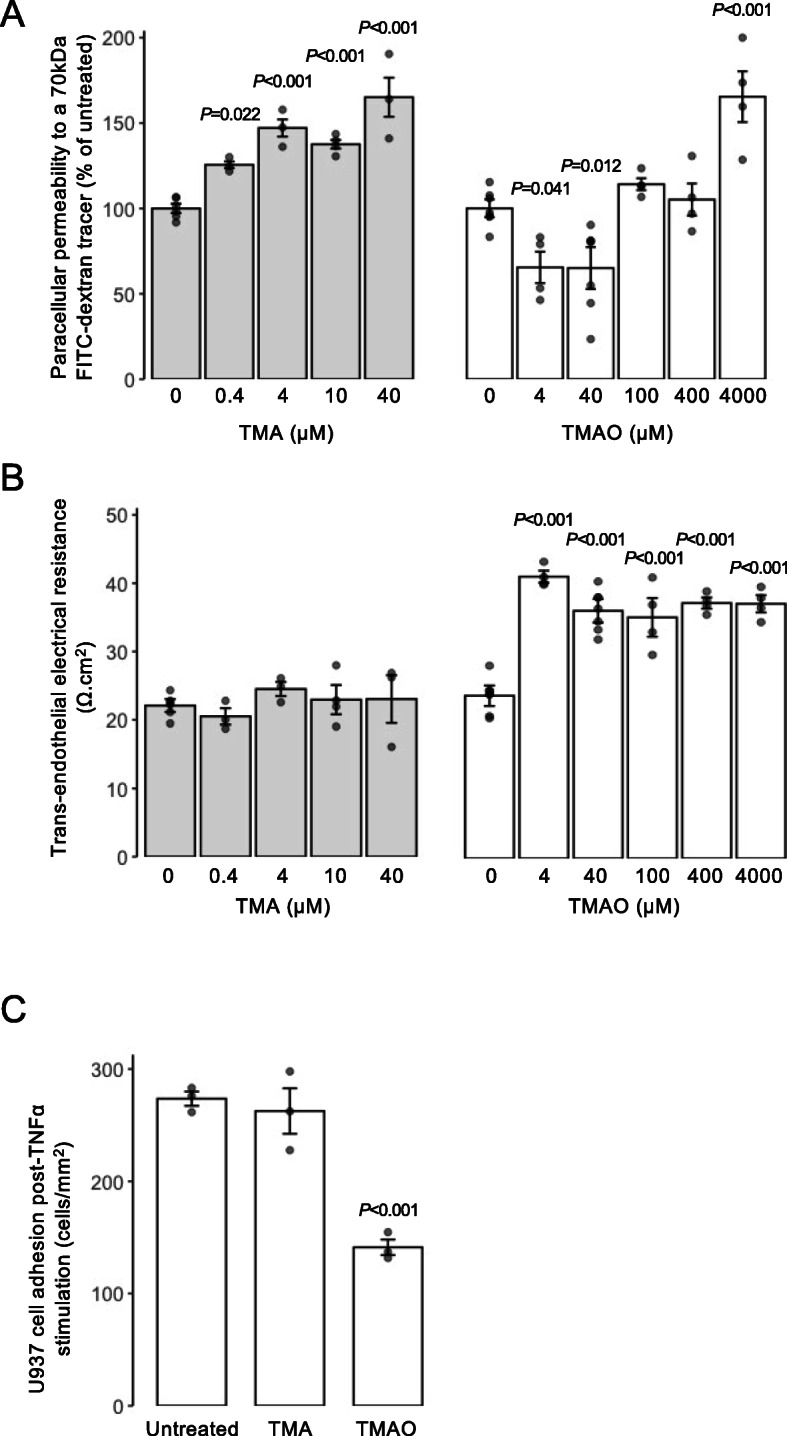
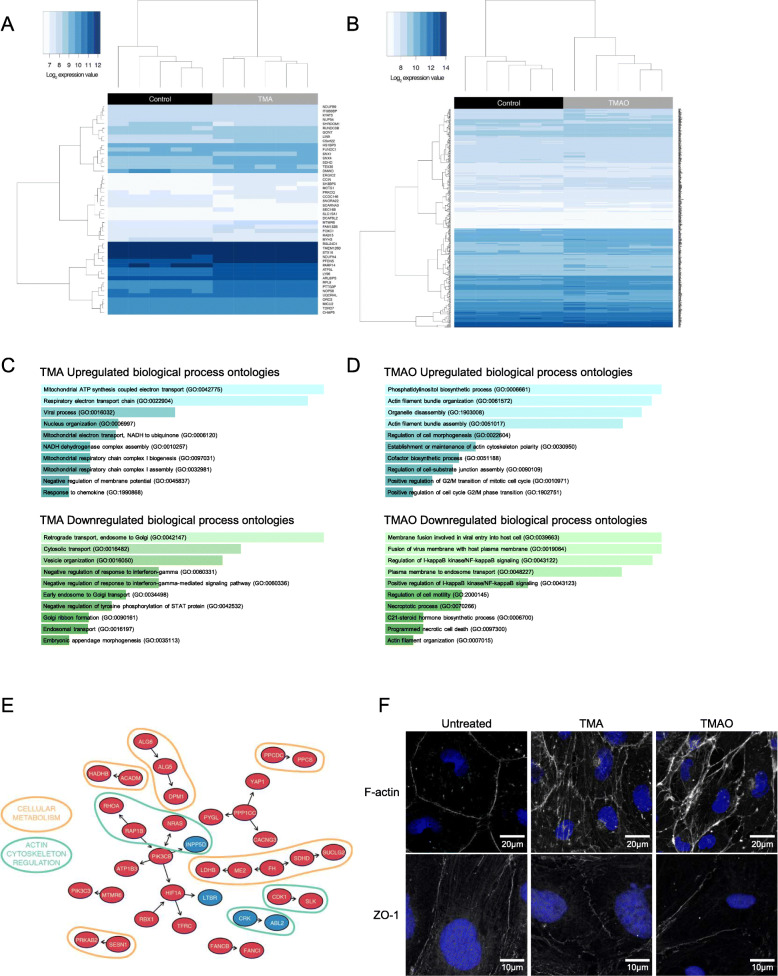
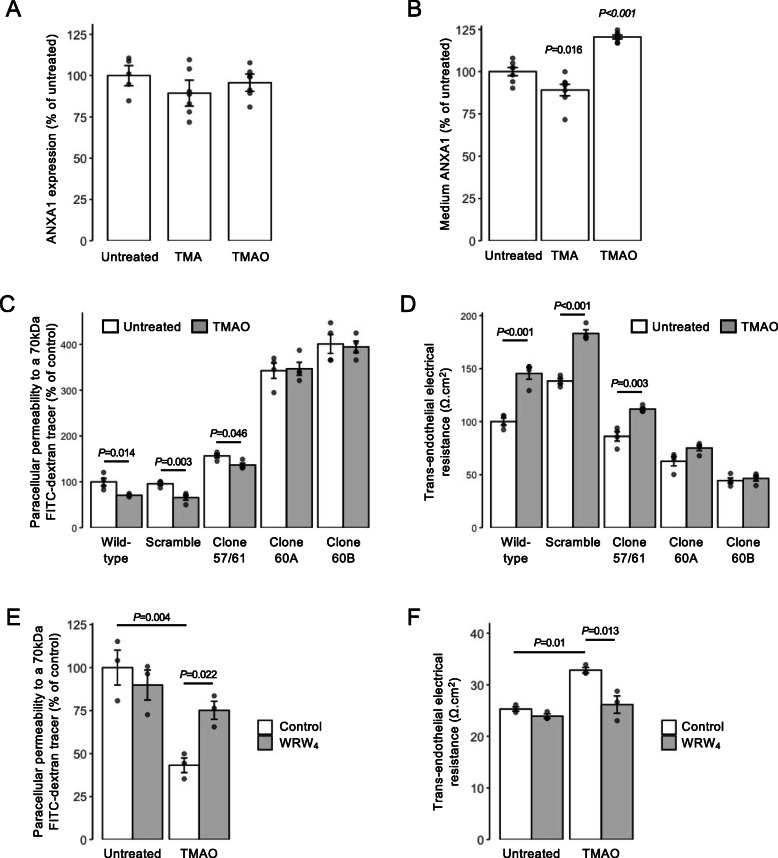
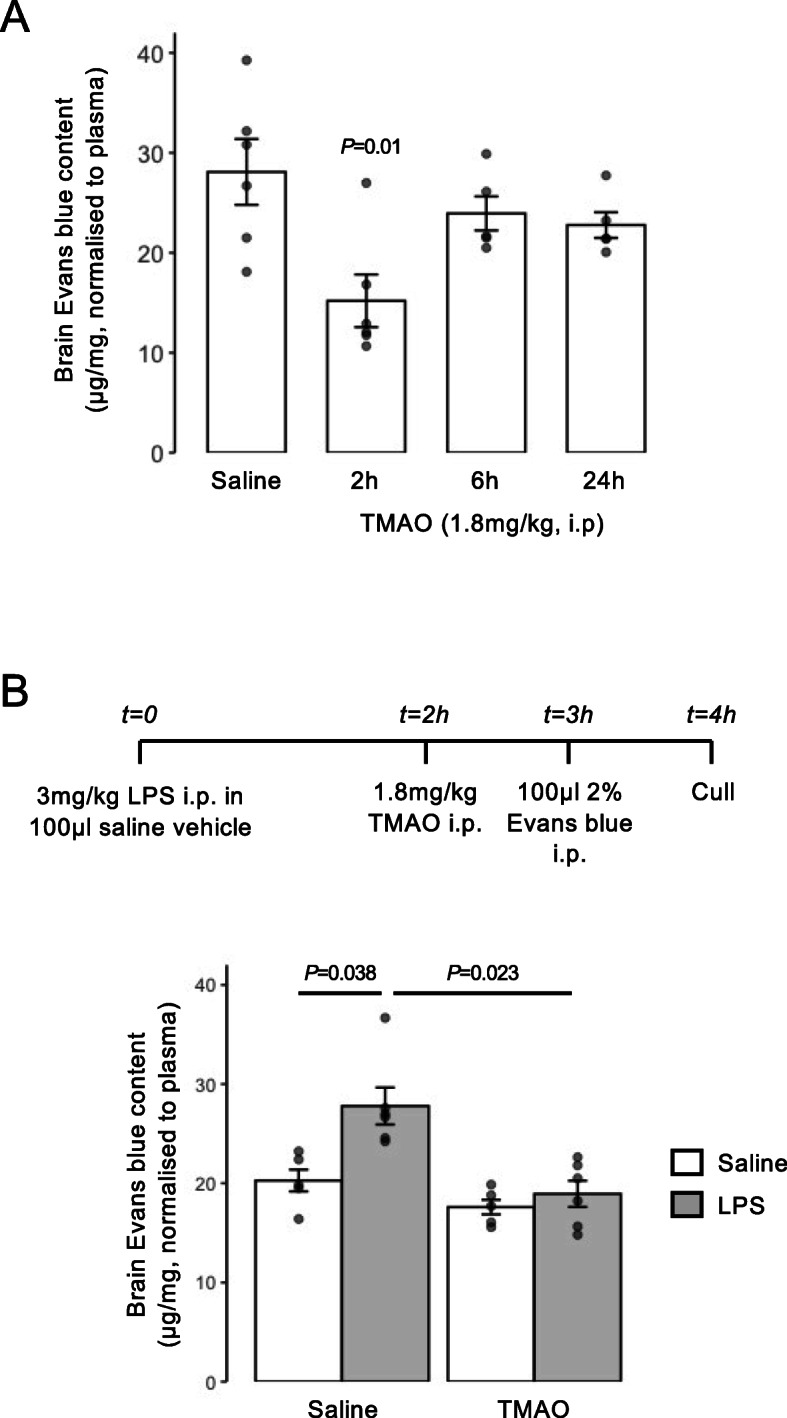
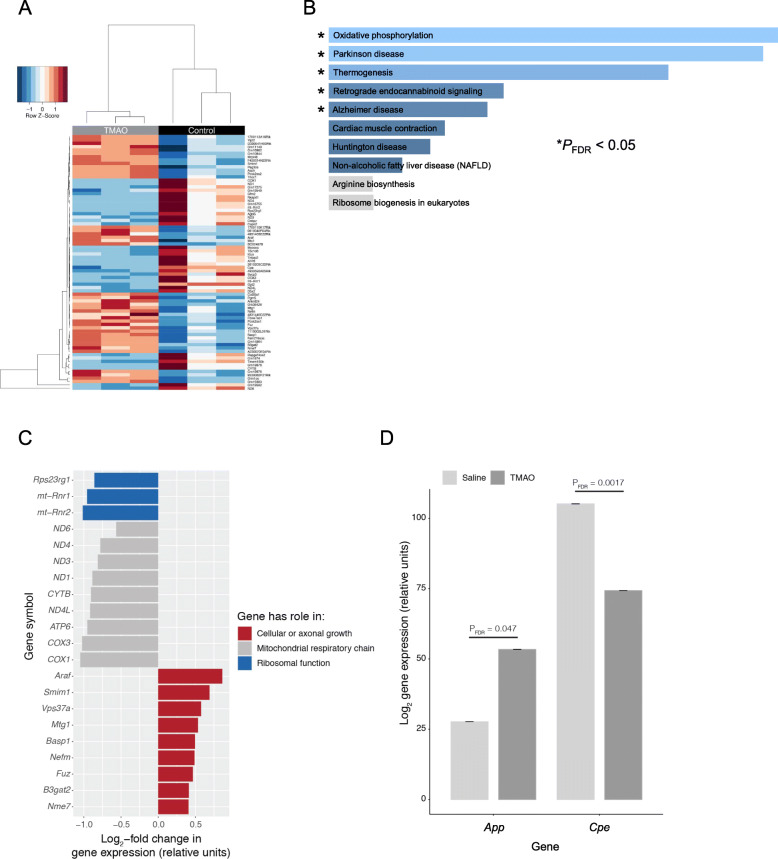
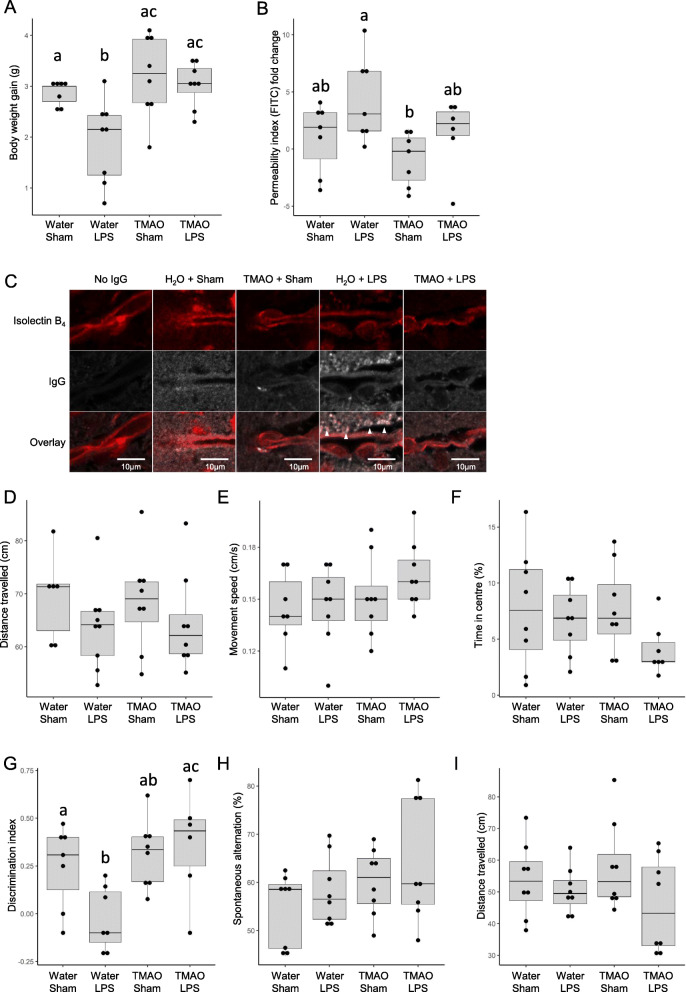
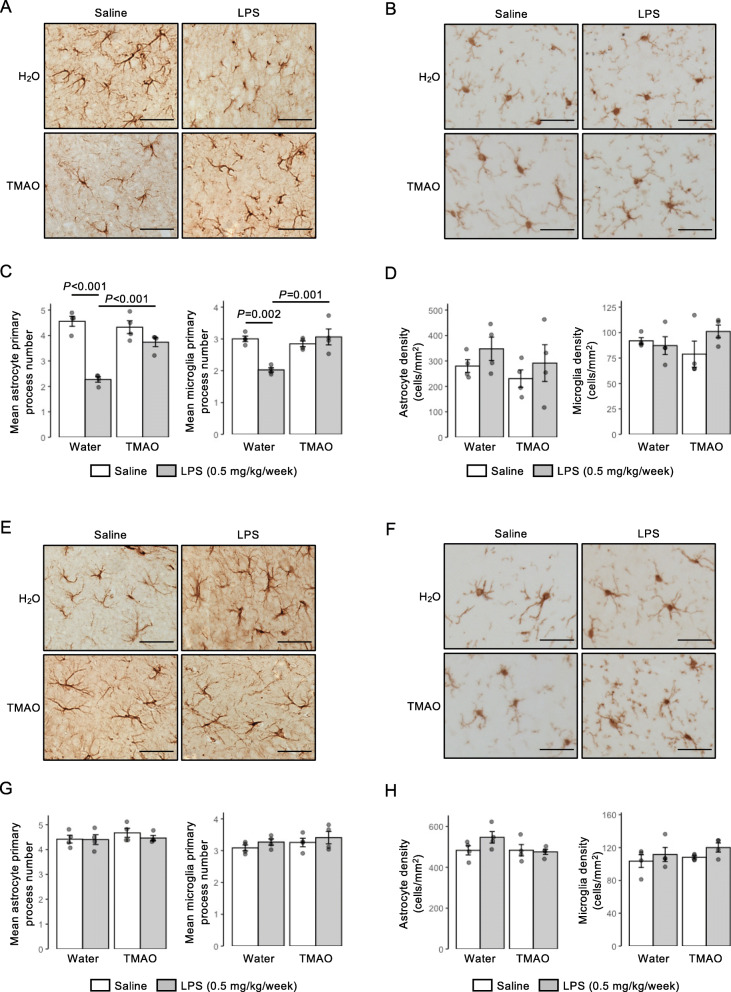
Results: Here, we use an integrated in vitro/in vivo approach to show that physiologically relevant concentrations of the dietary methylamine trimethylamine N-oxide (TMAO) enhanced blood-brain barrier (BBB) integrity and protected it from inflammatory insult, acting through the tight junction regulator annexin A1. In contrast, the TMAO precursor trimethylamine (TMA) impaired BBB function and disrupted tight junction integrity. Moreover, we show that long-term exposure to TMAO protects murine cognitive function from inflammatory challenge, acting to limit astrocyte and microglial reactivity in a brain region-specific manner.

Conclusion: Our findings demonstrate the mechanisms through which microbiome-associated methylamines directly interact with the mammalian BBB, with consequences for cerebrovascular and cognitive function. Video abstract.

Keywords: Blood–brain barrier; Cognition; Trimethylamine; Trimethylamine N-oxide.


Conflict of interest statement

The authors declare that they have no competing interests.

Figures

Fig. 1
Fig. 1
Effects of TMAO and TMA on the integrity of hCMEC/D3 cell monolayers. A Assessment of paracellular permeability of hCMEC/D3 monolayers to a 70-kDa FITC-dextran tracer following treatment for 24 h with varying doses of TMA (0.4–40 μM) or TMAO (4–4000 μM). Data are expressed as mean ± s.e.m., n = 4 independent experiments. B Assessment of TEER of hCMEC/D3 monolayers to a 70-kDa FITC-dextran tracer following treatment for 24 h with varying doses of TMA (0.4–40 μM) or TMAO (4–4000 μM). Data are expressed as mean ± s.e.m., n = 4 independent experiments. C Adhesion of U937 monocytic cells to TNFα-stimulated hCMEC/D3 monolayers (10 ng/ml, 16 h) that had been treated or not for 24 h with 0.4 μM TMA or 40 μM TMAO. Data are expressed as mean ± s.e.m., n = 3 independent experiments
Fig. 2
Fig. 2
Effects of TMA and TMAO on gene expression in hCMEC/D3 cells. A Heatmap showing expression of the 49 genes found to be significantly (PFDR<0.1) differentially expressed upon exposure of hCMEC/D3 cells to 0.4 μM TMA (n = 5 per group). B Heatmap showing expression of the 440 genes found to be significantly (PFDR<0.1) differentially expressed upon exposure of hCMEC/D3 cells to 40 μM TMAO (n = 5 per group). C Biological processes associated with genes found to be significantly upregulated (n = 39) or downregulated (n = 10) upon exposure of cells to TMA. D Biological processes of genes found to be significantly upregulated (n = 341) or downregulated (n = 99) upon exposure of cells to TMAO. Images in (C, D) shown based on Enrichr P value ranking from GO analysis. E Topological analysis of the KEGG networks associated with the 440 genes whose expression was significantly affected upon exposure of cells to TMAO (blue, significantly downregulated; red, significantly upregulated); genes of similar cellular role are highlighted. F Confocal microscopic analysis of expression of fibrillar actin (F-actin) and the tight junction component zonula occludens-1 (ZO-1) in hCMEC/D3 cells following treatment for 24 h with 0.4 μM TMA or 40 μM TMAO. Images are representative of at least three independent experiments
Fig. 3
Fig. 3
Annexin A1 (ANXA1) signalling mediates effects of TMAO on hCMEC/D3 cells. A Total cellular expression of ANXA1 in hCMEC/D3 cells treated for 24 h with 0.4 μM TMA or 40 μM TMAO. Data are expressed as mean ± s.e.m., n = 5–7 independent experiments. B Medium ANXA1 content of hCMEC/D3 monolayers treated for 24 h with 0.4 μM TMA or 40 μM TMAO. Data are expressed as mean ± s.e.m., n = 7 independent experiments. C Assessment of paracellular permeability of monolayers of wild-type hCMEC/D3 cells, or hCMEC/D3 cells stably transfected with either a scramble shRNA sequence, or one of three shRNA sequences targeting ANXA1 (clone 57/61—20.6 ± 5.6% reduction, clone 60A—47.3 ± 1.5% reduction, clone 60B—67.5 ± 1.1% reduction) to a 70-kDa FITC-dextran tracer following treatment for 24 h with 40 μM TMAO. Data are expressed as mean ± s.e.m., n = 4 independent experiments. D Assessment of TEER of monolayers of wild-type hCMEC/D3 cells, or hCMEC/D3 cells stably transfected with either a scramble shRNA sequence, or one of three shRNA sequences targeting ANXA1 (clone 57/61—20.6 ± 5.6% reduction, clone 60A—47.3 ± 1.5% reduction, clone 60B—67.5 ± 1.1% reduction) following treatment for 24 h with 40 μM TMAO. Data are expressed as mean ± s.e.m., n = 4 independent experiments. E Assessment of paracellular permeability of hCMEC/D3 cells to a 70-kDa FITC-dextran tracer following treatment for 24 h with 40 μM TMAO, with or without 10 min pre-treatment with the FPR2 antagonist WRW4 (10 μM). Data are expressed as mean ± s.e.m., n = 3 independent experiments. F Assessment of TEER of hCMEC/D3 cells following treatment for 24 h with 40 μM TMAO, with or without 10 min pre-treatment with the FPR2 antagonist WRW4 (10 μM). Data are expressed as mean ± s.e.m., n = 3 independent experiments
Fig. 4
Fig. 4
Acute treatment with TMAO promotes BBB integrity in vivo. A Extravasation of Evans blue dye into brain parenchyma over a 1-h period in 2-month-old male C57Bl/6J mice following i.p. injection of 1.8 mg/kg TMAO for 2 h, 6 h, or 24 h vs. a saline-injected control. Data are normalised to plasma Evans blue content and are expressed as mean ± s.e.m., n = 5–6 mice. B Extravasation of Evans blue dye into brain parenchyma over a 1-h period in 2-month-old male C57Bl/6J mice following i.p. injection of saline or E. coli O111:B4 LPS (3 mg/kg) with or without subsequent i.p. injection of 1.8 mg/kg TMAO according to the schedule shown. Data are normalised to plasma Evans blue content and are expressed as mean ± s.e.m., n = 4–6 mice
Fig. 5
Fig. 5
Acute exposure of mice to TMAO significantly alters the whole brain transcriptome. A Heatmap showing expression of the 76 genes found to be significantly (PFDR < 0.1) differentially expressed in the mouse brain after 2 h exposure to 1.8 mg/kg TMAO (n = 3 per group). Data were scaled by row. B Over-representation analysis (Enrichr) showing KEGG pathways associated with the 76 genes. C Comparative analysis of significantly differentially expressed genes identified groupings associated with distinct biological functions. D Among the 197 BBB-specific genes identified in the data set, only App and Cpe were significantly (PFDR < 0.1) differentially expressed in the mouse brain after 2 h exposure to TMAO. Data are shown as mean ± s.d, n = 3 per group. Individual data points are not shown due to the negligible values of the s.d
Fig. 6
Fig. 6
Effect of long-term TMAO exposure on BBB integrity and cognitive function of mice in conjunction with sub-acute inflammatory challenge. A Body weight gain in mice treated with TMAO through their drinking water (0.5 mg/ml) over 2 months, combined with a chronic low-dose administration of LPS (0.5 mg/kg/week, i.p.). Data are expressed as mean ± s.e.m., n = 8 mice, columns with different letters are significantly different at P < 0.05. B Cerebellar permeability index to sodium fluorescein 2h following administration in animals previously treated with TMAO through their drinking water (0.5 mg/ml) over 2 months, combined with a chronic low-dose administration of LPS (0.5 mg/kg/week, i.p.). Data are expressed as mean ± s.e.m., n = 8 mice, columns with different letters are significantly different at P < 0.05. C Typical confocal microscopic images of perivascular IgG deposition in male C57Bl/6J mice treated with TMAO through their drinking water (0.5 mg/ml) over 2 months, combined with a chronic low-dose administration of LPS (0.5 mg/kg/week, i.p.). Griffonia simplicifolia isolectin B4 (red) defines endothelial cells, areas of IgG deposition (white) are highlighted by arrow heads. D Distance travelled, E movement speed and F percentage of time in the centre as measured in the OFT in animals previously treated with TMAO through their drinking water (0.5 mg/ml) over 2 months, combined with a chronic low-dose administration of LPS (0.5 mg/kg/week, i.p.). Data are expressed as mean ± s.e.m., n = 8 mice. G Novel object discrimination index, calculated as described in Methods, of animals previously treated with TMAO through their drinking water (0.5 mg/ml) over 2 months, combined with a chronic low-dose administration of LPS (0.5 mg/kg/week, i.p.). Data are expressed as mean ± s.e.m., n = 8 mice, columns with different letters are significantly different at P < 0.05. H Percentage of spontaneous alternation and I total distance travelled in the Y-maze test for animals previously treated with TMAO through their drinking water (0.5 mg/ml) over 2 months, combined with a chronic low-dose administration of LPS (0.5 mg/kg/week, i.p.). Data are expressed as mean ± s.e.m., n = 8 mice
Fig. 7
Fig. 7
Effects of long-term TMAO exposure upon astrocytes and microglia in the entorhinal cortex and hippocampus of mice in conjunction with sub-acute inflammatory challenge. A Typical immunohistochemical staining of GFAP+ astrocytes in the entorhinal cortex of mice previously treated with TMAO through their drinking water (0.5 mg/ml) over 2 months, combined with a chronic low-dose administration of LPS (0.5 mg/kg/week, i.p.). Scale bar = 40 μm. B Typical immunohistochemical staining of Iba1+ microglia in the entorhinal cortex of mice previously treated with TMAO through their drinking water (0.5 mg/ml) over 2 months, combined with a chronic low-dose administration of LPS (0.5 mg/kg/week, i.p.), scale bar = 40 μm. C Astrocyte and microglial primary process number and in the entorhinal cortex of mice previously treated with TMAO through their drinking water (0.5 mg/ml) over 2 months, combined with a chronic low-dose administration of LPS (0.5 mg/kg/week, i.p.). Data are expressed as mean ± s.e.m., n = 4 mice. D Astrocyte and microglial density in the entorhinal cortex of mice previously treated with TMAO through their drinking water (0.5 mg/ml) over 2 months, combined with a chronic low-dose administration of LPS (0.5 mg/kg/week, i.p.). Data are expressed as mean ± s.e.m., n = 4 mice. E Typical immunohistochemical staining of GFAP+ astrocytes in the CA1 region of the hippocampus of mice previously treated with TMAO through their drinking water (0.5 mg/ml) over 2 months, combined with a chronic low-dose administration of LPS (0.5 mg/kg/week, i.p.). Scale bar = 40 μm F Typical immunohistochemical staining of Iba1+ microglia in the CA1 region of the hippocampus of mice previously treated with TMAO through their drinking water (0.5 mg/ml) over 2 months, combined with a chronic low-dose administration of LPS (0.5 mg/kg/week, i.p.), scale bar = 40 μm. G Astrocyte and microglial primary process number in the CA1 region of the hippocampus of mice previously treated with TMAO through their drinking water (0.5 mg/ml) over 2 months, combined with a chronic low-dose administration of LPS (0.5 mg/kg/week, i.p.). Data are expressed as mean ± s.e.m., n = 4 mice. H Astrocyte and microglial density in the CA1 region of the hippocampus of mice previously treated with TMAO through their drinking water (0.5 mg/ml) over 2 months, combined with a chronic low-dose administration of LPS (0.5 mg/kg/week, i.p.). Data are expressed as mean ± s.e.m., n = 4 mice

References

    1. Braniste V, Al-Asmakh M, Kowal C, Anuar F, Abbaspour A, Tóth M, et al. The gut microbiota influences blood-brain barrier permeability in mice. Sci Transl Med. 2014;6:263ra158. doi: 10.1126/scitranslmed.3009759. - DOI - PMC - PubMed
    1. Hoyles L, Snelling T, Umlai U-K, Nicholson JK, Carding SR, Glen RC, McArthur S. Microbiome–host systems interactions: protective effects of propionate upon the blood–brain barrier. Microbiome. 2018;6(1):55. doi: 10.1186/s40168-018-0439-y. - DOI - PMC - PubMed
    1. Tang WHW, Hazen SL. Microbiome, trimethylamine N-oxide, and cardiometabolic disease. Transl Res. 2017;179:108–115. doi: 10.1016/j.trsl.2016.07.007. - DOI - PMC - PubMed
    1. Dinicolantonio JJ, McCarty M, Okeefe J. Association of moderately elevated trimethylamine N-oxide with cardiovascular risk: is TMAO serving as a marker for hepatic insulin resistance. Open Heart. 2019;6(1):–e000890. 10.1136/openhrt-2018-000890. - PMC - PubMed
    1. Hoyles L, Jimenez-Pranteda ML, Chilloux J, Brial F, Myridakis A, Aranias T, et al. Metabolic retroconversion of trimethylamine N-oxide and the gut microbiota. Microbiome. 2018;6(1):73. doi: 10.1186/s40168-018-0461-0. - DOI - PMC - PubMed

Publication types

LinkOut - more resources