. 2021 Nov 27:27:e934161.
doi: 10.12659/MSM.934161.

Identifying the Predictive Role of Oxidative Stress Genes in the Prognosis of Glioma Patients

Affiliations

Identifying the Predictive Role of Oxidative Stress Genes in the Prognosis of Glioma Patients

Di Lu et al. Med Sci Monit. .

Abstract

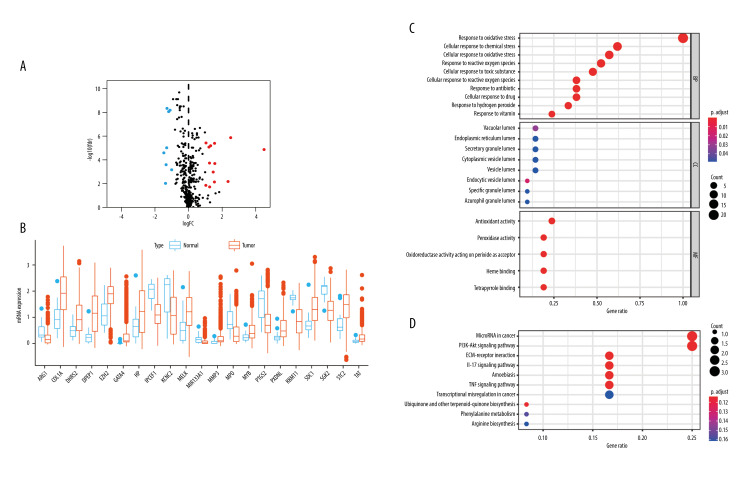
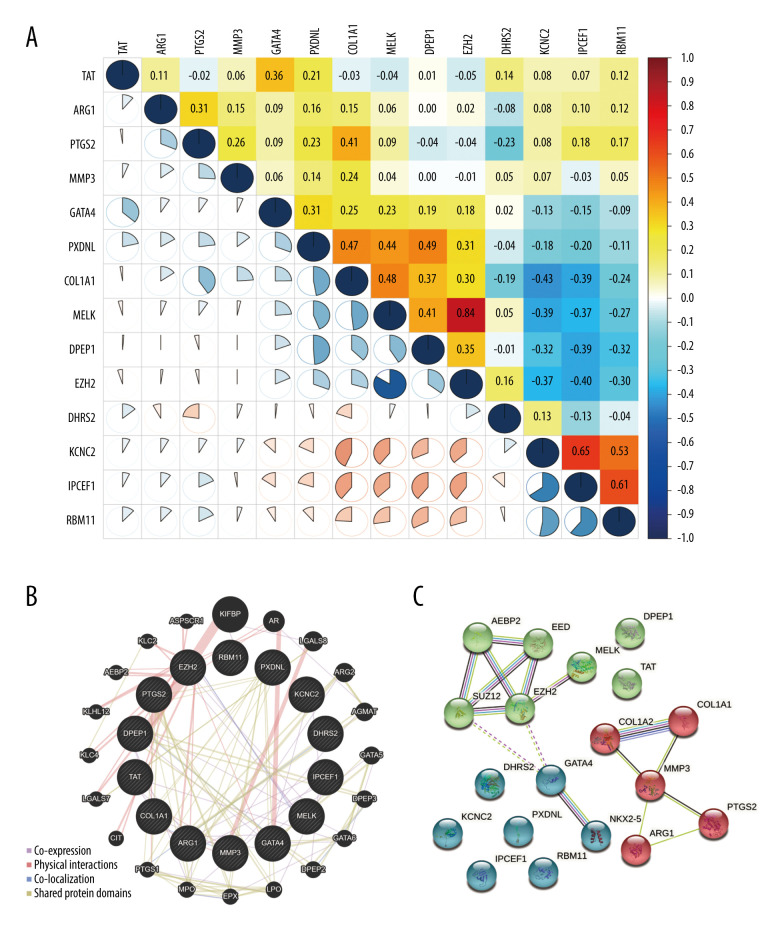
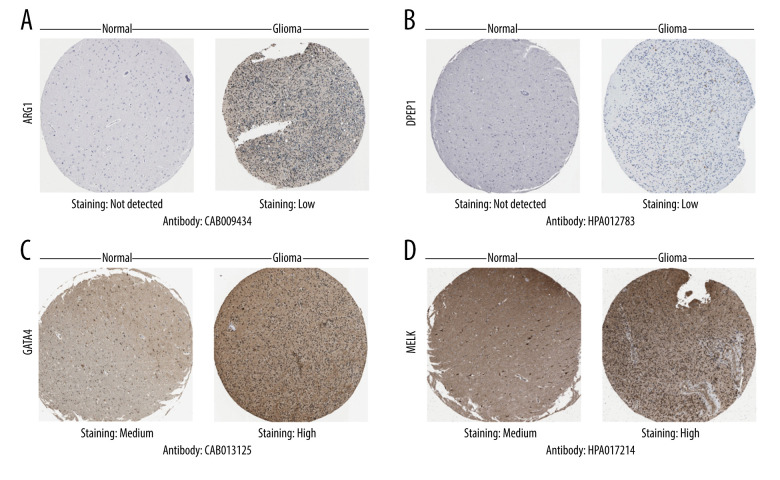
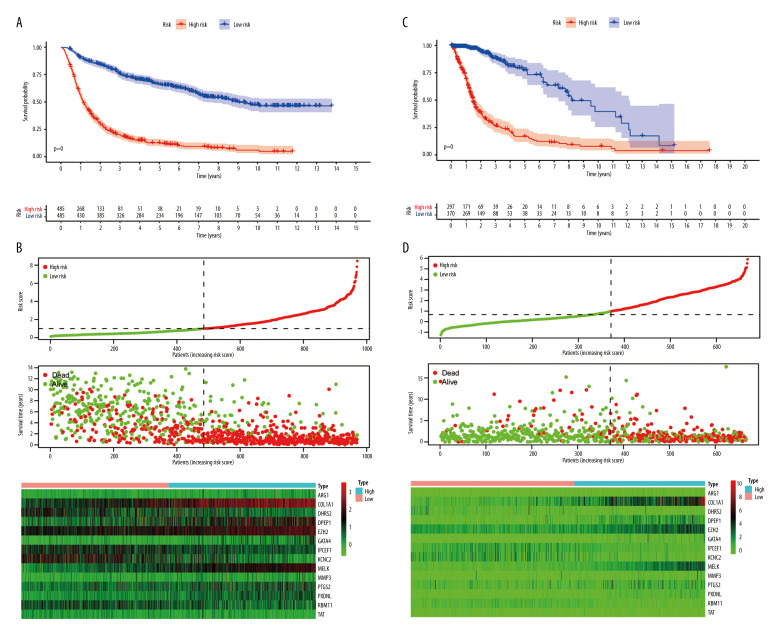
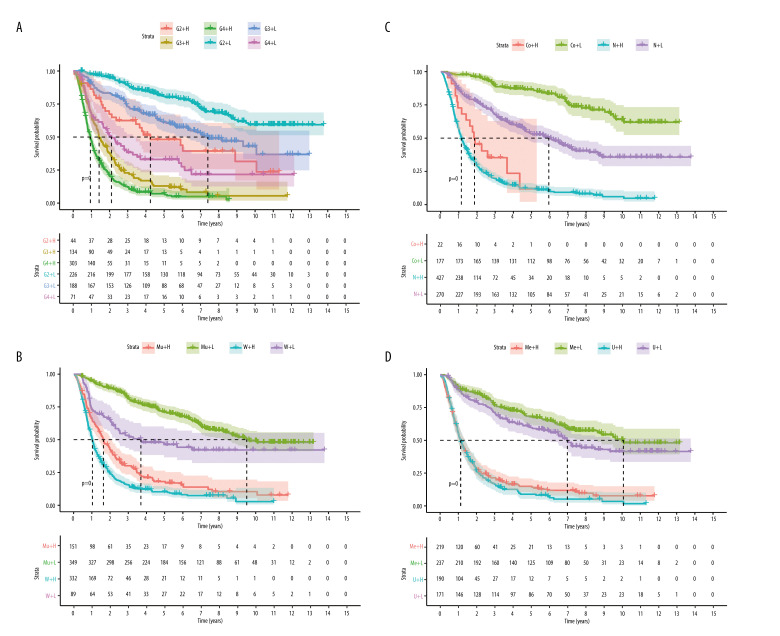
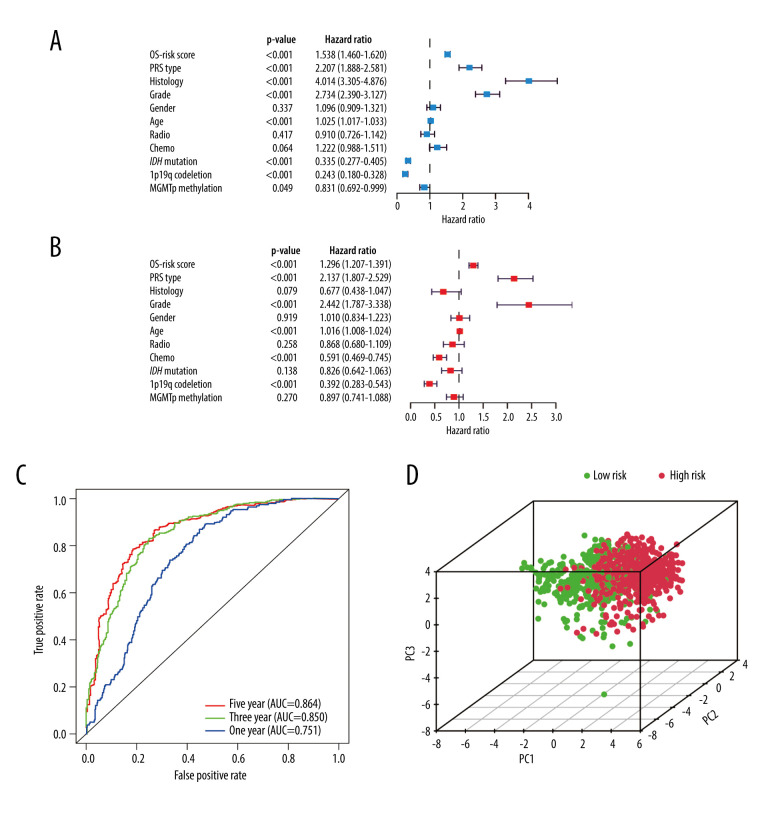
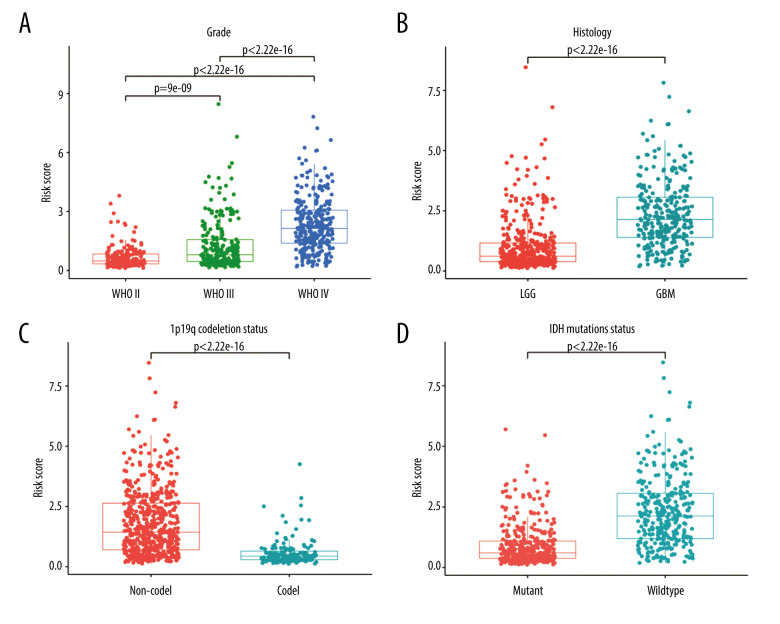
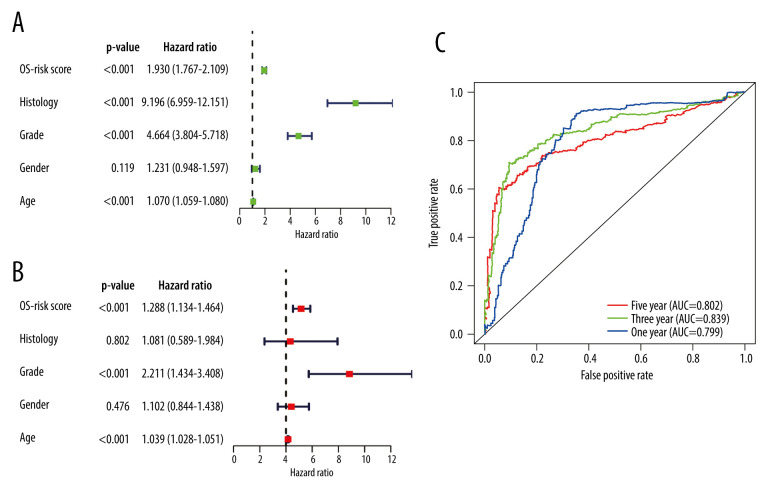
BACKGROUND Gliomas are primary aggressive brain tumors with poor prognoses. Oxidative stress plays a crucial role in the tumorigenesis and drug resistance of gliomas. The aim of the present study was to use integrated bioinformatics analyses to evaluate the prognostic value of oxidative stress-related genes (OSRGs) in glioma. MATERIAL AND METHODS Disease- and prognosis-associated OSRGs were identified using microarray and clinical data from the Chinese Glioma Genome Atlas database. Functional enrichment, gene-gene interaction, protein-protein interaction, and survival analyses were performed in screened OSRGs. The protein expression was validated by the Human Protein Atlas database. A risk score model was constructed and verified through Cox regression, receiver operating characteristic curve, principal component, and stratified analyses. The Cancer Genome Atlas (TCGA) database was used for external validation. A nomogram was constructed to facilitate the clinical application. RESULTS Twenty-one disease-associated and 14 prognosis-associated OSRGs were identified. Enrichment analyses indicated that these signature OSRGs were involved in tumorigenesis and drug resistance of glioma. The risk score model demonstrated a significant difference in overall survival between the high- and low-risk groups. The area under the curve and hazard ratio (1.296) revealed the independent prognostic value of the model. The model exhibited good predictive efficacy in the TCGA cohort. A clinical nomogram was constructed to calculate survival rates in glioma patients at 1, 3, and 5 years. CONCLUSIONS Our comprehensive study indicated that OSRGs were valuable for prognosis prediction in glioma, which provides a novel insight into the relationship between oxidative stress and glioma and a potential therapeutic strategy for glioma patients.


Conflict of interest statement

Conflict of interest: None declared

Figures

Figure 1
Figure 1
Twenty-one disease-associated, oxidative stress-related genes (OSRGs) and functional enrichment analysis. (A) In a volcano map, red indicates genes that are highly expressed, blue indicates genes with lower expression, and black indicates genes for which there is no significant difference in expression. (B) Differences in gene expression in samples from glioma (red bars) and normal tissue (blue bars). (C) The biological process (BP), cellular components (CC), and molecular functions (MFs) of OSRGs in the Gene Ontology analysis. (D) The potential pathways of OSRGs in the Kyoto Encyclopedia of Genes and Genomes analysis. (R Studio, Version 1.2.5042, RStudio, Inc.).
Figure 2
Figure 2
The relationship of prognosis-associated oxidative stress-related genes. (A) Pearson’s correlation analysis. Red indicates high correlation and blue indicates low correlation. (B) Gene interaction network. (C) Protein-protein interaction network. (R Studio, Version 1.2.5042, RStudio, Inc.).
Figure 3
Figure 3
Differential protein expression of oxidative stress-related genes in the Human Protein Atlas database. (A) ARG1 (CAB009434). (B) DPEP1 (HPA012783). (C) GATA4(CAB013125). (D) MELK (HPA017214). Normal: glial cells in normal tissue.
Figure 4
Figure 4
Risk score model construction and external validation. (A) Kaplan-Meier survival curves for overall survival (OS) in the Chinese Glioma Genome Atlas (CGGA) cohort. (B) Risk score, survival status of patients, and heat map of the expression profile for the oxidative stress-related genes (OSRGs) in the CGGA cohort. (C) Kaplan-Meier survival curves for OS in The Cancer Genome Atlas (TCGA) cohort. (D) Risk score, survival status of patients and heat map of the expression profile for the OSRGs in TCGA cohort. (R Studio, Version 1.2.5042, RStudio, Inc.).
Figure 5
Figure 5
Survival analysis of the Chinese Glioma Genome Atlas in different subgroups (H – high risk; L – low risk) (A) Grade (G – grade). (B) IDH mutation status (Mu – IDH mutation; W – wild-type). (C) 1p19q codeletion status (Co – 1p19q codeletion; N – no codeletion). (D) MGMTp methylation status (Me – MGMTp methylation; U – un-methylation). (R Studio, Version 1.2.5042, RStudio, Inc.).
Figure 6
Figure 6
Independent prognostic analysis in the Chinese Glioma Genome Atlas. (A) Univariate Cox regression analysis. (B) Multivariate Cox regression analysis. (C) Receiver operating characteristic curves for predicting 1-, 3-, and 5-year overall survival. (D) Principal component analysis. (R Studio, Version 1.2.5042, RStudio, Inc.).
Figure 7
Figure 7
Stratified analysis of risk scores based on different clinicopathological parameters. (A) Grade. (B) Histology. (C) 1p19q codeletion status. (D) IDH mutation status. (R Studio, Version 1.2.5042, RStudio, Inc.).
Figure 8
Figure 8
Independent prognostic analysis in The Cancer Genome Atlas: (A) Univariate Cox regression analysis. (B) Multivariate Cox regression analysis. (C) Receiver operating characteristic curves for predicting 1-, 3-, and 5-year overall survival. (R Studio, Version 1.2.5042, RStudio, Inc.).
Figure 9
Figure 9
Gene set enrichment analysis (GSEA) results in high-risk groups and a nomogram. (A) GSEA in multiple carcinomas (B) GSEA in multiple cancer-related pathways. (C) Nomogram for predicting 1-, 3- and 5-year survival rates in glioma patients. (R Studio, Version 1.2.5042, RStudio, Inc.).

References

    1. Lapointe S, Perry A, Butowski NA. Primary brain tumours in adults. Lancet. 2018;392(10145):432–46. - PubMed
    1. Ostrom QT, Patil N, Cioffi G, et al. CBTRUS statistical report: Primary brain and other central nervous system tumors diagnosed in the United States in 2013–2017. Neuro Oncol. 2020;22(12 Suppl 2):iv1–96. - PMC - PubMed
    1. Louis DN, Perry A, Reifenberger G, et al. The 2016 World Health Organization classification of tumors of the central nervous system: A summary. Acta Neuropathol. 2016;131(6):803–20. - PubMed
    1. Yan H, Parsons DW, Jin G, et al. IDH1 and IDH2 mutations in gliomas. N Engl J Med. 2009;360(8):765–73. - PMC - PubMed
    1. Cairncross G, Jenkins R. Gliomas with 1p/19q codeletion: a.k.a. oligodendroglioma. Cancer J. 2008;14(6):352–57. - PubMed