. 2021 Nov 26;12(1):6923.
doi: 10.1038/s41467-021-27292-7.

Changes in notifiable infectious disease incidence in China during the COVID-19 pandemic

Affiliations

Changes in notifiable infectious disease incidence in China during the COVID-19 pandemic

Meng-Jie Geng et al. Nat Commun. .

Abstract

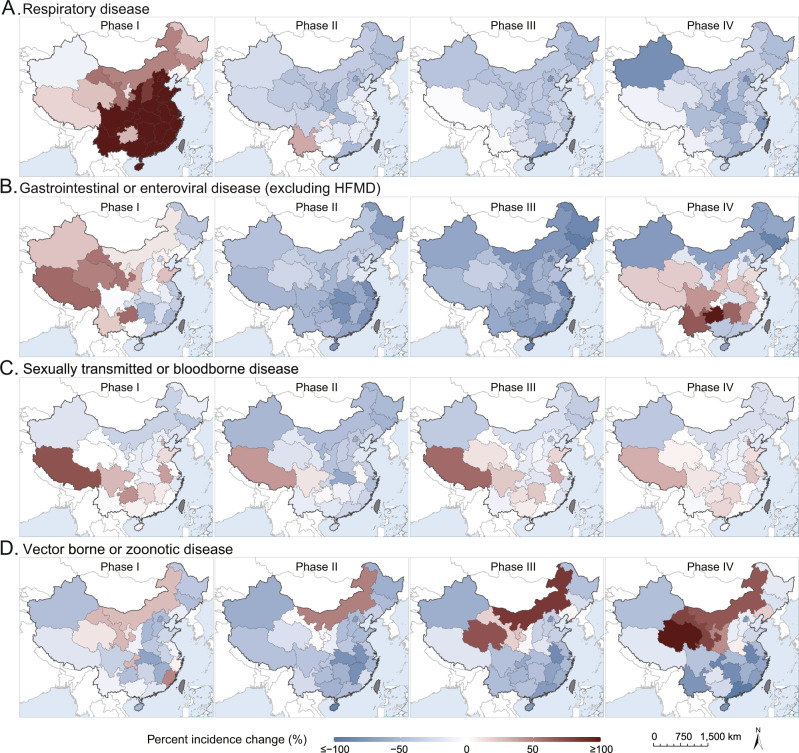
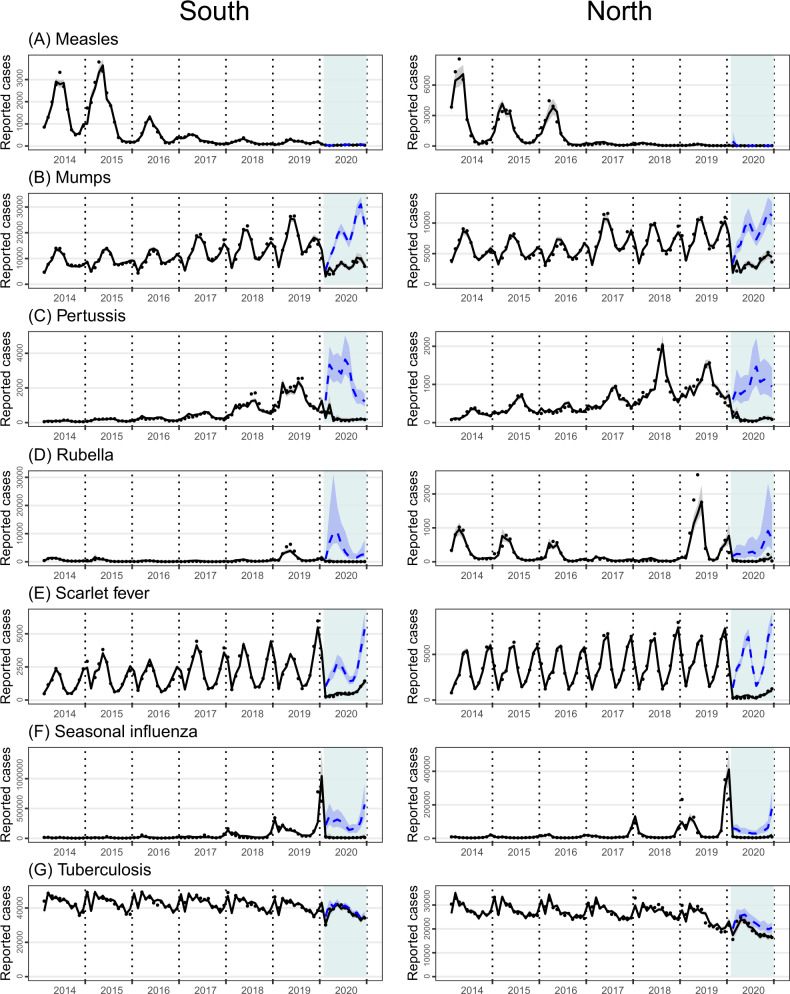
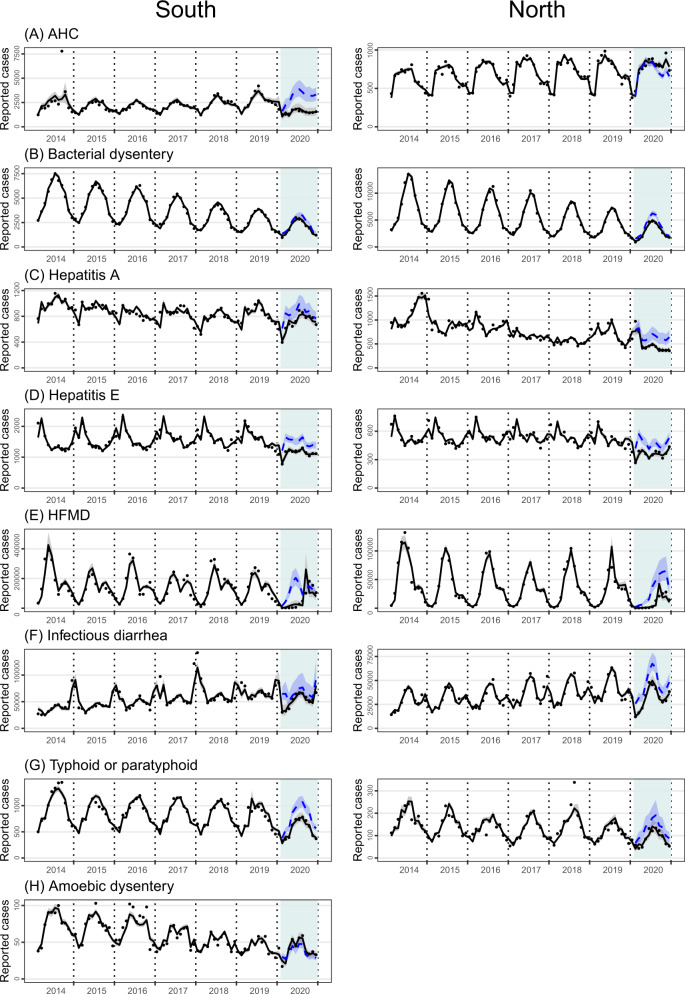
Nationwide nonpharmaceutical interventions (NPIs) have been effective at mitigating the spread of the novel coronavirus disease (COVID-19), but their broad impact on other diseases remains under-investigated. Here we report an ecological analysis comparing the incidence of 31 major notifiable infectious diseases in China in 2020 to the average level during 2014-2019, controlling for temporal phases defined by NPI intensity levels. Respiratory diseases and gastrointestinal or enteroviral diseases declined more than sexually transmitted or bloodborne diseases and vector-borne or zoonotic diseases. Early pandemic phases with more stringent NPIs were associated with greater reductions in disease incidence. Non-respiratory diseases, such as hand, foot and mouth disease, rebounded substantially towards the end of the year 2020 as the NPIs were relaxed. Statistical modeling analyses confirm that strong NPIs were associated with a broad mitigation effect on communicable diseases, but resurgence of non-respiratory diseases should be expected when the NPIs, especially restrictions of human movement and gathering, become less stringent.


Conflict of interest statement

The authors declare no competing interests.

Figures

Fig. 1
Fig. 1. Percent changes of cumulative incidence in each epidemic phase between 2020 and the average of 2014−2019 at the province level for four categories of notifiable infectious diseases.
A Respiratory disease, B gastrointestinal or enteroviral disease (excluding HFMD), C sexually transmitted or blood-borne disease, D vector-borne or zoonotic disease. The epidemic phases are defined as before Jan 22 (Phase I), Jan 23–Apr 7 (Phase II), Apr 8–Aug 31 (Phase III) and after Sep 1 (Phase IV). Gradient red and blue colors indicate positive and negative changes from 2014 to 2019, shaded gray indicates the missing value.
Fig. 2
Fig. 2. Time series of observed (black dots) and GLM-projected monthly numbers of reported cases for selected respiratory diseases.
A Measles, B mumps, C pertussis, D rubella, E scarlet fever, F seasonal influenza, G tuberculosis. The model-projected trajectories are shown for both with (black solid) and without (blue dash, 2020 only) nonpharmaceutical interventions. Intervention phases II–IV (Feb–Dec) in 2020 are colored light blue. For the counterfactual trajectory without NPIs, monthly volumes of outpatient visits in 2020 were assumed the same as in 2019.
Fig. 3
Fig. 3. Time series of observed (black dots) and GLM-projected monthly numbers of reported cases for selected gastrointestinal or enteroviral diseases.
A Acute hemorrhagic conjunctivitis, B bacterial dysentery, C hepatitis A, D hepatitis E, E hand, foot, and mouth disease, F infectious diarrhea, G typhoid or paratyphoid, and H amebic dysentery. The model-projected trajectories are shown for both with (black solid) and without (blue dash, 2020 only) nonpharmaceutical interventions. Intervention phases II–IV (Feb–Dec) in 2020 are colored light blue. For the counterfactual trajectory without NPIs, monthly volumes of outpatient visits in 2020 were assumed the same as in 2019.

References

    1. Markel H, et al. Nonpharmaceutical interventions implemented by US cities during the 1918–1919 influenza pandemic. JAMA. 2007;298:644–654. doi: 10.1001/jama.298.6.644. - DOI - PubMed
    1. Cauchemez S, Valleron AJ, Boëlle PY, Flahault A, Ferguson NM. Estimating the impact of school closure on influenza transmission from Sentinel data. Nature. 2008;452:750–754. doi: 10.1038/nature06732. - DOI - PubMed
    1. Mitchell T, et al. Non-pharmaceutical interventions during an outbreak of 2009 pandemic influenza A (H1N1) virus infection at a large public university, April-May 2009. Clin. Infect. Dis. 2011;52(Suppl 1):S138–S145. doi: 10.1093/cid/ciq056. - DOI - PubMed
    1. Loustalot F, et al. Household transmission of 2009 pandemic influenza A (H1N1) and nonpharmaceutical interventions among households of high school students in San Antonio, Texas. Clin. Infect. Dis. 2011;52(Suppl 1):S146–S153. doi: 10.1093/cid/ciq057. - DOI - PubMed
    1. Teasdale E, et al. Public perceptions of non-pharmaceutical interventions for reducing transmission of respiratory infection: systematic review and synthesis of qualitative studies. BMC Public Health. 2014;14:589–589. doi: 10.1186/1471-2458-14-589. - DOI - PMC - PubMed

Publication types