. 2021 Nov 26;12(1):6920.
doi: 10.1038/s41467-021-26556-6.

Mammary tumour cells remodel the bone marrow vascular microenvironment to support metastasis

Affiliations

Mammary tumour cells remodel the bone marrow vascular microenvironment to support metastasis

Raymond K H Yip et al. Nat Commun. .

Abstract

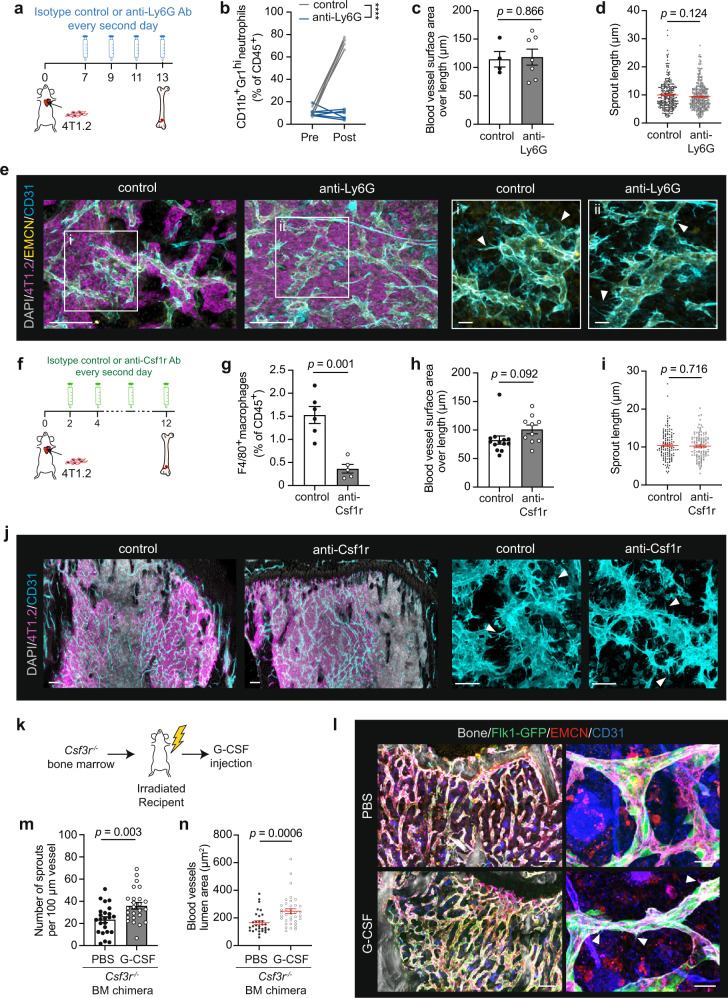
Bone marrow is a preferred metastatic site for multiple solid tumours and is associated with poor prognosis and significant morbidity. Accumulating evidence indicates that cancer cells colonise specialised niches within the bone marrow to support their long-term propagation, but the precise location and mechanisms that mediate niche interactions are unknown. Using breast cancer as a model of solid tumour metastasis to the bone marrow, we applied large-scale quantitative three-dimensional imaging to characterise temporal changes in the bone marrow microenvironment during disease progression. We show that mouse mammary tumour cells preferentially home to a pre-existing metaphyseal domain enriched for type H vessels. Metastatic lesion outgrowth rapidly remodelled the local vasculature through extensive sprouting to establish a tumour-supportive microenvironment. The evolution of this tumour microenvironment reflects direct remodelling of the vascular endothelium through tumour-derived granulocyte-colony stimulating factor (G-CSF) in a hematopoietic cell-independent manner. Therapeutic targeting of the metastatic niche by blocking G-CSF receptor inhibited pathological blood vessel remodelling and reduced bone metastasis burden. These findings elucidate a mechanism of 'host' microenvironment hijacking by mammary tumour cells to subvert the local microvasculature to form a specialised, pro-tumorigenic niche.


Conflict of interest statement

The authors declare no competing interests.

Figures

Fig. 1
Fig. 1. Metastatic mammary cancer cells selectively home to a BM vascular niche.
a Experimental workflow: 4T1.2-RFP cells were orthotopically transplanted into BALB/c mice. Primary tumours were resected 2 weeks later, bones collected at ethical endpoint, cryopreserved and then immunolabelled. b Top: tile scan covering the entire femoral slice with a Z-depth of ~100 µm. Bones were stained for DAPI (grey), 4T1.2 disseminated tumour cells (DTCs; magenta), Endomucin (EMCN; yellow) and CD31 (cyan). Bottom: four examples (corresponding to (i)−(iv) from the top image) of 4T1.2 DTCs either as solitary or clustered cells (n = 11 mice). Scale bars: 1 mm (top), 50 µm (bottom). c 3D image covering the entire femoral BM immunostained for 4T1.2 DTCs (magenta), CD31 (green) and Col1a1 (grey) (n = 11 mice). Scale bar, 1 mm. d Distance to the nearest blood vessel or bone surface for individual 4T1.2 DTC or simulated random spot. A total of 1426 DTCs were analysed from 11 different mice. P values, two-tailed unpaired t tests. e, f Percentages of 4T1.2 DTCs and random spots within 10 µm of a bone surface (e) or blood vessel (f). For (e) and (f), a total of 655 DTCs and 758 DTCs were analysed in 8 and 6 mice, respectively. P values, two-tailed unpaired t tests. g Optical section and surface rendering from 3D image of a 4T1.2 micrometastasis (magenta) in bone marrow immunostained for EMCN (yellow). In surface rendering, 4T1.2 cells and blood vessels were pseudo-coloured to yellow and grey, respectively (n = 11 mice). BV blood vessel. Scale bars: 50 µm (left), 10 µm (middle and right). All data reflect mean ± s.e.m. Source data are provided as a Source Data file.
Fig. 2
Fig. 2. A specialised vascular niche for mammary cancer cells during bone colonisation.
a 3D confocal image of DTCs (blue) in bone marrow. Bones were stained for DAPI (grey), EMCN (green) and CD31 (red). The image was transformed into a density plot that displayed voxel intensities in the CD31 and EMCN channels. Spatial gates were drawn to split the data set into phenotypically distinct components for volumetric reconstructions. Arterial vessels were defined by CD31hiEMCN (red); Type H capillaries by CD31hiEMCNhi (yellow); Type L sinusoids by CD31loEMCNlo (green) (n = 4 mice). Scale bars: 100 µm. b, d, f Distance to the nearest arterial vessel (b), type L sinusoid (d) and type H vessel (f) of individual DTCs and random spots were binned in histogram format. c, e, g Bar charts showing the averages of distances to vessel subtypes. Individual dots are from metastases from different mice. A total of 1256 DTCs (b, c), 299 DTCs (d, e) and 1052 DTCs (f, g) were analysed in 16 (b, c), 4 (d, e) and 17 (f, g) mice, respectively. P values in (b), (d), (f) by two-sided Kolmogorov−Smirnov analysis, and in (c), (e), (g) by two-tailed unpaired t tests. All data reflect mean ± s.e.m. Source data are provided as a Source Data file.
Fig. 3
Fig. 3. Metastatic mammary cancer cells remodel the bone marrow vasculature upon expansion.
a Tile scan (top) and enlarged (bottom) 3D images of femoral BM stained for DAPI (grey), 4T1.2 cells (magenta), EMCN (yellow) and CD31 (cyan) reveal vessel remodelling in tumour-infiltrated area (met) but not in the adjacent tumour-free area (non-met) (n = 5 mice). Scale bars, 1 mm (top), 100 µm (bottom). b Box and whisker plots of mean vascular CD31 and EMCN voxel intensity of individual vessels in non-met and met areas from n = 5 mice. Centre line; median; box limits, from the 25th to 75th percentiles; whiskers, from the 5th to 95th percentiles. ***P < 0.0001 by two-tailed unpaired t test. c Left: 3D image of femoral BM stained for DAPI (grey), 4T1.2 cells (magenta), EMCN (yellow) and CD31 (cyan). Right: zoomed-in images of met and non-met area (corresponding to (i) and (ii) from the left panel, respectively) (n = 7 mice). Arrowheads indicate EMCN+CD31+ vascular sprouts. Scale bars: 500 µm (overview), 50 µm (enlargement). d Digital reconstructions of CD31-positive blood vessels in non-met and met areas. Scale bar, 50 µm. e Measurements of endothelial surface area over vessel length from (d). n = 7 (non-met) and 9 mice (met). P value, two-tailed unpaired t tests. f 3D images of CD31-positive blood vessels (cyan) in non-met and met area. Right panel shows optical section from the selected area in left panel. Yellow lines demarcate vessel lumen. Scale bars: 20 µm. g Lumen area from (f). Individual dots are from one vessel. n = 5 (non-met) and 10 mice (met). P value, two-tailed unpaired t tests. All data reflect mean ± s.e.m. Source data are provided as a Source Data file.
Fig. 4
Fig. 4. G-CSF induces vascular remodelling in bone marrow.
a Tumour-infiltrated (met) and adjacent tumour-free (non-met) areas were microdissected and sorted to isolate CD31hiEMCNhi endothelial cells (ECs) for RNA-seq. Bones from age-matched, healthy BALB/c mice were collected as controls. Representative FACS plot showing the gating profile (see Supplementary Fig. 3a). b Expression levels of top differentially expressed genes in CD31hiEMCNhi ECs retrieved from met and non-met areas and control bones. The heat map shows the mean-centred z-score (n = 3 (met), 2 (control) and 6 (non-met) samples). Arrows designate angiogenesis or inflammatory response-related genes. c Gene ontology analysis conducted on the transcriptomes of CD31hiEMCNhi ECs isolated from met and non-met areas. d Heat map shows the mean-centred z-score of selected genes in angiogenesis and the inflammatory response across four isogenic murine mammary tumour lines. Genes were ranked by false discovery rate (FDR; n = 2 replicates per cell line). e Left: multiphoton 3D images of femoral BM of Flk1-GFP (green) reporter mice following G-CSF treatment. Bones were immunostained for EMCN (red) and CD31 (blue). Bone collagen was defined by second harmonic signal (grey). Right: high-magnification images of marrow endothelium in the corresponding mice (n = 3 mice per group). Arrowheads mark protruding vascular sprouts. See also Supplementary Movies 4 and 5. Scale bars, 200 µm (overviews), 20 µm (enlargements). f Optical sections of marrow endothelium from (e). Arrowheads mark protruding vascular sprouts. Scale bars, 5 µm. g, h Number of endothelial sprouts per 100 µm of vessel length (g) and vessel lumen area (h) from (e). Individual dots are from one vessel. n = 3 mice per group. P values, two-tailed unpaired t tests. All data reflect mean ± s.e.m. Source data are provided as a Source Data file.
Fig. 5
Fig. 5. Tumoral G-CSF drives BM vascular remodelling and enhances bone metastasis development.
a ELISA for G-CSF in cell media of 4T1.2, EMT6.5 control and EMT6.5 G-CSF cells. n = 3 per cell line. ***P = 0.0004, ****P < 0.0001 by two-tailed unpaired t tests. b Orthotopic tumour growth of EMT6.5 control (n = 10 mice) and EMT6.5 G-CSF cells (n = 8 mice). P value, two-way repeated measures ANOVA (days 0−12). c Experimental plan to test the effect of cancer cell-secreted G-CSF on bone metastasis. d, e Spleen weight (d) and quantification of circulating Ly6G+ neutrophils (e) at experimental endpoint. For (d), n = 6 (control) and 8 mice (G-CSF). For (e), n = 4 (control) and 6 mice (G-CSF). **P = 0.001, ***P = 0.0003 by two-tailed unpaired t tests. f 3D images (top) and enlarged micrographs (bottom) of femur from mice injected with control or G-CSF-expressing EMT6.5 cells. Bones were stained for DAPI (grey), EMT6.5 cells (magenta), EMCN (yellow) and CD31 (cyan) (n = 9 mice per cell line). Arrowheads indicate endothelial sprouts. Scale bars: 200 µm (overviews), 20 µm (enlargements). g, h Measurement of lesion area (g) and number (h) from (f). n = 9 (control) and 11 mice (G-CSF). P values, two-tailed unpaired t tests. i, j Quantification of surface area over vessel length (i) and sprout length (j) of blood vessels in macroscopic bone lesions from mice harbouring control and G-CSF-expressing EMT6.5 cells. Individual dots are from one vessel (i) or sprout (j). For (i), n = 4 (control) and 5 mice (G-CSF). For (j), n = 3 mice per group. P values, two-tailed unpaired t tests. All data reflect mean ± s.e.m. NS not significant. Source data are provided as a Source Data file.
Fig. 6
Fig. 6. G-CSF-induced vessel remodelling is independent of hematopoietic cells.
a Diagram showing the experimental plan in (be). b FACS analysis of circulating neutrophils before and after treatment. n = 5 (control) and 6 mice (anti-Ly6G). ****P < 0.0001. c, d Quantification of surface area over vessel length (c) and sprout length (d) of blood vessels from (e). Individual dots are from one vessel (c) or sprout (d). For (c), n = 3 (control) and 5 mice (anti-Ly6G). For (d), n = 3 mice per group. e Tile scan (left) and magnified images (right) of bone lesions from mice that received isotype control or anti-Ly6G antibody. Bones were stained for DAPI (grey), 4T1.2 cells (magenta), EMCN (yellow) and CD31 (cyan) (n = 5 mice per group). Arrowheads mark protruding vascular sprouts. Scale bars: 50 µm (left), 30 µm (right). f Diagram showing the experimental plan in (gj). g Quantification of bone marrow F4/80+ macrophages at experimental endpoint. n = 6 (control) and 5 mice (anti-Csf1r). h, i Quantification of surface area over vessel length (h) and sprout length (i) of blood vessels from (j). Individual dots are from one vessel (h) or sprout (i). For (h), n = 6 (control) and 5 mice for (anti-Csf1r). For (i), n = 3 mice per group. j Tile scan (left) and magnified images (right) of bone lesions from mice that received isotype control or anti-Csf1r antibody. Bones were stained for DAPI (grey), 4T1.2 cells (magenta) and CD31 (cyan) (n = 5 mice per group). Arrowheads point to protruding vascular sprouts. Scale bars: 200 µm (overview), 20 µm (enlargements). k Diagram showing the experimental plan in (ln). l Multiphoton 3D images of femur from G-CSF-treated and control Flk1-GFP (green) mice reconstituted with G-CSFR-deficient haematopoiesis. Bones were immunostained for EMCN (red) and CD31 (blue). Bone collagen was defined by second harmonic signal (n = 3 mice per group). Arrowheads mark protruding vascular sprouts. Scale bars: 100 µm (overviews), 20 µm (enlargements). m, n Number of endothelial sprouts per 100 µm of vessel length (m) and vessel lumen area (n) from (l). Individual dots are from one vessel (n = 3 mice per group). P values in (b) by repeated measure two-way ANOVA, and in (c), (d), (g), (h), (i), (m), (n) by two-tailed unpaired t test. All data reflect mean ± s.e.m. Source data are provided as a Source Data file.
Fig. 7
Fig. 7. G-CSF deficiency suppresses remodelling of the BM vascular niche and bone metastasis.
a Strategy to test the bone metastatic ability of G-CSF-deficient 4T1.2 cells. b Ex vivo fluorescence imaging of bones collected at experimental endpoint. Arrows point to metastasis in bone. c, d Quantification of photon flux (c) and bone metastasis area (d) from (b). Individual dots are from one bone. n = 11 (shCtrl) and 8 mice (shCsf3-1, shCsf3-2). In (c), **P = 0.0080, ***P < 0.0001. In (d), *P = 0.0126, ***P = 0.0003. P values, one-way ANOVA and Dunnett’s multiple comparisons test. e Representative 3D images (top) and enlarged micrographs (bottom) of femoral BM from mice injected with 4T1.2-shCtrl, 4T1.2-shCsf3-1 or 4T1.2-shCsf3-2 cells. Bones were stained for DAPI (grey), 4T1.2 cells (magenta), EMCN (yellow) and CD31 (cyan) (n = 5 mice per cell line). Arrowheads indicate endothelial sprouts. Scale bars: 300 µm (overviews), 10 µm (enlargements). f, g Quantification of surface area over length (f) and sprout length (g) of blood vessels from (e). Individual dots are from one vessel (f) or sprout (g). n = 3 mice per group. *P = 0.0116, **P = 0.0002, ***P < 0.0001 by one-way ANOVA and Dunnett’s multiple comparisons test. hj Representative micro-computed tomography images (h) and morphometric analysis of tibial trabecula from metastasis-bearing mice. Data are presented as percentage of bone volume/tissue volume (BV/TV; %) (i) and trabecular thickness (Tb.Th; µm) (j). n = 5 mice per group. In (i), **P = 0.0016, ***P = 0.0002. In (j), *P = 0.0168, **P = 0.004. P values, one-way ANOVA and Dunnett’s multiple comparisons test. All data reflect mean ± s.e.m. Source data are provided as a Source Data file.
Fig. 8
Fig. 8. G-CSFR blockade protects against vessel remodelling and impedes experimental and spontaneous bone metastasis.
a Strategy to evaluate the effect of anti-G-CSFR neutralising antibody (Ab) in the 4T1.2 experimental bone metastasis model. b Ex vivo fluorescence imaging of bones collected at experimental endpoint. Arrows point to metastasis in bone. c Quantification of photon flux from (b). Individual dots are from one bone (n = 9 mice per group). P value, two-tailed unpaired t tests. d 3D images of bone lesions in mice that received isotype control or anti-G-CSFR Ab. Bones were stained for DAPI (grey), 4T1.2 cells (magenta), EMCN (yellow) and CD31 (cyan) (n = 6 mice per group). Scale bars, 300 µm. e, f Quantification of surface area over length (e) and sprout length (f) of blood vessels from (d). Individual dots are from one vessel (e) or sprout (f). For (e), n = 4 (control) and 6 mice (anti-G-CSFR). For (f), n = 3 (control) and 4 mice (anti-G-CSFR). P values, two-tailed unpaired t tests. g Workflow to test the effect of anti-G-CSFR Ab in the 4T1.2 spontaneous bone metastasis model. h, i Ex vivo fluorescence imaging (h) and weight (i) of primary tumour at the time of surgical resection. n = 24 (control) and 25 mice (anti-G-CSFR). P value, two-tailed unpaired t tests. j Incidence of bone metastasis at experimental endpoint. k Schematic model of the vascular route exploited by mammary tumour cells for bone invasion and the role of G-CSF in creating a metastasis-favouring vascular niche. Image created using BioRender.com. All data reflect mean ± s.e.m. Source data are provided as a Source Data file.

References

    1. Coleman RE. Clinical features of metastatic bone disease and risk of skeletal morbidity. Clin. Cancer Res. 2006;12:6243s–6249s. - PubMed
    1. Weilbaecher KN, Guise TA, McCauley LK. Cancer to bone: a fatal attraction. Nat. Rev. Cancer. 2011;11:411–425. - PMC - PubMed
    1. Croucher PI, McDonald MM, Martin TJ. Bone metastasis: the importance of the neighbourhood. Nat. Rev. Cancer. 2016;16:373–386. - PubMed
    1. Crane GM, Jeffery E, Morrison SJ. Adult haematopoietic stem cell niches. Nat. Rev. Immunol. 2017;17:573–590. - PubMed
    1. Wang H, et al. The osteogenic niche promotes early-stage bone colonization of disseminated breast cancer cells. Cancer Cell. 2015;27:193–210. - PMC - PubMed

Publication types

MeSH terms

Substances