. 2021 Nov 26;12(1):6871.
doi: 10.1038/s41467-021-27063-4.

Protective mucosal immunity against SARS-CoV-2 after heterologous systemic prime-mucosal boost immunization

Affiliations

Protective mucosal immunity against SARS-CoV-2 after heterologous systemic prime-mucosal boost immunization

Dennis Lapuente et al. Nat Commun. .

Abstract

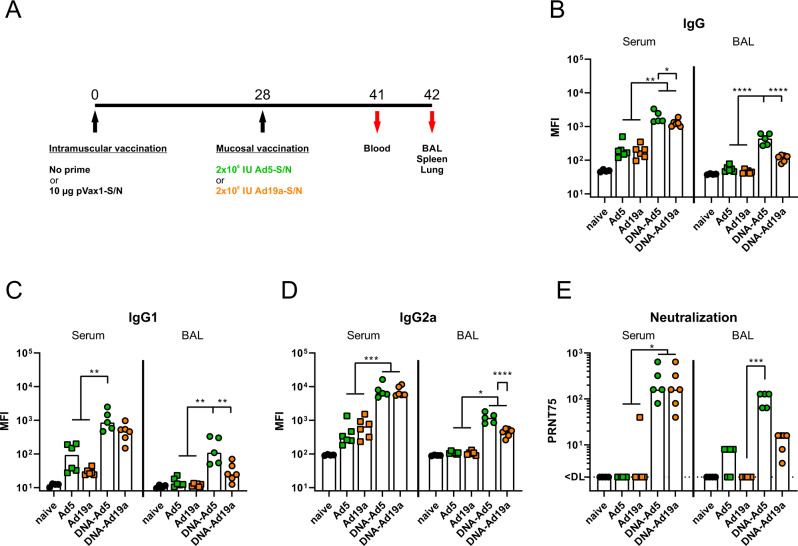
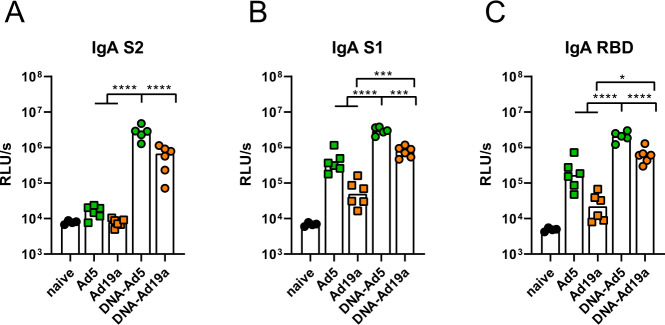
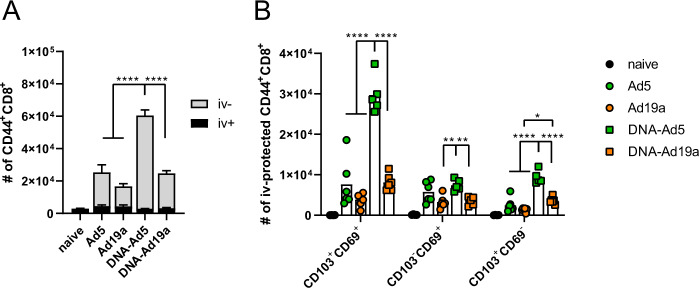
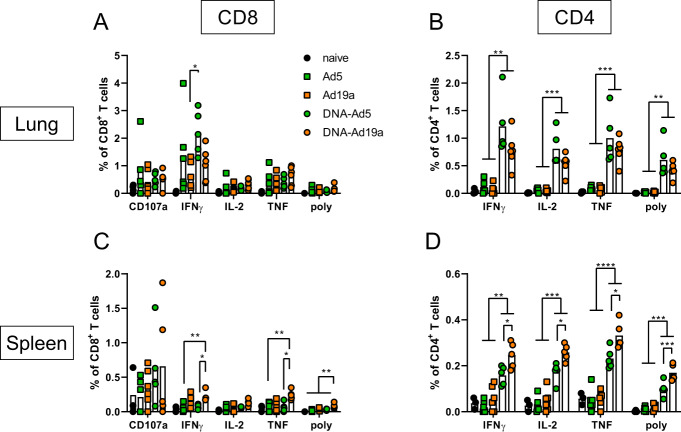
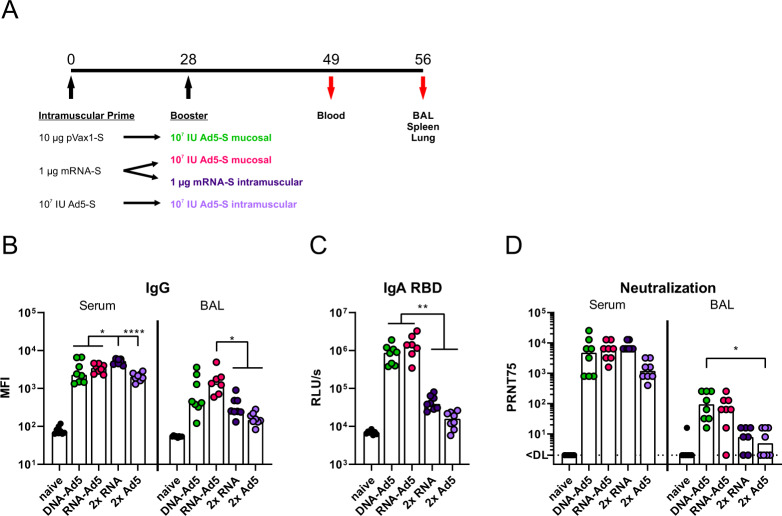
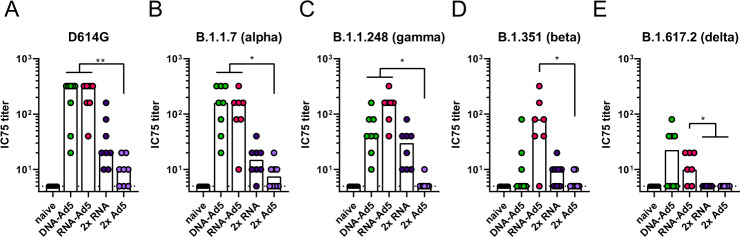
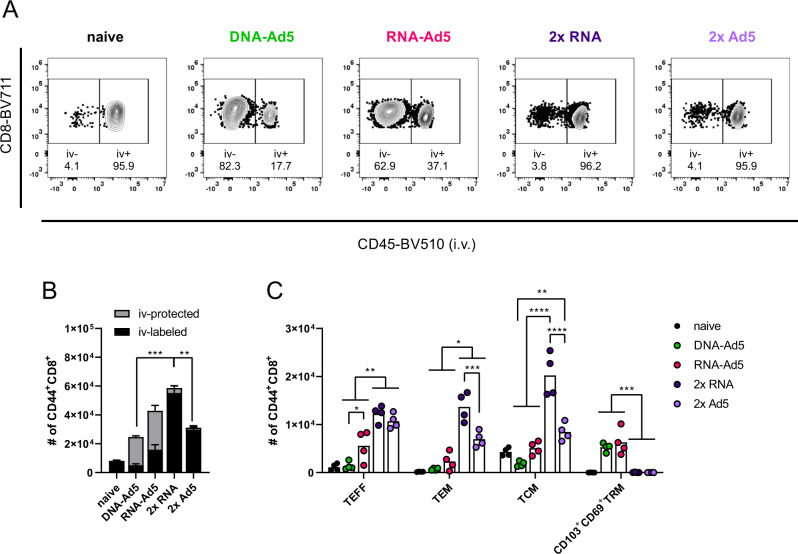
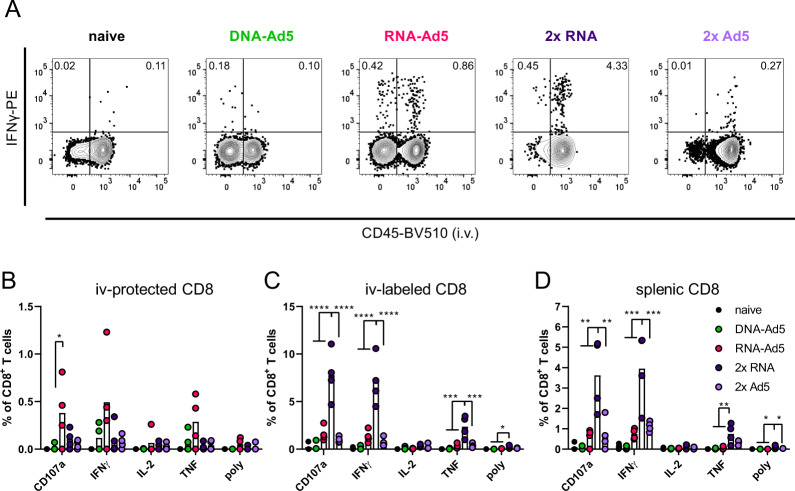
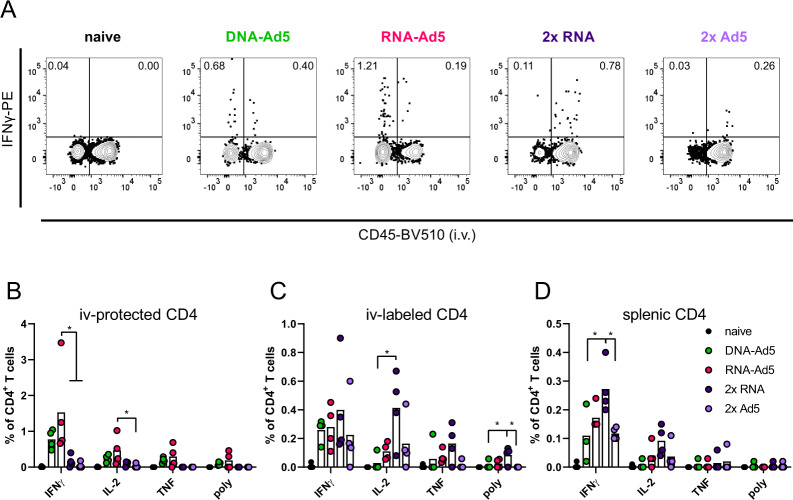
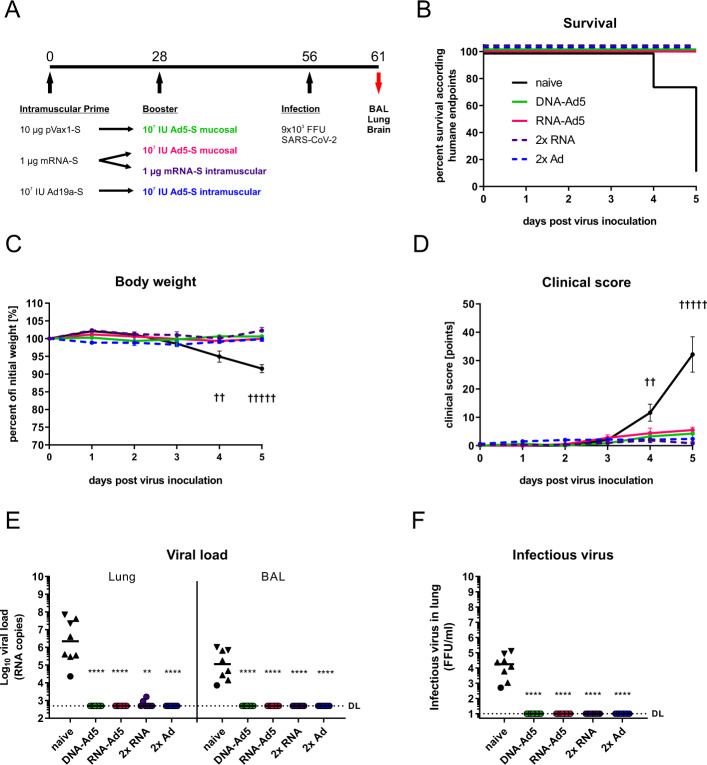
Several effective SARS-CoV-2 vaccines are currently in use, but effective boosters are needed to maintain or increase immunity due to waning responses and the emergence of novel variants. Here we report that intranasal vaccinations with adenovirus 5 and 19a vectored vaccines following a systemic plasmid DNA or mRNA priming result in systemic and mucosal immunity in mice. In contrast to two intramuscular applications of an mRNA vaccine, intranasal boosts with adenoviral vectors induce high levels of mucosal IgA and lung-resident memory T cells (TRM); mucosal neutralization of virus variants of concern is also enhanced. The mRNA prime provokes a comprehensive T cell response consisting of circulating and lung TRM after the boost, while the plasmid DNA prime induces mostly mucosal T cells. Concomitantly, the intranasal boost strategies lead to complete protection against a SARS-CoV-2 infection in mice. Our data thus suggest that mucosal booster immunizations after mRNA priming is a promising approach to establish mucosal immunity in addition to systemic responses.


Conflict of interest statement

C.T. is founder and shareholder of SIRION Biotech GmbH. The other authors declare no competing interests.

Figures

Fig. 1
Fig. 1. Humoral responses after intranasal immunization with Ad5- or Ad19a-based viral vector vaccines.
A BALB/c mice were immunized intranasally with Ad5- or Ad19a-based vectors encoding the N and S protein of SARS-CoV-2 (2 × 106 infectious units per vector). Mice from the heterologous prime-boost groups were primed four weeks before by intramuscular injection of N- and S-encoding DNA plasmids (10 µg per plasmid) followed by electroporation. Serum antibody responses were analysed thirteen days and mucosal immune responses in the BALs fourteen days after the mucosal immunization. Spike-specific IgG (B), IgG1 (C), and IgG2a (D) were assessed by a flow cytometric approach (dilutions: sera 1:400, BAL 1:100). Plaque reduction neutralization titres (PRNT75) were determined by in vitro neutralization assays (E). Bars represent group medians overlaid with individual data points; naïve n = 4; DNA-Ad5 n = 5; other groups n = 6. Data were analysed by one-way ANOVA followed by Tukey’s post test (BD) or by Kruskal–Wallis test (one-way ANOVA) followed by Dunn’s multiple comparison test (E). Statistically significant differences are indicated only among the different vaccine groups; p values indicate significant differences (*p < 0.05; **p < 0.005; ***p < 0.0005; ****p < 0.0001).
Fig. 2
Fig. 2. Mucosal, spike-specific IgA responses.
BALB/c mice were vaccinated according to Fig. 1A. BAL samples were tested for spike-specific IgA directed against the domains of S2 (A), S1 (B), or RBD (C) by ELISA (dilution: 1:10). Bars represent group medians overlaid with individual data points; naïve n = 4; DNA-Ad5 n = 5; other groups n = 6. Data were analysed by one-way ANOVA followed by Tukey’s post test. Statistically significant differences are indicated only among the different vaccine groups; p values indicate significant differences (*p < 0.05; **p < 0.005; ***p < 0.0005; ****p < 0.0001).
Fig. 3
Fig. 3. Tissue-resident memory T cell subsets in the lung.
BALB/c mice were vaccinated according to Fig. 1A. In absence of suitable MHC-I multimers, antigen-experienced CD8+ T cells were identified by CD44 staining (A). Intravascular staining was used to differentiate between circulating (iv+) and tissue-resident (iv−) memory cells. Tissue-resident phenotypes were assessed by staining for CD69 and/or CD103 within the iv-protected memory compartment (B). The gating strategy is shown in Supplementary Fig. 2. Bars represent group means with SEM (A) or overlaid with individual data points (B); naïve n = 4; DNA-Ad5 n = 5; other groups n = 6. Data were analysed by one-way ANOVA followed by Tukey’s multiple comparison test. Statistical significant differences are indicated only among the different the vaccine groups; p values indicate significant differences (*p < 0.05; **p < 0.005; ***p < 0.0005; ****p < 0.0001).
Fig. 4
Fig. 4. Spike-specific T cell responses after intranasal immunization with Ad5- or Ad19a-based viral vector vaccines.
BALB/c mice were vaccinated according to Fig. 1A. Lung and spleen homogenates were restimulated with peptide pools covering major parts of S. The responding CD8+ (A and C) and CD4+ T cells (B and D) were identified by intracellular staining for accumulated cytokines or staining for CD107a as degranulation marker. The gating strategy is shown in Supplementary Fig. 3. Bars represent group means overlaid with individual data points; naïve n = 4 (exception: n = 3 in C and D); DNA-Ad5 n = 5; other groups n = 6. Data were analysed by one-way ANOVA followed by Tukey’s multiple comparison test. Statistically significant differences are indicated only among the different vaccine groups; p values indicate significant differences (*p < 0.05; **p < 0.005; ***p < 0.0005; ****p < 0.0001). poly; polyfunctional T cell population positive for all assessed markers.
Fig. 5
Fig. 5. Humoral responses after homologous or heterologous prime-boost vaccination.
A C57BL/6 mice received an intramuscular prime immunization with the spike-encoding DNA (10 µg), Ad5-S (107 infectious units), or the mRNA vaccine, Comirnaty® (1 µg). Mice from the heterologous prime-boost groups were boosted four weeks later intranasally with Ad5-S (107 infectious units). The homologous prime-boost groups received a second dose of mRNA (1 µg) or Ad5-S (107 infectious units) intramuscularly. Serum antibody responses were analysed 21 days and mucosal immune responses four weeks after the boost immunizations. Spike-specific IgG (B) were assessed by a flow cytometric approach (dilutions: Sera 1:800, BAL 1:20). BAL samples were tested for spike-specific IgA directed against RBD by ELISA (C). Plaque reduction neutralization titres (PRNT75) were determined by in vitro neutralization assays (D). Bars represent group medians overlaid with individual data points; sera all groups n = 8; BALs RNA-Ad5 n = 7, other groups n = 8 (out of two independent experiments). Data were analysed by one-way ANOVA followed by Tukey’s post test (B and C) or Kruskal–Wallis test (one-way ANOVA) followed by Dunn’s multiple comparison test (D). Statistically significant differences are indicated only among the different vaccine groups; p values indicate significant differences (*p < 0.05; **p < 0.005; ***p < 0.0005; ****p < 0.0001).
Fig. 6
Fig. 6. Neutralization of SARS-CoV-2 variants.
C57BL/6 mice were vaccinated according to Fig. 5A. BAL samples were analysed by pseudotype neutralization assays for the neutralization of different SARS-CoV-2 variants (AE). Data points were shown for individual animals and bars represent group medians; RNA-Ad5 n = 7, other groups n = 8 (out of two independent experiments). The dashed line indicates the lower limit of detection. Data were analysed by Kruskal–Wallis test (one-way ANOVA) followed by Dunn’s multiple comparison. Statistically significant differences are indicated only among the different vaccine groups; p values indicate significant differences (*p < 0.05; **p < 0.005; ***p < 0.0005; ****p < 0.0001).
Fig. 7
Fig. 7. Circulating and tissue-resident memory T cell subsets in the lung.
C57BL/6 mice were vaccinated according to Fig. 5A. Antigen-experienced CD8+ T cells were identified by CD44 staining and intravascular staining was used to differentiate between circulating (iv-labelled) and tissue-resident (iv-protected) memory cells. Representative contour plots are shown in (A). B The total number of CD44+ CD8+ with the relative contribution of iv− and iv+ cells are summarized for each group. C Within the iv-labelled CD44+ CD8+ population, effector T cells (TEFF; CD127-KLRG1+), effector memory T cells (TEM; CD127+KLRG1+), and central memory T cells (TCM; CD127+KLRG1CD69CD103) were defined. Within the iv-protected population, TRM cells were defined as KLRG1CD103+CD69+. The gating strategy is shown in Supplementary Fig. 2. Bars represent group means overlaid with individual data points; all groups n = 4. Data were analysed by one-way ANOVA followed by Tukey’s multiple comparison test. Statistically significant differences are indicated only among the different vaccine groups; p values indicate significant differences (*p < 0.05; **p < 0.005; ***p < 0.0005; ****p < 0.0001). Representative data from one out of three independent experiments with slightly different end time points are shown.
Fig. 8
Fig. 8. Spike-specific CD8+ T cell responses.
C57BL/6 mice were vaccinated according to Fig. 5A. Lung (B and C) and spleen homogenates (D) were restimulated with a peptide pool covering major parts of S. The responding CD8+ T cells were identified by intracellular staining for accumulated cytokines or staining for CD107a as degranulation marker. A Representative contour plots showing IFNγ production in iv+ and iv− lung CD8+ T cells. The gating strategy is shown in Supplementary Fig. 3. Bars represent group means overlaid with individual data points; all groups n = 4 (exception: n = 3 for DNA-Ad5 in D). Data were analysed by one-way ANOVA followed by Tukey’s multiple comparison test. Statistically significant differences are indicated only among the different vaccine groups; p values indicate significant differences (*p < 0.05; **p < 0.005; ***p < 0.0005; ****p < 0.0001). poly; polyfunctional T cell population positive for all assessed markers. Representative data from one out of three independent experiments with slightly different end time points are shown.
Fig. 9
Fig. 9. Spike-specific CD4+ T cell responses.
C57BL/6 mice were vaccinated according to Fig. 5A. Lung (B and C) and spleen homogenates (D) were restimulated with a peptide pool covering major parts of S. The responding CD4+ T cells were identified by intracellular staining for accumulated cytokines. A Representative contour plots showing IFNγ production in iv+ and iv− lung CD4+ T cells. The gating strategy is shown in Supplementary Fig. 3. Bars represent group means overlaid with individual data points; all groups n = 4 (exception: n = 3 for DNA-Ad5 in D). Data were analysed by one-way ANOVA followed by Tukey’s multiple comparison test. Statistically significant differences are indicated only among the different vaccine groups; p values indicate significant differences (*p < 0.05; **p < 0.005; ***p < 0.0005; ****p < 0.0001). poly; polyfunctional T cell population positive for all assessed markers. Representative data from one out of three independent experiments with slightly different end time points are shown.
Fig. 10
Fig. 10. Protective efficacy against SARS-CoV-2 infection.
A K18-hACE2 mice (2x RNA n = 7, other groups n = 8) received an intramuscular prime immunization with the spike-encoding DNA (10 µg) followed by electroporation, Ad19a-S (107 infectious units), or the mRNA vaccine, Comirnaty® (1 µg). Mice from the heterologous prime-boost groups were boosted four weeks later intranasally or intramuscularly with Ad5-S (107 infectious units). The 2x RNA group received a second dose of mRNA (1 µg) intramuscularly. Four weeks after the boost immunization, mice were infected intranasally with 9 × 103 FFU SARS-CoV-2. All animals were monitored daily for survival (B), body weight (C), and clinical score (D). Curves in (C) and (D) represent group means with SEM. Animals reaching humane endpoints were euthanized and are marked by a cross at the respective time point. Viral RNA copy numbers were assessed in lung homogenates and BAL samples by qRT-PCR (E) and infectious virus was retrieved and titrated from lung homogenates (F). Data points shown represent viral copy number or virus titre of each animal with the median of each group, whereby circles indicate a survival of 5 days post infection and triangles indicates euthanized mouse according humane endpoints at day 4 (triangle pointing down) or day 5 (triangle pointing up). The dashed line indicates the lower limit of detection. Data were analysed by Kruskal–Wallis test (one-way ANOVA) and Dunn’s Pairwise Multiple Comparison Procedures as post hoc test in comparison to PBS control; p values indicate significant differences (*p < 0.05; **p < 0.005; ***p < 0.0005; ****p < 0.0001).

References

    1. WHO, W. H. O. COVID-19 Weekly Epidemiological Update, Edition 50. (2021). Available at: https://www.who.int/publications/m/item/weekly-epidemiological-update-on.... (Accessed: 27th July 2021).
    1. WHO, W. H. O. COVID-19 vaccine tracker and landscape. (2021). Available at: https://www.who.int/publications/m/item/draft-landscape-of-covid-19-cand.... (Accessed: 21st July 2021).
    1. Baden LR, et al. Efficacy and safety of the mRNA-1273 SARS-CoV-2 vaccine. N. Engl. J. Med. 2021;384:403–416. - PMC - PubMed
    1. Polack FP, et al. Safety and efficacy of the BNT162b2 mRNA Covid-19 vaccine. N. Engl. J. Med. 2020;383:2603–2615. - PMC - PubMed
    1. Voysey M, et al. Safety and efficacy of the ChAdOx1 nCoV-19 vaccine (AZD1222) against SARS-CoV-2: an interim analysis of four randomised controlled trials in Brazil, South Africa, and the UK. Lancet. 2021;397:99–111. - PMC - PubMed

Publication types

MeSH terms