. 2021 Nov 26;12(1):6943.
doi: 10.1038/s41467-021-27248-x.

Stroke subtype-dependent synapse elimination by reactive gliosis in mice

Affiliations

Stroke subtype-dependent synapse elimination by reactive gliosis in mice

Xiaojing Shi et al. Nat Commun. .

Erratum in

Abstract

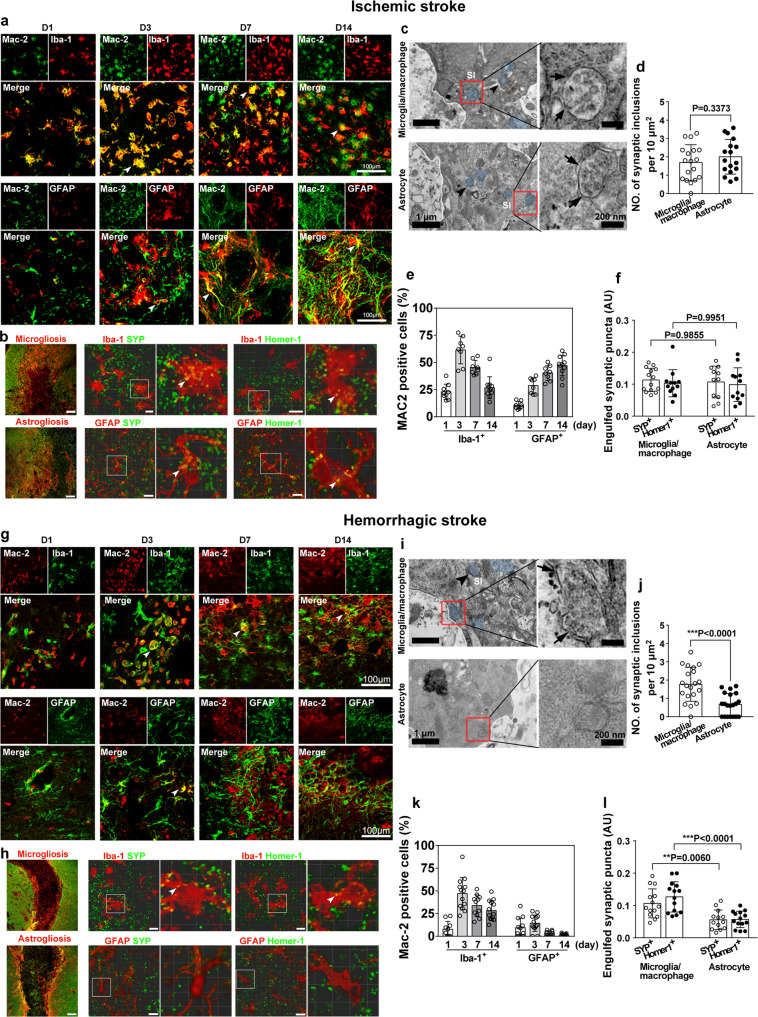
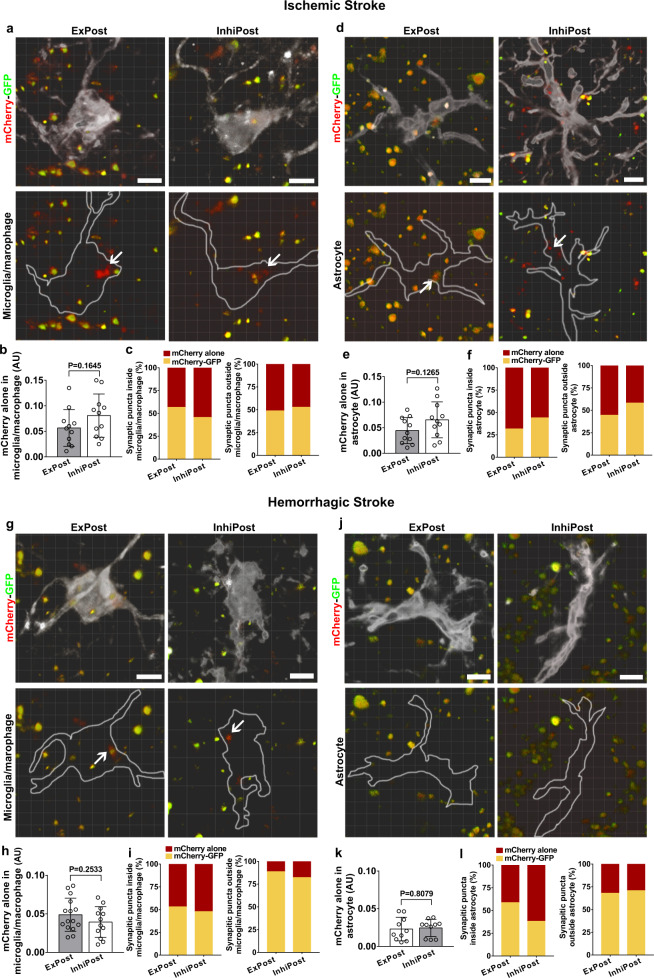
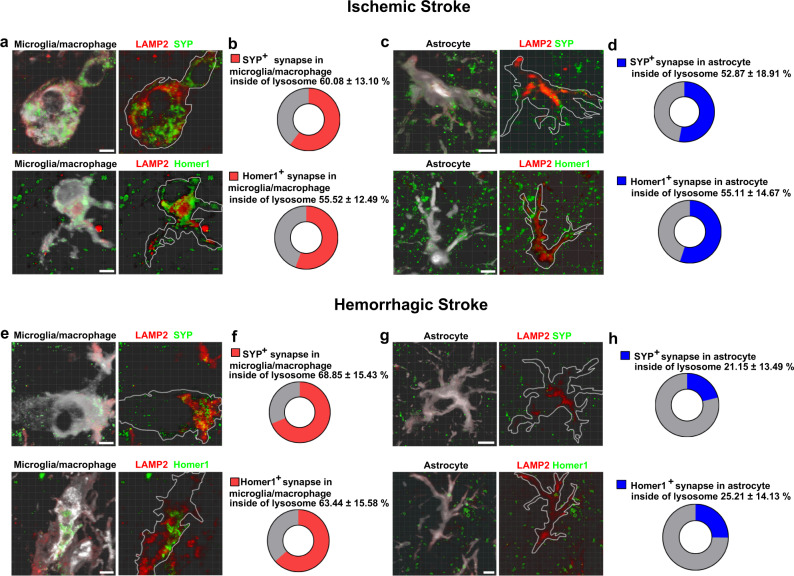
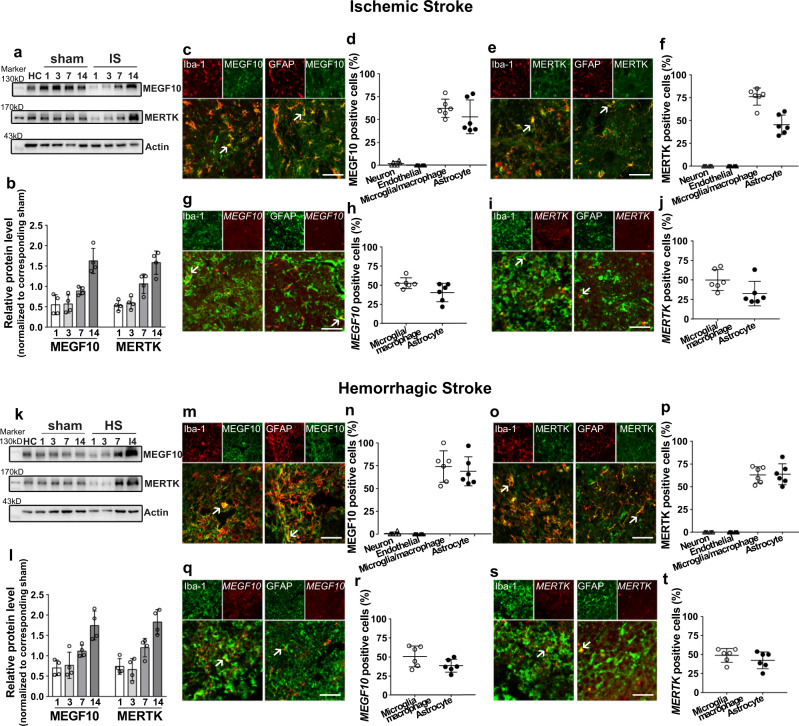
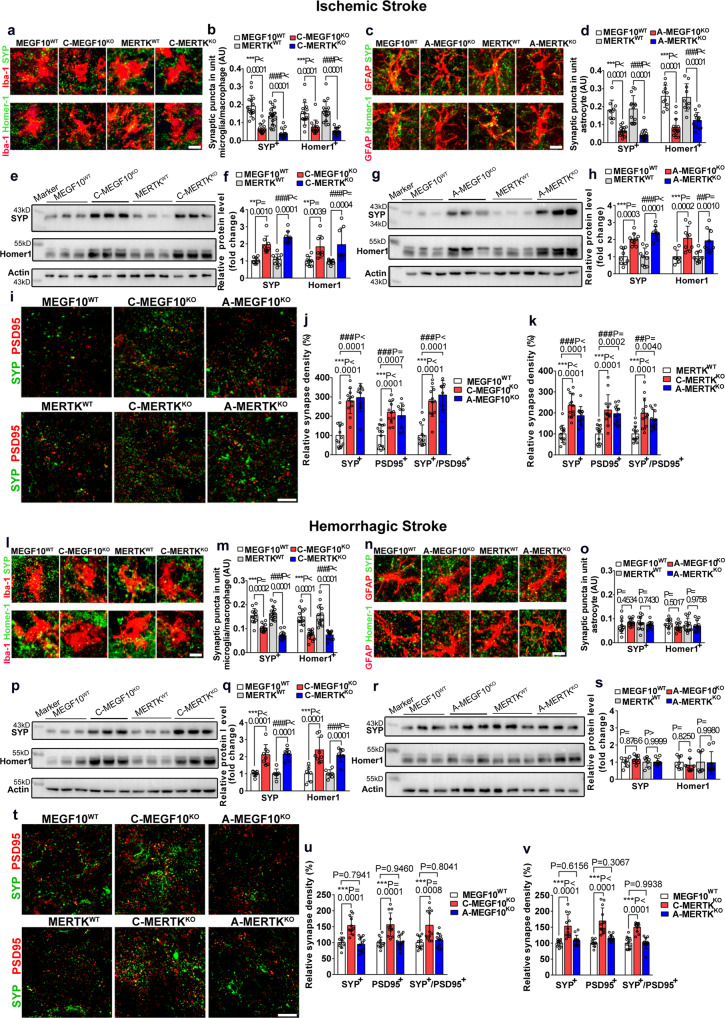
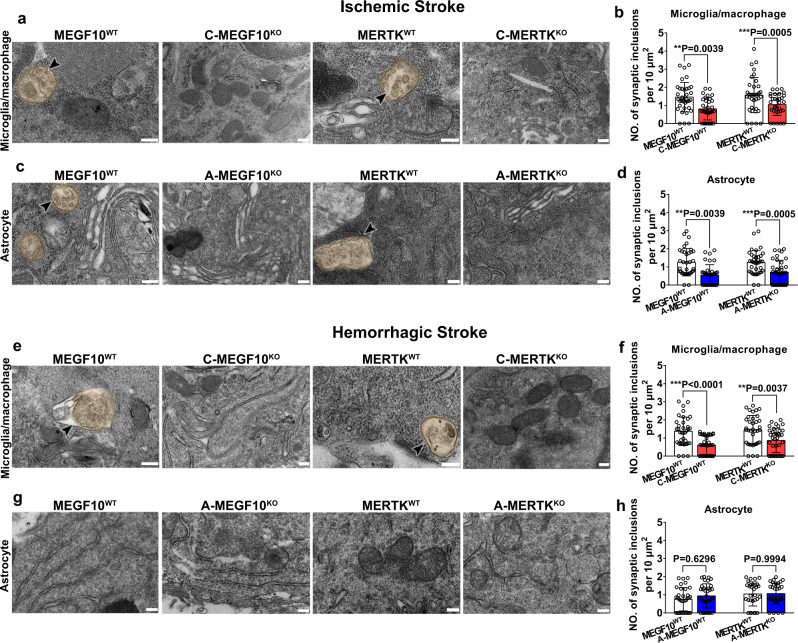
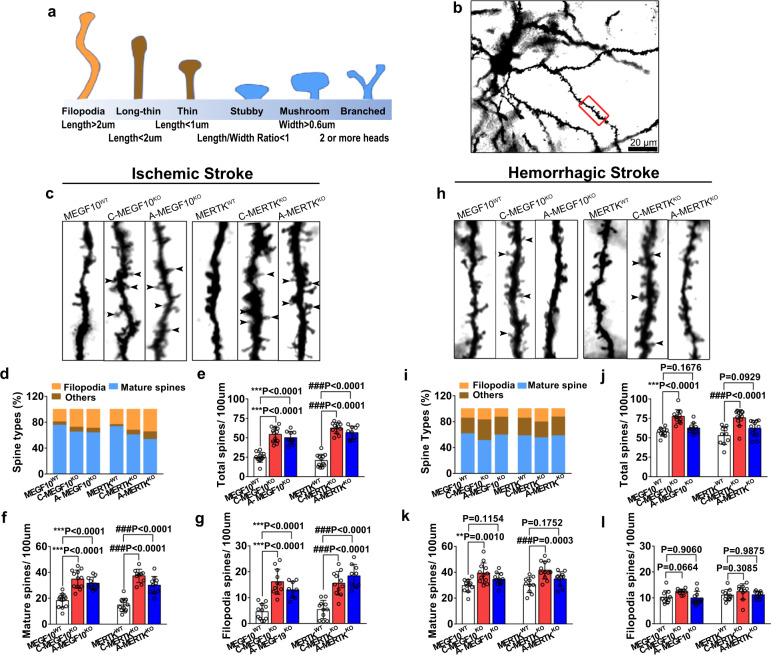
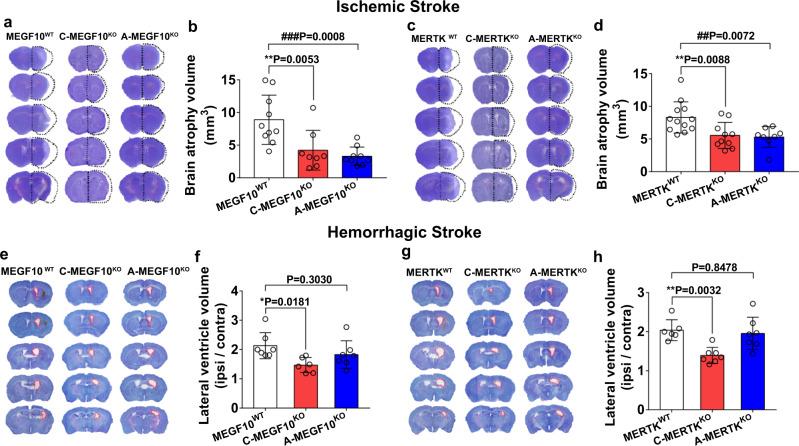
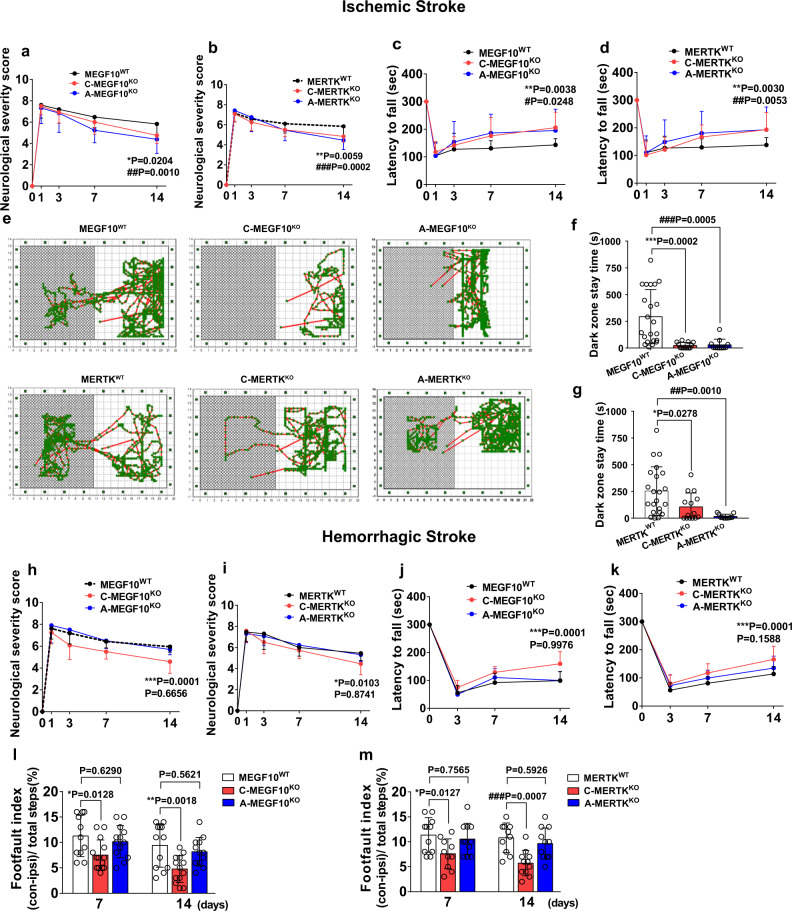
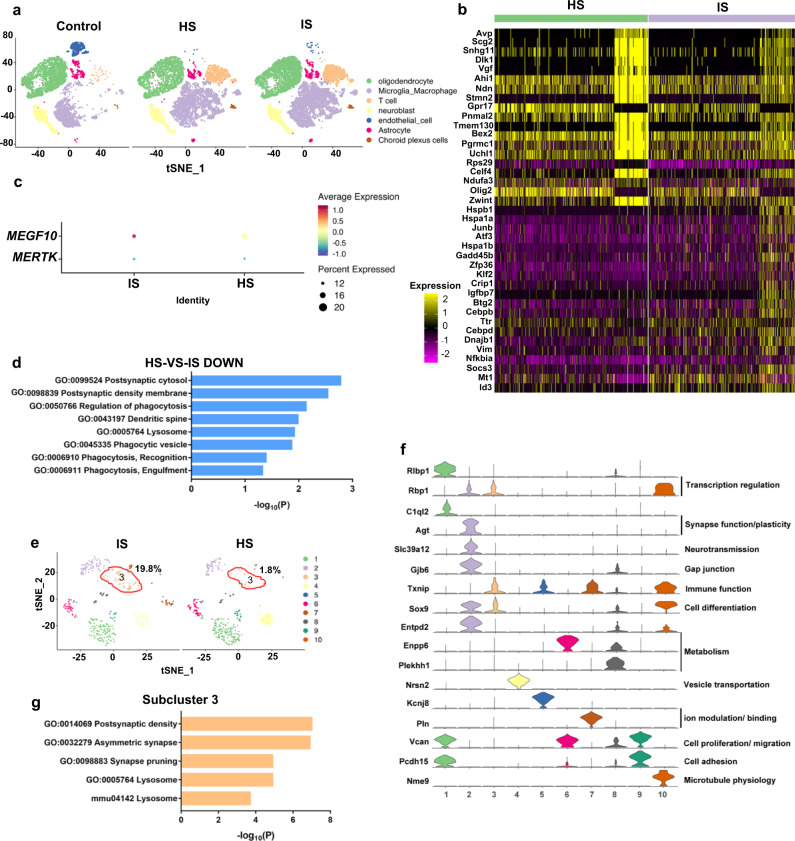
The pathological role of reactive gliosis in CNS repair remains controversial. In this study, using murine ischemic and hemorrhagic stroke models, we demonstrated that microglia/macrophages and astrocytes are differentially involved in engulfing synapses in the reactive gliosis region. By specifically deleting MEGF10 and MERTK phagocytic receptors, we determined that inhibiting phagocytosis of microglia/macrophages or astrocytes in ischemic stroke improved neurobehavioral outcomes and attenuated brain damage. In hemorrhagic stroke, inhibiting phagocytosis of microglia/macrophages but not astrocytes improved neurobehavioral outcomes. Single-cell RNA sequencing revealed that phagocytosis related biological processes and pathways were downregulated in astrocytes of the hemorrhagic brain compared to the ischemic brain. Together, these findings suggest that reactive microgliosis and astrogliosis play individual roles in mediating synapse engulfment in pathologically distinct murine stroke models and preventing this process could rescue synapse loss.


Conflict of interest statement

The authors declare no competing interests.

Figures

Fig. 1
Fig. 1. Engulfment of synapses by microglia/macrophages and astrocytes in the gliosis region in ischemic and hemorrhagic stroke.
Representative single-plane images showed immunostaining of Iba-1 (green), GFAP (green), and Mac-2 (red) in the perifocal region at 1, 3, 7, and 14 days after ischemic stroke (a) and hemorrhagic stroke (g). Arrowheads indicate Mac-2 expression in glial cells. Bar = 100 µm. Percentage of Iba-1+/Mac-2+ and GFAP+/Mac-2+ cells at different time points after ischemic (e) and hemorrhagic stroke (k). b, f Confocal images showed presynaptic protein synaptophysin (SYP+, green) and postsynaptic protein Homer-1+ (green) were engulfed by Iba-1+ microglia/macrophages (red) and GFAP+ astrocytes (red) in the reactive gliosis region at 14 days after MCAO. Left panel, low magnification of gliosis region in ischemic striatum; glial cell, red; synapse, green. Arrowheads indicate engulfed synapses. Bar = 100 µm and 10 µm. c, d TEM images showed engulfed synapses (blue) were contained in the cytoplasm of microglia/macrophages and astrocytes in the gliosis region following MCAO. High magnification images (right panel) from the box showed the engulfed synaptic structures with multivesicular and irregular membrane morphology (arrows) in microglia/macrophages and astrocytes. Bar = 1 µm and 200 nm. h, l Confocal images showed SYP+ (green) and Homer-1+ (green) were engulfed by Iba-1+ microglia/macrophages (red) in the microgliosis area, but few SYP+ (green) and Homer-1+ (green) were detected in GFAP+ astrocytes (red) in the astrogliosis area in the hemorrhagic brain. Left panel, low magnification of gliosis region in hemorrhagic striatum, glial cell, red; synapse, green. Arrowheads indicate engulfed synapses in microglia/macrophages. Bar = 100 µm and 5 µm. i, j TEM images showed engulfed synapses (blue) localized in the cytoplasm of microglia/macrophages but not in astrocytes following hemorrhagic stroke. High-magnification images (right panel) from the box (left panel) showed the synaptic inclusions (arrow) in microglia/macrophages but not in astrocytes. Bar = 1 µm and 200 nm. SI synaptic inclusion, AU arbitrary units. Statistics are derived from 18, 17 cells (d) and 20, 20 cells (j) (from left to right), n = 3 mice per group. Statistics are derived from 9, 8, 8, 11, 8, 8, 8, 11 slices (e) and 10, 13, 11, 13, 12, 13, 10, 11 slices (k) (from left to right), n = 4 mice per group. Statistics are derived from 14, 12, 11, 12 slices (f) and 14, 14, 13, 14 slices (l) (from left to right), n = 4 mice per group. d, j two-sided, unpaired Student’s t test. f, l two-way ANOVA followed by Tukey’s test. Data are mean ± SD. Source data are provided as a Source Data file.
Fig. 2
Fig. 2. Microglia/macrophages and astrocytes engulfed both excitatory and inhibitory synapses in stroke mice.
Colocalization assays showed microglia/macrophages (a, Iba-1+, white) and astrocytes (d, GFAP+, white) engulfed excitatory postsynaptic and inhibitory postsynaptic elements in the gliosis region at 14 days after MCAO. Arrows indicate mCherry-alone puncta within microglia/macrophages or astrocytes. Quantification comparing the volume of mCherry-alone synapses inside microglia/macrophages (b) or astrocytes (e). b, e Statistics are derived from 11 slices, n = 4 mice per group. Quantification showing the percentage of synaptic puncta inside/outside microglia/macrophages (c) or astrocytes (f) in the ischemic brain. Colocalization images showed mCherry-alone puncta within microglia/macrophages (g, white) or astrocytes (j, white) in the hemorrhagic brain. Quantification comparing the volume of mCherry-alone synapses inside microglia/macrophages (h) or astrocytes (k). Statistics are derived from 15, 12 slices (h) and 10, 10 slices (k) (from left to right), n = 4 mice per group. Quantification showing the percentage of synaptic puncta inside/outside microglia/macrophages (i) or astrocytes (l) in the hemorrhagic brain. Scale bar = 10 µm. ExPost excitatory postsynapse, InhiPost inhibitory postsynapse. AU arbitrary units. b, e, h, k, two-sided, unpaired Student’s t test. Data are mean ± SD.
Fig. 3
Fig. 3. Microglia/macrophages and astrocytes digested synaptic elements through lysosome in stroke mouse brain.
ad Representative images showed SYP+ (green) and Homer-1+ (green) signals in LAMP2+ lysosomes (red) in Iba-1+ microglia/macrophages (white) and GFAP+ astrocytes (white) in the ischemic brain. eh Representative images showed SYP+ (green) and Homer-1+ (green) signals in LAMP2+ lysosomes (red) in Iba-1+ microglia/macrophages (white) in the hemorrhagic brain, but rarely detected in GFAP+ astrocytes (white). Bar = 10 µm. a, c, e, g n = 4 mice per group. Data are mean ± SD.
Fig. 4
Fig. 4. Upregulation of MEGF10 and MERTK levels in mouse brain following ischemic and hemorrhagic stroke.
Western blotting and quantification of MEGF10 and MERTK protein levels (normalized to corresponding sham) in ischemic (a) and hemorrhagic mouse brain (k). Immunostaining showed MEGF10 (green) and MERTK (green) were expressed in Iba-1+ microglia/macrophages (red) and GFAP+ astrocytes (red) in ischemic (cf) and hemorrhagic stroke (mp). Arrows indicated colocalization of MEGF10 and MERTK with microglia/macrophages and astrocytes. Bar = 50 µm. Fluorescence in situ hybridization study showed MEGF10 (red) and MERTK (red) signals colocalized in Iba-1+ microglia/macrophages (green) and GFAP+ astrocytes (green) in ischemic (gj) and hemorrhagic stroke (qt), indicated by arrows. Bar = 50 µm. (b, l) N = 4 mice per group. (d, f, h, j, n, p, r, t) Statistics are derived from six slices, n = 3 mice per group. Data are mean ± SD.
Fig. 5
Fig. 5. Conditional MEGF10 or MERTK knockout increased both pre- and postsynaptic proteins in stroke mouse brain.
ad Representative images and quantification of the number of SYP+ (green) and Homer-1+ synapses (green) that engulfed by microglia/macrophages (red) or astrocytes (red) of MEGF10WT, MERTKWT, C-MEGF10KO, C-MERTKKO, A-MEGF10KO, and A-MERTKKO mice at 14 days of ischemic stroke, respectively. Bar = 10 µm. Statistics are from 15, 15, 20, 15, 15, 15, 17, 15 slices (b) and 10, 15, 14, 15, 10, 15, 10, 12 slices (d) (from left to right), n = 4 mice per group. eh Western blotting and quantification of SYP and Homer-1 levels in control and knockout mice following MCAO. N = 9, 8, 9, 9, 9, 8, 9, 8 mice (f) and 9, 9, 9, 9, 8, 9, 9, 9 (h) mice (from left to right). ik Representative images and quantification of the synapse density of SYP+ (green) and PSD95+ synapses (red) in ischemic brain. Bar = 10 µm. Statistics are from 13, 12, 9, 13, 12, 9, 13, 12, 9 slices (j) and 13, 13, 12, 13, 13, 12, 13, 13, 12 slices (k) (from left to right), n = 4 mice per group. lo Representative images and quantification of the number of SYP+ (green) and Homer-1+ synapses (green) that engulfed by microglia/macrophages (red) or astrocytes (red) in MEGF10WT, MERTKWT, C-MEGF10KO, C-MERTKKO, A-MEGF10KO and A-MERTKKO mice at 14 days of hemorrhagic stroke, respectively. Bar = 10 µm. Statistics are derived from 13, 11, 15, 13, 13, 13, 13, 13 (m) and 10, 12, 12, 13, 10, 12, 13, 12 (o) (from left to right), n = 4 mice per group. ps Western blotting and quantification of SYP and Homer-1 levels in control and knockout mice following hemorrhagic stroke. N = 7, 8, 7, 8, 6, 9, 7, 8 mice (q) and 7, 9, 7, 9, 7, 9, 7, 9 mice (s) (from left to right). tv Representative images and quantification of the synapse density of SYP+ (green) and PSD95+ synapses (red) in hemorrhagic brain. Bar = 10 µm. Statistics are derived from 10, 12, 12, 10, 12, 12, 10, 12, 12 slices (u) and 11, 12, 12, 10, 12, 12, 12, 12, 12 slices (v) (from left to right), n = 4 mice per group. For all quantification data, two-way ANOVA followed by Tukey’s test. Data are mean ± SD.
Fig. 6
Fig. 6. Conditional MEGF10 or MERTK knockout reduced glial cell-mediated synapse engulfment after stroke.
ad TEM images showed Iba-1+ microglia/macrophages and GFAP+ astrocytes in the gliosis region enwrapped engulfed synaptic elements in MEGF10WT and MERTKWT mice, but the number of engulfed synaptic elements were reduced in C-MEGF10KO, C-MERTKKO, A-MEGF10KO, and A-MERTKKO mice after ischemic stroke. Arrowheads indicate synaptic elements that were engulfed by microglia/macrophages (a, b) or astrocytes (c, d). Statistics are derived from 36, 32, 36, 31 cells (b) and 36, 36, 36, 36 cells (d) (from left to right), n = 3 mice per group. eh TEM images showed Iba-1+ microglia/macrophages in the gliosis region contained synaptic elements in MEGF10WT and MERTKWT mice (e, f); while synaptic elements were rarely detected in GFAP+ astrocytes (g, h). Statistics are derived from 36, 36, 36, 36 cells (f) and 34, 34, 30, 34 cells (h) (from left to right), n = 3 mice per group. Bar = 200 nm. One-way ANOVA followed by Tukey’s test. Data are mean ± SD.
Fig. 7
Fig. 7. Conditional knockout of MEGF10 and MERTK increased dendritic spine density in stroke mice.
a Schematic diagram of different morphology of dendritic spines. b Low magnification of Golgi staining images of neuron in the gliosis region. The experiment was repeated at least three times independently. Scale bar = 20 μm. The red box indicates the region of high magnification of spines in the secondary dendrite as shown in c and h. Representative images of dendritic spines and bar graph showed the percentage of each spine types (d, i) and the number of total spines (e, j), mature spines (including stubby, mushroom, and branched spines) (f, k) and filopodia spines (g, l) of MEGF10WT, MERTKWT, C-MEGF10KO, C-MERTKKO, A-MEGF10KO, A-MERTKKO mice at 14 days after ischemic (dg) and hemorrhagic stroke (i–l). Statistics are derived from 12, 12, 10, 12, 12, 10 slices (e), 12, 12, 10, 12, 10, 10 slices (f) and 11, 11, 9, 11, 11, 9 slices (g) (from left to right), n = 4 mice per group. Statistics are derived from 11, 12, 11, 10, 12, 12 slices (j), 11, 12, 11, 10, 12, 11 slices (k), and 10, 10, 11, 11, 10, 10 slices (l) (from left to right), n = 4 mice per group. One-way ANOVA followed by Dunnett’s test. Data are mean ± SD.
Fig. 8
Fig. 8. Conditional MEGF10 or MERTK knockout in microglia/macrophages or astrocytes differentially affected brain impairment in mice after ischemic and hemorrhagic stroke.
ad Cresyl violet-stained brain sections and quantification of atrophy volume of MEGF10WT, C-MEGF10KO, A-MEGF10KO, MERTKWT, C-MERTKKO, and A-MERTKKO mice at 14 days after ischemic stroke. Black dashed lines indicate brain atrophy. N = 10, 8, 9 mice (b) and 12, 10, 8 mice (d) (from left to right). eh Cresyl violet-stained brain sections and quantification of lateral ventricle volume of hemorrhagic mice. Red dashed lines indicate lateral ventricle of ipsilateral brain. N = 7, 6, 7 mice (f) and 6, 7, 7 mice (h) (from left to right). One-way ANOVA followed by Dunnett’s test. Data are mean ± SD.
Fig. 9
Fig. 9. Conditional MEGF10 or MERTK knockout in microglia/macrophages or astrocytes differentially affected behavioral outcomes in mice after ischemic and hemorrhagic stroke.
mNSS (a, b) and rotarod test (cd) were performed to examine the neurobehavioral outcomes of ischemic mice. *, MEGF10WT VS C-MEGF10KO, MERTKWT VS C-MERTKKO; #, MEGF10WT VS A-MEGF10KO, MERTKWT VS A-MERTKKO. N = 17, 12, 13 mice (a); 19, 12, 11 mice (b); 11, 12, 10 mice (c); and 19, 13, 11 mice (d) (day 14, from left to right). e Representative images showed travel patterns in the smart cage. f, g Quantification of the time that mice of different groups stayed in the dark zone. N = 22, 17, 17 (f) and 22, 16, 15 mice (g) (from left to right). mNSS (hi), rotarod test (jk), and grid-walking test (lm) were used to examine neurobehavioral outcomes of hemorrhagic mice at different time points. hk *, MEGF10WT VS C-MEGF10KO, MERTKWT VS C-MERTKKO; &, MEGF10WT VS A-MEGF10KO, MERTKWT VS A-MERTKKO. N = 21, 12, 10 mice (h); 11, 11, 13 mice (i); 12, 14, 11 mice (j); and 11, 14, 11 mice (k) (day 14, from left to right). N = 11, 14, 13, 11, 13, 12 mice (l) and 11, 10, 11, 10, 10, 11 mice (m) (from left to right). ad, hm Two-way ANOVA followed by Tukey’s test; f, g one-way ANOVA followed by Tukey’s test. Data are mean ± SD.
Fig. 10
Fig. 10. scRNA-seq revealed phagocytosis-related gene expression difference of astrocytes between ischemic and hemorrhagic stroke.
a tSNE map showed the expression profiles of the striatum in control, ischemic and hemorrhagic mice, respectively. b Heatmap showed fold change of top 20 genes. c Dot plot showing MEGF10 and MERTK expression in astrocytes. d Bar chart showed phagocytosis-related GO and KEGG pathways that downregulated in hemorrhagic stroke (HS), as compared with ischemic stroke (IS). Representative terms were shown in rows and −log10 (p) in columns. e tSNE map showed subclusters of astrocytes in IS and HS. f Violin plots showed top marker genes in specific astrocyte subclusters. g Bar chart showed phagocytosis-related GO and KEGG terms enriched in subcluster 3 of astrocytes.

References

    1. Mahon S, et al. Primary prevention of stroke and cardiovascular disease in the community (PREVENTS): Methodology of a health wellness coaching intervention to reduce stroke and cardiovascular disease risk, a randomized clinical trial. Int J. Stroke. 2018;13:223–232. - PubMed
    1. Wanner IB, et al. Glial scar borders are formed by newly proliferated, elongated astrocytes that interact to corral inflammatory and fibrotic cells via STAT3-dependent mechanisms after spinal cord injury. J. Neurosci. 2013;33:12870–12886. - PMC - PubMed
    1. Dyck SM, Karimi-Abdolrezaee S. Chondroitin sulfate proteoglycans: key modulators in the developing and pathologic central nervous system. Exp. Neurol. 2015;269:169–187. - PubMed
    1. Hammond TR, et al. Astrocyte-derived endothelin-1 inhibits remyelination through notch activation. Neuron. 2014;81:1442. - PubMed
    1. Faulkner JR, et al. Reactive astrocytes protect tissue and preserve function after spinal cord injury. J. Neurosci. 2004;24:2143–2155. - PMC - PubMed

Publication types

MeSH terms