. 2021 Nov 26;12(1):6931.
doi: 10.1038/s41467-021-27190-y.

CRISPR-enhanced human adipocyte browning as cell therapy for metabolic disease

Affiliations

CRISPR-enhanced human adipocyte browning as cell therapy for metabolic disease

Emmanouela Tsagkaraki et al. Nat Commun. .

Abstract

Obesity and type 2 diabetes are associated with disturbances in insulin-regulated glucose and lipid fluxes and severe comorbidities including cardiovascular disease and steatohepatitis. Whole body metabolism is regulated by lipid-storing white adipocytes as well as "brown" and "brite/beige" adipocytes that express thermogenic uncoupling protein 1 (UCP1) and secrete factors favorable to metabolic health. Implantation of brown fat into obese mice improves glucose tolerance, but translation to humans has been stymied by low abundance of primary human beige adipocytes. Here we apply methods to greatly expand human adipocyte progenitors from small samples of human subcutaneous adipose tissue and then disrupt the thermogenic suppressor gene NRIP1 by CRISPR. Ribonucleoprotein consisting of Cas9 and sgRNA delivered ex vivo are fully degraded by the human cells following high efficiency NRIP1 depletion without detectable off-target editing. Implantation of such CRISPR-enhanced human or mouse brown-like adipocytes into high fat diet fed mice decreases adiposity and liver triglycerides while enhancing glucose tolerance compared to implantation with unmodified adipocytes. These findings advance a therapeutic strategy to improve metabolic homeostasis through CRISPR-based genetic enhancement of human adipocytes without exposing the recipient to immunogenic Cas9 or delivery vectors.


Conflict of interest statement

The authors declare the following competing Interests: M.P.C. and A.J.G. are inventors of granted US Patent #8,519,118, “RIP140 regulation of glucose transport”, and of granted US Patent #8,093,223, “RIP140 regulation of diabetes”, related to data in this paper on Nrip1/RIP140-depleted mouse and human adipocytes. SC is inventor on granted US Patent #10,093,902, “Human adipose tissue white and brown-on-white progenitors for reconstructive and metabolic therapies”, related to data in this paper on human adipose progenitors and human adipocytes. M.P.C., S.C., E.T., and S.M.N. are inventors of pending US Patent application #63/089,955, “Targeting Nrip1 to Alleviate Metabolic Disease”, related to CRISPR-based depletion of Nrip1 in mouse and human adipocytes in this paper. The University of Massachusetts is the grantee or potential grantee of all of the above. MPC and SC declare that they are bound by confidentiality agreements that prevent them from disclosing a potentially competing interest in this work. E.J.S. is a co-founder and scientific advisor of Intellia Therapeutics. The remaining authors declare no competing interests.

Figures

Fig. 1
Fig. 1. High efficiency Nrip1 gene disruption at 7 loci by SpyCas9/sgRNA RNPs produces variable degrees of NRIP1 protein loss and UCP1 upregulation in murine primary adipocytes.
a Mapping of the sgRNAs M1-M7 targeting various loci of murine Nrip1 coding region which is entirely located in exon 4 (TSS transcription start site, STOP stop codon). b Time-course of SpyCas9 protein degradation detected by Western Blotting in cell lysates at various time points (0–72 h and day 11 after transfection, which is day 6 of differentiation) after electroporation with RNPs of SpyCas9:sgRNA (3:4 μM). Sup denoted supernatant containing SpyCas9 at 0 h. c Sanger sequencing traces of control vs Nrip1 disrupted cells with sgRNA-M6 showing the sgRNA binding site (solid black line), PAM (red), the double-strand-break (denoted as DSB) site (dashed black line) on the sgRNA-M6 targeting locus and the traces downstream of the DSB created by the DNA repair mechanisms (figure created with SnapGene). d Editing efficiency as evaluated with indel percentage 72 h after the transfection of primary preadipocytes (blue) and differentiation to mature primary adipocytes (orange). e Indel distribution of Nrip1 sgRNA-M6 with frameshift indels that are sustained after differentiation. f Nrip1 gene expression detected by RT-PCR in mature adipocytes targeted with the different sgRNAs. g Immunoprecipitation assay for NRIP1 (140 kDa, arrows at right) in mature primary adipocytes on day 6 post differentiation targeted with the different sgRNAs. The total lysate protein amount used in the assay was 250 μg per sample. M denotes molecular weight marker. Dashed lines separate different gels. h Ucp1 expression by RT-PCR in mature adipocytes targeted with the different sgRNAs compared to non-targeted control cells. i Western blot for UCP1 protein (33 kDa) in mature adipocytes on day 6 post differentiation targeted with the different sgRNAs. Lanes 1–8 were loaded with 20 μg of total protein while lane 9 was loaded with 5 μg οf total protein isolated from mouse BAT. NTC non-targeting control. In (d, e, f and h) bars denote mean and error bars denote Mean ± S.E.M. n ≥ 3 biologically independent replicates. Detailed n per condition and molecular weight markers in (b) and (i) are shown in the source data.
Fig. 2
Fig. 2. Primary mouse NRIP1KO adipocytes from both male and female mice display increased thermogenic gene expression and uncoupled oxygen consumption.
a, b Ucp1, Cidea, Fabp3 and thermogenic gene expression, fold change over NTC. In (a, b) male = blue (n = 3), female = peach (n = 3). Error bars denote mean ± SEM. c UCP1 (33 kDa) protein expression in primary adipocytes, 6 days post differentiation with various RNP concentrations. Lanes 1 to 6 contain 20 μg of protein lysate and lane 8 contains 2.5 μg of protein lysate from mouse BAT. Tubulin, as loading control. d Oxidative phosphorylation protein expression in primary male adipocytes on day 7 post differentiation targeted with NTC or NRIP1 sgRNA-M1-M7. Lanes 1 to 8 contain 20 μg protein while lane 9 contains 2.5 μg protein (mouse BAT). GAPDH, loading control. e Oxygen consumption rates (OCR) in mature primary male adipocytes targeted with NTC or NRIP1 sgRNA-M6 without norepinephrine (NE) stimulation and (f) with NE stimulation. Statistical comparison for OCR in technical replicates was done for (e, f) using one-way ANOVA with Sidak’s multiple comparison test. ****p < 0.0001 (g). Summary of OCR in panels (e, f) at 40 min in primary male adipocytes with and without NE stimulation. Statistical comparison using two – way ANOVA with Sidak’s multiple comparison test. ****p < 0.0001, ***p = 0.0003. h OCR in mature primary female adipocytes targeted with NTC or NRIP1 sgRNA-M6 without NE stimulation and (i) with NE stimulation. Statistical comparison for OCR technical replicates for (h, i) was using one-way ANOVA with Sidak’s multiple comparison test. ****p < 0.0001 (j). Summary of OCR at 40 min in primary female adipocytes. Statistical comparison using two – way ANOVA with Sidak’s multiple comparison test. NE **p = 0.0065, NE + Oligo *p = 0.0112, NE + FCCP ***p = 0.0005. Biological replicates confirmed the increased OCR by NE treated NripKO cells compared to NE treated NTC cells (p = 0.02, n = 4) as well as increased OCR by NE treated NripKO cells plus oligomycin compared to NE plus oligomycin in NTC cells (p = 0.03, n = 4) (Supplementary Fig. 3). Molecular weight markers in (c and d) are shown in the source data. Error bars in (ej) denote mean ± SEM.
Fig. 3
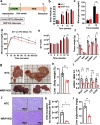
Fig. 3. Implantation of NRIP1-depleted mouse adipocytes improves glucose tolerance and markedly decreases iWAT weight and liver triglyceride accumulation in recipient mice.
Mice were implanted with either mouse adipocytes previously transfected with NTC sgRNA/Cas9 RNPs or with sgRNA-M6/Cas9 RNPs (NRIP1KO). a Schematic protocol of implantation of murine NTC adipocytes or NRIP1KO adipocytes into C57BL/6 wild type mice followed by 60% kCal fat diet (HFD). b Total body weights of recipients on chow before implantation and 6, 9, 12, 15 weeks after implantation on HFD. P values *9 weeks = 0.034; **12 weeks = 0.008; 15 weeks = 0.058 c Fasting blood glucose concentrations at baseline (p = 0.626) and 12 weeks (p = 0.005) post implantation (6 weeks on HFD). d Glucose tolerance test (GTT) after 16-hour overnight fasting in implant recipients after 9 weeks on HFD. P values *45 min = 0.015; *60 min = 0.011; **90 min = 0.004; *120 min = 0.022 e Bar graphs of areas under the curve from GTTs in implant recipient mice on chow and after 9, 12 and 15 weeks on HFD. P values *12 weeks = 0.022; *15 weeks = 0.016. f Weight of total bilateral implants, whole BAT, total bilateral iWAT, epiWAT and total liver as measured after dissection. P values **iWAT = 0.004; **Liver = 0.005. g Macroscopic images of the whole livers of the implant recipients after dissection (square = 1 cm2). h Liver over whole body weight percentage. p = 0.008. i Expression of genes related to inflammation and hepatic steatosis in the livers of implant recipients detected by RT-PCR. P values *Mcp1 = 0.02; ***Tnfa = 0.00001; **Il1b = 0.001; ****Cd36 < 0.000001. j Hematoxylin and eosin (H&E) stain on liver histology of the implant recipients at 20X magnification. k Quantification of total H&E images of implant recipients’ livers for total area occupied by lipid droplets per field (p = 0.011). l Triglyceride measurements in pulverized liver extracts after dissection. (p = 0.001). black = NTC adipocyte implant recipients, red = NRIP1KO adipocyte implant recipients; in be: NTC (n = 13); NRIP1KO (n = 14), in fl: NTC (n = 4); NRIP1KO (n = 3). Each n represents number of biologically independent mice. Bars represent the mean. Error bars denote mean ± SEM. *p < 0.05, **p < 0.01, ***p < 0.001 by unpaired two-tailed T test.
Fig. 4
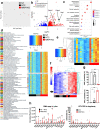
Fig. 4. RNA sequencing on non-treated, NTC and NRIP1KO mature adipocytes on day 6 after differentiation.
a Principal component plot prior to DEseq analysis. b Volcano plot of upregulated (red) and downregulated (blue) genes between control unedited adipocytes (NT and NTC) and NRIP1KO adipocytes with highlighted (green) Ucp1, Cidea, Fabp3, Nrg4. c Top 10 pathways associated with all upregulated genes detected. d Heatmap of pathway analysis of upregulated genes ranked according to the p value. e Heatmap of the 78 genes associated with cellular respiration that were upregulated in NRIP1KO adipocytes. f Heatmap of genes related to thermogenesis. Arrow shows Ucp1. g Browning probability calculated using the ProFAT online tool. p = 0.0004 by One-way ANOVA. h Left: top 15 upregulated genes by RNA sequencing where all NRIP1KO samples have >1000 normalized reads and padj > 0.1 (Black = NTC + NT) and NT, (Red = NRIP1KO). Right: Screening of these 15 genes in the excised implant NTC (black) or NRIP1KO (red) tissue by RT-PCR. P values *Ucp1 = 0.011; **Otop1 = 0.0017; *Cidea = 0.013; *Acaa2 = 0.018 by unpaired two-tailed T-test. Cut-offs were set at padj < 0.1 and fold change > 1.3. NT (n = 3), NTC (n = 5), NRIP1KO (n = 5). NRIP1KO adipocytes were transfected with SpyCas9 and either Nrip1 sgRNA-M4 or sgRNA-M6.
Fig. 5
Fig. 5. High efficiency NRIP1 disruption in human adipocytes by SpyCas9 reveals variable UCP1 upregulation in a screen of sgRNAs targeting different loci of NRIP1.
a Mapping of sgRNAs H1-H6 screened against human NRIP1 coding region entirely located in exon 4. b Editing efficiency as evaluated with indel percentage 72 h after the transfection of primary preadipocytes (blue) and differentiation to mature primary adipocytes (orange). c Indel distribution of NRIP1 sgRNA-H5 with frameshift indels that are sustained after differentiation. d Microscopic image of cell culture of non-targeted control (top) and NRIP1 disrupted (bottom) mature adipocyte morphology in cell culture at 10X magnification and scale bar represents 400 μm. e NRIP1 gene expression by RT-PCR in mature adipocytes on day 7 post differentiation targeted with the different sgRNAs. f Immunoprecipitation assay for NRIP1 (140 kDa, arrows at right) in mature human adipocytes on day 7 post differentiation targeted with the different sgRNAs. The total protein lysate amount used in the assay was 250 μg per sample. M denotes molecular weight marker. g UCP1 expression by RT-PCR in mature adipocytes on day 7 post differentiation targeted with the different sgRNAs compared to non-targeted control cells. h Western blot for UCP1 protein (33 kDa) in mature adipocytes on day 7 post differentiation targeted by the sgRNAs-H4 and -H5 with two different electroporation optimization protocols. Lanes 2–6 were loaded with 20 μg of total protein while lane 9 was loaded with 2.5 μg οf total protein isolated from mouse BAT. i UCP1 gene expression by RT-PCR in non-targeted control or NRIP1 depleted adipocytes on day 7 post differentiation after a 7-hour stimulation of forskolin 10 μM or vehicle. NTC non-targeting control. Bars denote mean. Error bars denote Mean ± S.E.M, n ≥ 3 biological replicates. In (f, h) M denotes molecular weight marker.
Fig. 6
Fig. 6. RNA sequencing on human NTC and NRIP1KO mature adipocytes on day 7 after differentiation.
a Heatmap of all differentially expressed genes between NTC and NRIP1KO based on normalized read counts. b Top 10 pathways associated with all upregulated genes detected. c Heatmap of genes associated with cellular respiration that were upregulated in NRIP1KO adipocytes. d Heatmap of pathway analysis of upregulated genes ranked by the p value. e Browning probability calculated using the ProFAT online tool. *P = 0.037 by unpaired T test. f Heatmap of genes related to thermogenesis that were found highly expressed in the NRIP1KO samples compared to the NTC. Cut-offs were set at padj < 0.1 and fold change > 1.3. NTC (n = 5), NRIP1KO (n = 5). NRIP1KO adipocytes were transfected with SpyCas9 and NRIP1 sgRNA-H5. Bars denote Mean and error bars denote Mean ± S.E.M.
Fig. 7
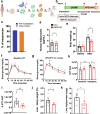
Fig. 7. Implantation of NRIP1-targeted human adipocytes decreases body weight as well as liver triglyceride, and enhances glucose tolerance in recipient immunocompromised, HFD fed NSG mice.
Mice were implanted with either human adipocytes previously treated with NTC sgRNA/Cas9 RNPs or with sgRNA-H5/Cas9 RNPs (NRIP1KO). a Study description: (1) adipose tissue isolation from a human donor during panniculectomy, (2) harvesting of human primary preadipocytes after development Cas9/sgRNA RNPs were delivered into the human preadipocytes by electroporation followed by (3) expansion 1:6 of the genetically modified preadipocytes and (4) their differentiation into mature adipocytes; (5) Implantation of non-targeted control (NTC) sgRNA treated adipocytes versus the NRIP1 depleted adipocytes was performed in the dorsal area of NSG mice. b Schematic protocol of implantation of human NTC adipocytes or NRIP1KO adipocytes into NSG mice followed by HFD feeding. c Editing efficiency as evaluated with percentage of indels in the mature adipocytes transfected with NRIP1KO sgRNA-H5 before implantation (blue) and indel percentage in the genomic DNA isolated from the NRIP1 depleted implants 15 weeks following transplantation. d Human adiponectin levels detected in the plasma of NSG recipients 9 weeks following transplantation for the assessment of engraftment and functionality of the implants. P = 0.812 (ns). e Total body weight of NSG mouse recipients before transplantation (left) and after 3 weeks on HFD and thermoneutrality (right). f Baseline glucose tolerance test after 16 h. fasting before transplantation. *p = 0.029. g Glucose tolerance test after 3 weeks on HFD and thermoneutrality. P values **30 min = 0.006; *75 min = 0.023; *105 min = 0.017. h Glucose tolerance areas under the curve (GTT AUC) before transplantations (left) and 3 weeks after HFD under thermoneutrality (right). **p = 0.002; *p = 0.033. i Matched difference of the GTT AUC before transplantations (left) and 3 weeks after HFD and thermoneutrality (right). **P = 0.001. j Liver over whole body weight percentage. P = 0.012. k Triglyceride measurements in pulverized liver extracts after dissection. P = 0.036. Black = NTC cell implant recipients (n = 4); red = NRIP1KO cell implant recipients (n = 6). Each n represents number of biologically independent mice. Bars denote mean, error bars denote mean ± SEM. *p < 0.05, **p < 0.01 by unpaired T test. NRIP1KO adipocytes were transfected with SpyCas9 and NRIP1 sgRNA-H5.

References

    1. Pittenger MF, et al. Mesenchymal stem cell perspective: cell biology to clinical progress. NPJ Regen. Med. 2019;2:22. - PMC - PubMed
    1. Kean LS. Defining success with cellular therapeutics: the current landscape for clinical end point and toxicity analysis. Blood. 2018;131:2630–2639. - PMC - PubMed
    1. Rosenberg SA, Restifo NP. Adoptive cell transfer as personalized immunotherapy for human cancer. Science. 2015;348:62–68. - PMC - PubMed
    1. Finck A, Gill SI, June CH. Cancer immunotherapy comes of age and looks for maturity. Nat. Commun. 2020;11:3325. - PMC - PubMed
    1. Czech MP. Insulin action and resistance in obesity and type 2 diabetes. Nat. Med. 2017;23:804–814. - PMC - PubMed

Publication types

MeSH terms

Substances