. 2021 Nov 26;12(1):6921.
doi: 10.1038/s41467-021-27225-4.

Multi-decadal increase of forest burned area in Australia is linked to climate change

Affiliations

Multi-decadal increase of forest burned area in Australia is linked to climate change

Josep G Canadell et al. Nat Commun. .

Abstract

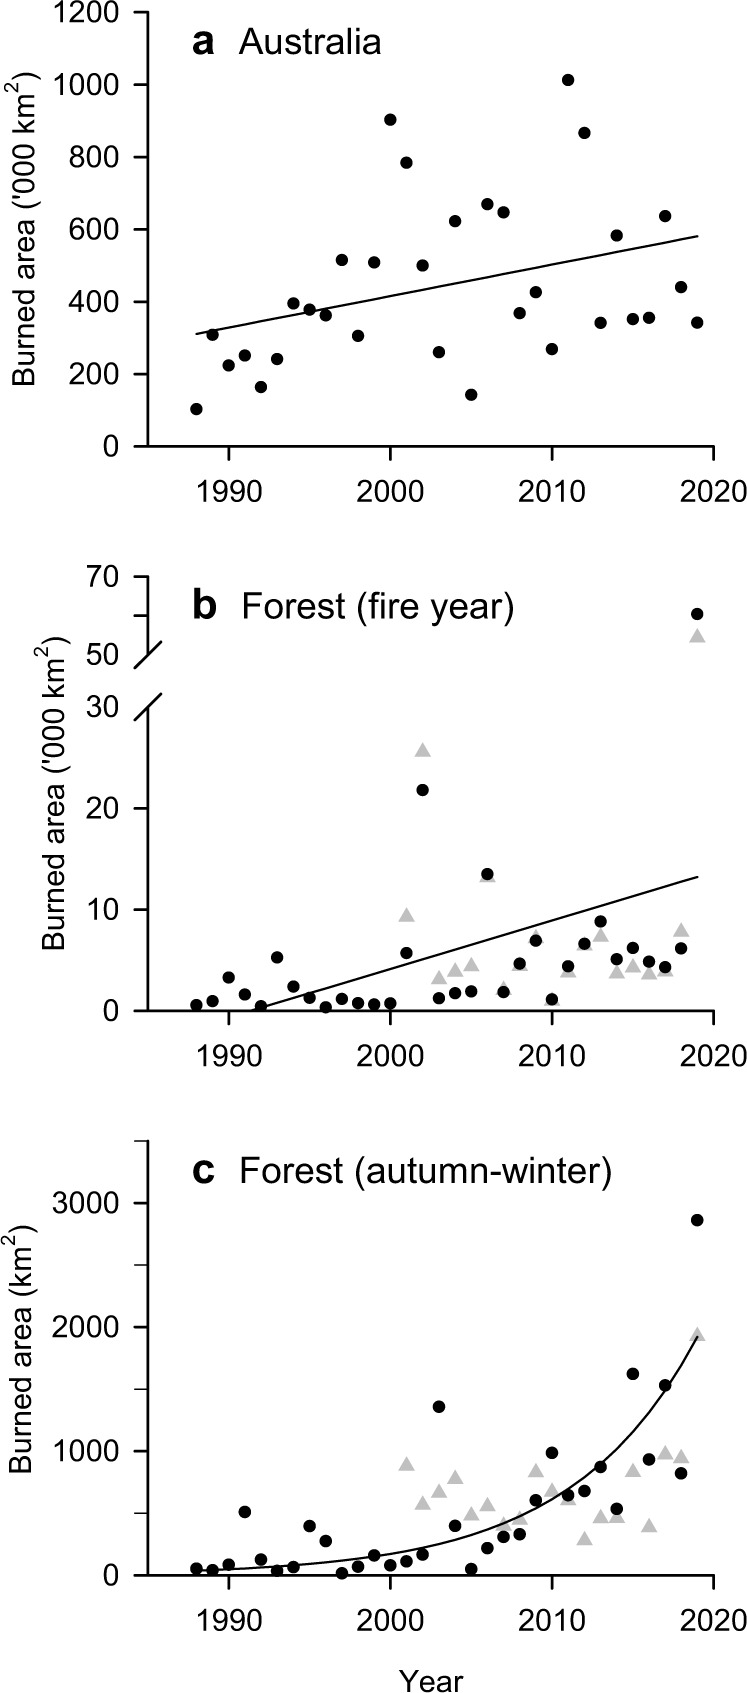
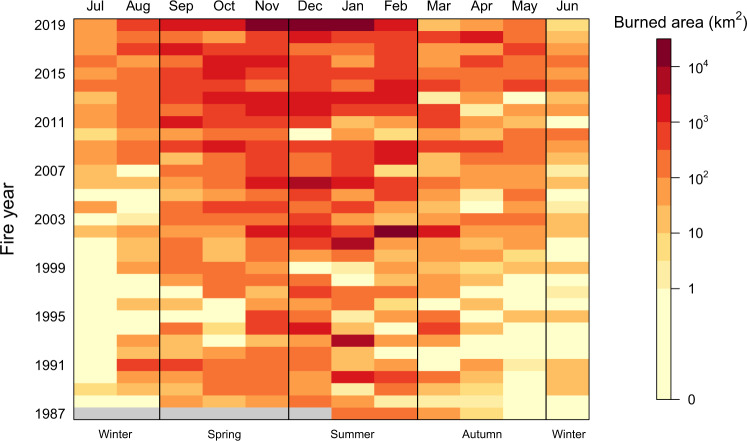
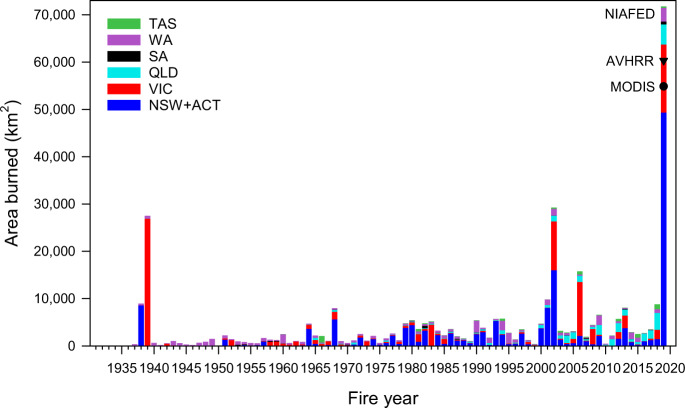
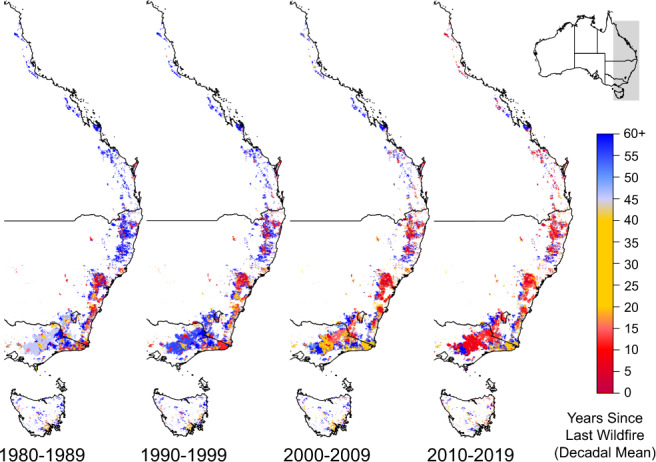
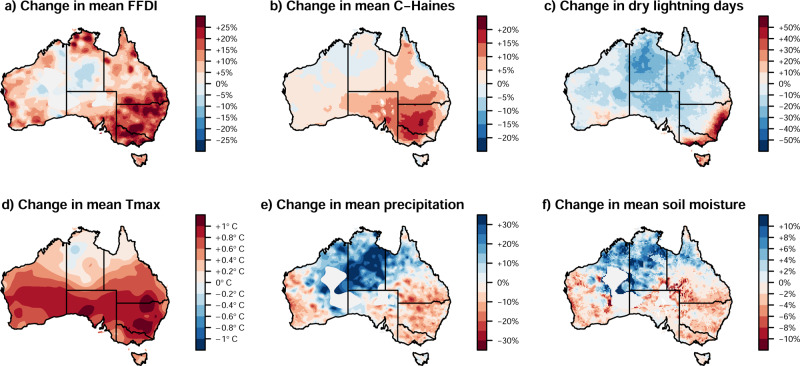
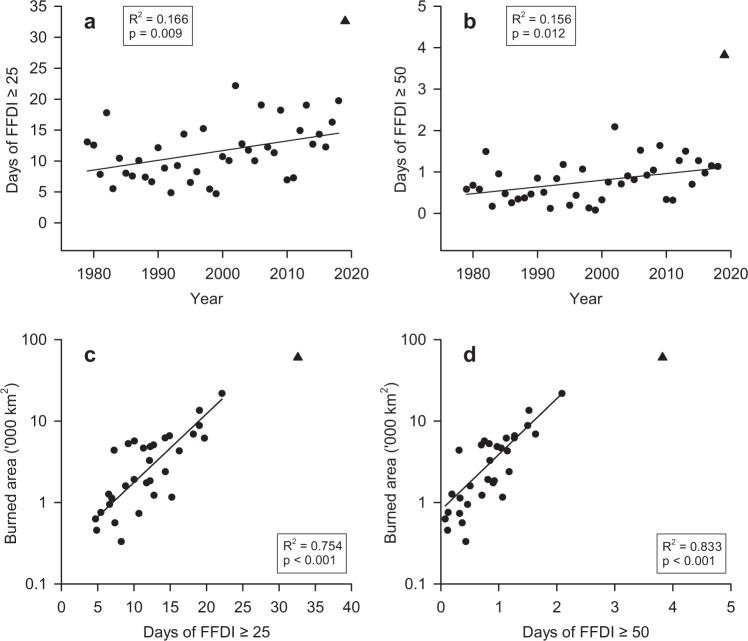
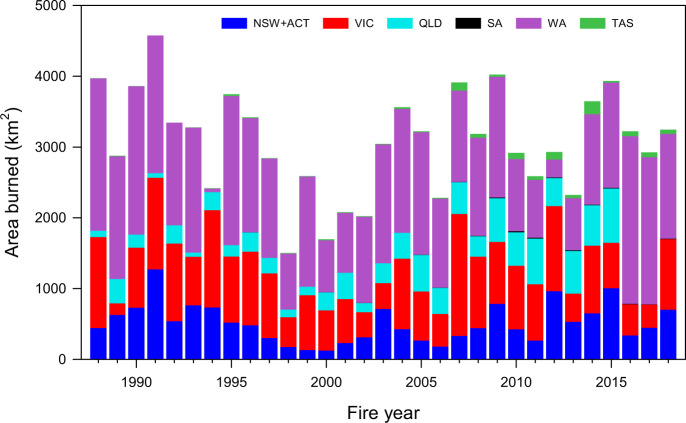
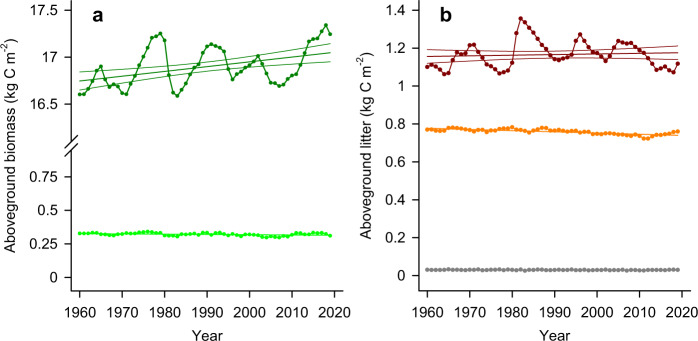
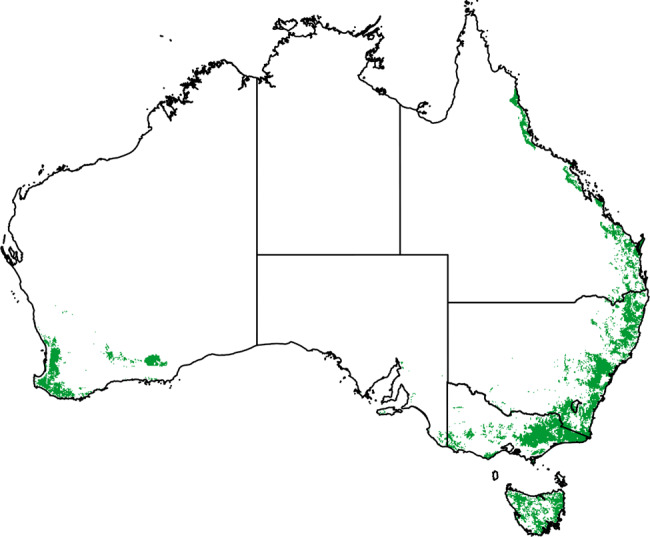
Fire activity in Australia is strongly affected by high inter-annual climate variability and extremes. Through changes in the climate, anthropogenic climate change has the potential to alter fire dynamics. Here we compile satellite (19 and 32 years) and ground-based (90 years) burned area datasets, climate and weather observations, and simulated fuel loads for Australian forests. Burned area in Australia's forests shows a linear positive annual trend but an exponential increase during autumn and winter. The mean number of years since the last fire has decreased consecutively in each of the past four decades, while the frequency of forest megafire years (>1 Mha burned) has markedly increased since 2000. The increase in forest burned area is consistent with increasingly more dangerous fire weather conditions, increased risk factors associated with pyroconvection, including fire-generated thunderstorms, and increased ignitions from dry lightning, all associated to varying degrees with anthropogenic climate change.


Conflict of interest statement

The authors declare no competing interests.

Figures

Fig. 1
Fig. 1. Burned area (km2) for each fire year (July to June) from 1988 to 2019.
a Whole of continental Australia including Tasmania, linear fit; (b) Australian forests, linear fit; and (c) Australian forests for the Austral autumn/winter seasons (March to August), exponential fit (regressions in Supplementary Table 1). Data: AVHRR-Landgate (1988–2019, dots) and MODIS (2002–2019, triangles). Regressions are calculated using AVHRR-Landgate, and MODIS is shown for comparison.
Fig. 2
Fig. 2. Monthly burned forest area for fire years (July to June).
Data: AVHRR-Landgate (1988–2019).
Fig. 3
Fig. 3. Wildfire burned area by states and territory in forest ecosystems for the 1930 to 2019 fire years.
New South Wales and Australian Capital Territory (dark blue), Victoria (red), Queensland (light blue), South Australia (black), Western Australia (violet) and Tasmania (green). Data for 1930–2018 stacked bars are State and Territory agencies fire histories, supplemented with MODIS for Queensland in 2016–2018. Data for 2019 fire year are National Indicative Aggregated Fire Extent Dataset (NIAFED) by States and Territories (stacked bar), AVRHRR-Landgate (filled triangle), and MODIS (filled circle). See “Methods”: Burned area data.
Fig. 4
Fig. 4. Number of years since the last wildfire (decadal mean) for forested areas.
Analysis based on forested areas that have burned at least once since fire records began in the 1930s for most states. Spatial resolution is 250-metres. Data: State and Territory fire histories.
Fig. 5
Fig. 5. Climate change factors associated with wildfire weather and activity.
a Near-surface fire weather conditions based on the Forest Fire Danger Index, (b) mid-tropospheric fire weather conditions based on the C-Haines Index, (c) dry lightning conditions as key factors for ignitions, (d) daily maximum temperature, (e) annual rainfall deficit and (f) soil moisture (0–23 cm) associated with dryness of the forest system. Changes are calculated as the changes from 1980–1999 to 2000–2019, calendar years, for all variables except for dry lightning to 2000–2016. Grey areas in (e) and (f) denote areas with insufficient data availability.
Fig. 6
Fig. 6. Trends in the number of days with very high or severe Forest Fire Danger Index.
Trends in the number of days in which Forest Fire Danger Index (FFDI) equals or exceeds (a) 25, linear fit, or (b) 50, linear fit, over the fire years of 1979 to 2018 and averaged over forest ecosystems in Australia (Supplementary Table 1). Relationship between FFDI (c) ≥ 25 (exponential fit) and (d) ≥50 (exponential fit) and burned area for the fire years of 1988 to 2019 (Supplementary Table 1, Supplementary Fig. 6c,d). 2019 fire year (triangle). Burned area data: NOAA-Landgate (1988–2019).
Fig. 7
Fig. 7. Area of prescribed burning in forest ecosystems.
Data from the States and Territories fire histories for New South Wales and Australian Capital Territory (NSW + ACT, dark blue), Victoria (VIC, red), Queensland (QLD, light blue), South Australia (SA, black), Western Australia (WA, violet) and Tasmania (TAS, green). Queensland data for 2016-2019 is not available.
Fig. 8
Fig. 8. Modelled aboveground biomass and litter fractions of forested areas.
a Aboveground woody biomass (dark green, with 95% confidence interval) and leaf biomass (light green), and (b) litter fractions of forests derived from BIOS-CABLE with varying observed CO2 and climate. Coarse woody debris (dark red, with 95% confidence interval), fine litter (orange), very fine litter (grey).
Fig. 9
Fig. 9. Forest ecosystems distribution used in our study.
The following vegetation types from the Australian National Forest Inventory are included (250 m spatial resolution): Eucalypt low closed, Eucalypt low open, Eucalypt low woodland, Eucalypt medium closed, Eucalypt medium open, Eucalypt medium woodland, Eucalypt tall closed, Eucalypt tall open, Eucalypt tall woodlands, Rainforest, Leptospermum, Banksia, Other native forest, Softwood plantation, Hardwood plantation, Mixed species plantation and Other forests (unallocated types). Nominal forest types occurring in savanna, rangeland, and littoral ecosystems are not included: Callitris, Casuarina, Eucalypt Mallee, Mangrove, Melaleuca.

References

    1. Boer MM, Jager HI, Coutant CC. Knitting while Australia burns. Nat. Clim. Chang. 2020;10:170.
    1. Clarke H, et al. The proximal drivers of large fires: a pyrogeographic study. Front. Earth Sci. 2020;8:1–11.
    1. King AD, Pitman AJ, Heley BJ, Ukkola AM, Brown JR. The role of climate variability in Australian drought. Nat. Clim. Chang. 2020;10:177–179.
    1. Abatzoglou JT, Williams AP, Barbero R. Global emergence of anthropogenic climate change in fire weather indices. Geophys. Res. Lett. 2019;46:326–336.
    1. Abram NJ, et al. Connections of climate change and variability to large and extreme forest fires in southeast Australia. Commun. Earth Environ. 2021;2:1–17.

Publication types