. 2021 Nov 26;11(1):22993.
doi: 10.1038/s41598-021-02463-0.

Latency-associated DNA methylation patterns among HIV-1 infected individuals with distinct disease progression courses or antiretroviral virologic response

Affiliations

Latency-associated DNA methylation patterns among HIV-1 infected individuals with distinct disease progression courses or antiretroviral virologic response

Nathalia Mantovani et al. Sci Rep. .

Abstract

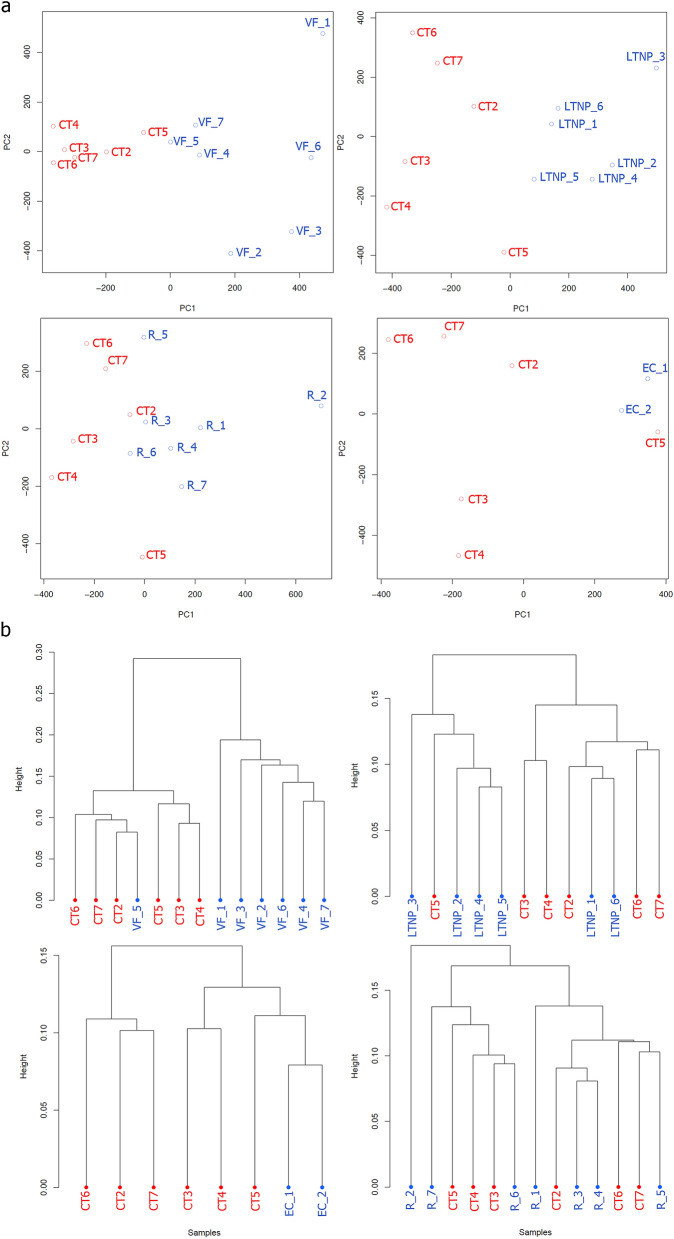
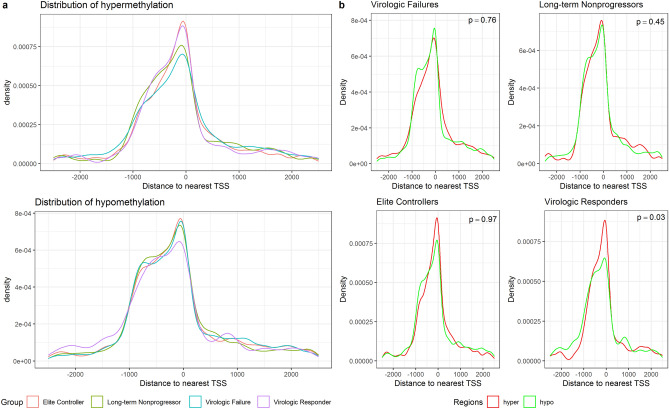
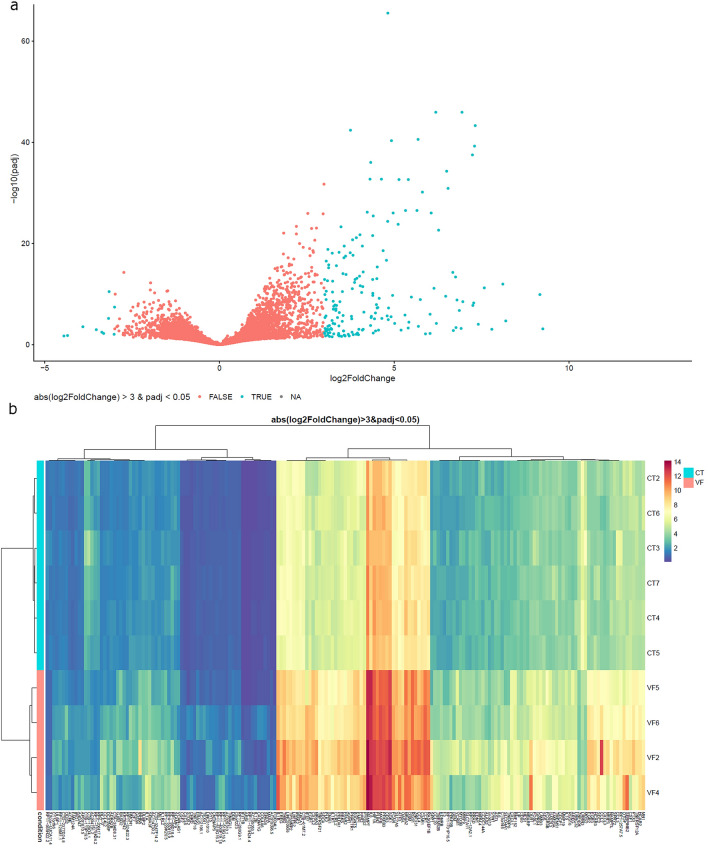
DNA methylation is one of the epigenetic modifications that configures gene transcription programs. This study describes the DNA methylation profile of HIV-infected individuals with distinct characteristics related to natural and artificial viremia control. Sheared DNA from circulating mononuclear cells was subjected to target enrichment bisulfite sequencing designed to cover CpG-rich genomic regions. Gene expression was assessed through RNA-seq. Hypermethylation in virologic responders was highly distributed closer to Transcription Start Sites (p-value = 0.03). Hyper and hypomethylation levels within TSS adjacencies varied according to disease progression status (Kruskal-Wallis, p < 0.001), and specific differentially methylated regions associated genes were identified for each group. The lower the promoter methylation, the higher the gene expression in subjects undergoing virologic failure (R = - 0.82, p = 0.00068). Among the inversely correlated genes, those supporting glycolysis and its related pathways were hypomethylated and up-regulated in virologic failures. Disease progression heterogeneity was associated with distinct DNA methylation patterns in terms of rates and distribution. Methylation was associated with the expression of genes sustaining intracellular glucose metabolism in subjects undergoing antiretroviral virologic failure. Our findings highlight that DNA methylation is associated with latency, disease progression, and fundamental cellular processes.


Conflict of interest statement

The authors declare no competing interests.

Figures

Figure 1
Figure 1
Clustering analysis of CpG methylation profiles. (a) Principal Component Analysis (PCA) of four methylation profiles comparisons between HIV groups and controls. (b) Hierarchical clustering of four methylation profiles comparisons based on 1-Pearson’s correlation distance. Red denotes healthy controls and blue denotes HIV samples. CT Control group, EC Elite controller, LTNP Long-term nonprogressor, R virologic responder, VF virologic failure.
Figure 2
Figure 2
Differential methylation analysis. Methylation percentages were calculated for windows encompassing 100 bp. Then, methylation percentages for each region in HIV groups were compared against a control group. A cutoff of ≥ 25% for methylation difference and a q-value of < 0.01 were considered for the analysis. (a) Number of locations showing hyper and hypomethylation in HIV groups compared with controls. (b) Percent of hypo and hypermethylated regions across human chromosomes. (c) Annotation of differential methylation showing the percentage of differentially hypermethylated regions distributed across exons, intergenic, introns and promoter regions. (d) Annotation of differential methylation showing the percentage of differentially hypomethylated regions distributed across exons, intergenic, introns and promoter regions.
Figure 3
Figure 3
Distance from differentially methylated regions to nearest TSS in base pairs. (a) Distribution of hypo and hypermethylated regions in HIV-infected groups. (b) Intragroup comparison of hypo and hypermethylation distributions surrounding TSS for each HIV group (Wilcoxon rank-sum test). TSS Transcription Start Site.
Figure 4
Figure 4
Differentially methylated regions within − 1 kb/ + 1 kb surrounding Transcription Start Sites. Significant regions (≥ 25% for methylation difference and q-value < 0.01) were annotated to find DMR-associated genes. DMR within − 1 kb/ + 1 kb flanking TSS was filtered for comparing hypo and hypermethylation differences. (a,b) Boxplots show comparisons of percentages for significant hypermethylated and hypomethylated promoters among HIV groups (Kruskal–Wallis rank-sum test < 0.001). P-values were calculated using the Wilcoxon rank-sum test with Benjamim-Hochberg correction for multiple comparisons and non-significant values were omitted. Venn-diagrams represent the number of DMR-associated genes detected for each group and their intersections. NS Non-significant p-values.
Figure 5
Figure 5
Gene expression analysis. RNA-seq data of virologic failures were compared to control group. (a) Volcano plot reports p-adjusted in the y-axis against the fold change of gene expression in the x-axis. Blue denotes differentially expressed genes considering log2 fold change > 3 and p-adjusted < 0.05. Positive and negative values for log2 fold change indicate up-regulated and downregulated genes, respectively. (b) Heatmap illustrates differential expression data for six controls and four virologic failures. Blue and red indicate lower and higher transcription levels, respectively. CT Control group, VF Virologic failure.
Figure 6
Figure 6
Network for differentially expressed genes in individuals failing cART. Different types of network were identified among the 187 transcripts associated with virologic failure. Genes with methylation and gene expression correlation are showed in the left. HLA-V is a pseudogene and was not represented.
Figure 7
Figure 7
Gene expression and methylation correlation. Pearson’s correlation coefficient of the subset of DEG genes with their corresponding differentially methylated promoter. For genes having more than one DMR (FRAS1 and MDS2), the mean difference in methylation was calculated and considered for the correlation analysis. Confidence intervals are shown in grey shading. DEG Differentially expressed genes, DMR Differentially methylated regions.

References

    1. Deaton AEM, Bird A. CpG islands and the regulation of transcription. Genes Dev. 2011;25:1010–1022. - PMC - PubMed
    1. Suzuki MM, Bird A. DNA methylation landscapes: Provocative insights from epigenomics. Nat. Rev. Genet. 2008;9:465–476. - PubMed
    1. Siliciano R, Greene W. HIV latency. Cold Spring Harb. Perspect. Med. 2011;1:2. - PMC - PubMed
    1. Kauder SE, Bosque A, Lindqvist A, Planelles V, Verdin E. Epigenetic regulation of HIV-1 latency by cytosine methylation. PLoS Pathog. 2009;5:e1000495. - PMC - PubMed
    1. Blazkova J, et al. Paucity of HIV DNA methylation in latently infected, resting CD4+ T cells from infected individuals receiving antiretroviral therapy. J. Virol. 2012;2:00040–112. - PMC - PubMed

Publication types

MeSH terms

Substances