. 2021 Nov 26;11(1):23000.
doi: 10.1038/s41598-021-02440-7.

Faces and words are both associated and dissociated as evidenced by visual problems in dyslexia

Affiliations

Faces and words are both associated and dissociated as evidenced by visual problems in dyslexia

Heida Maria Sigurdardottir et al. Sci Rep. .

Abstract

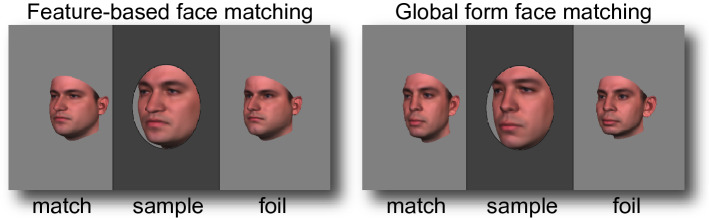
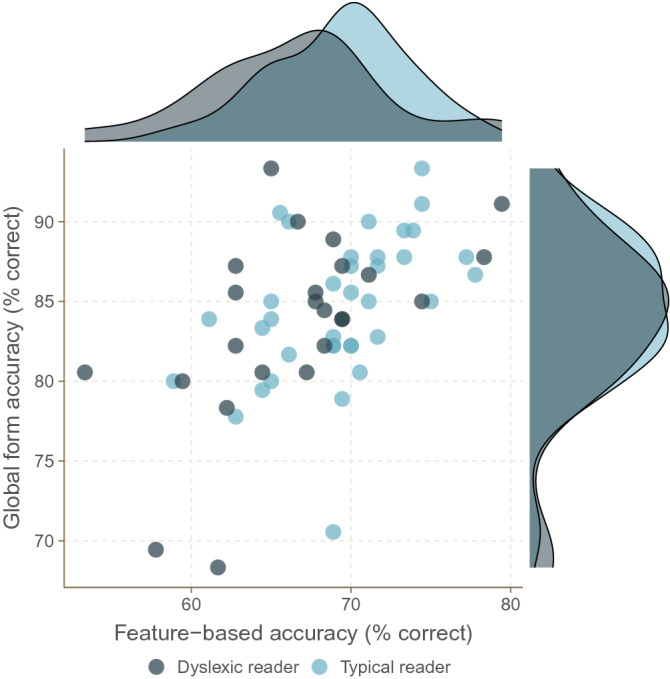
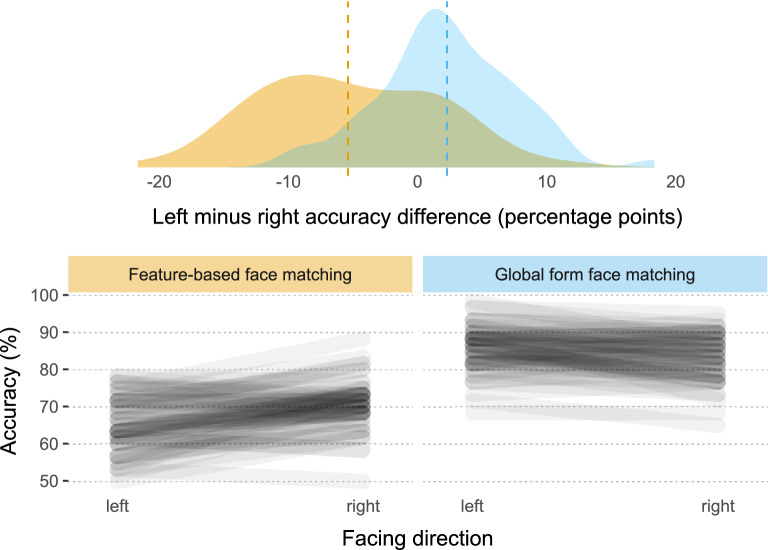
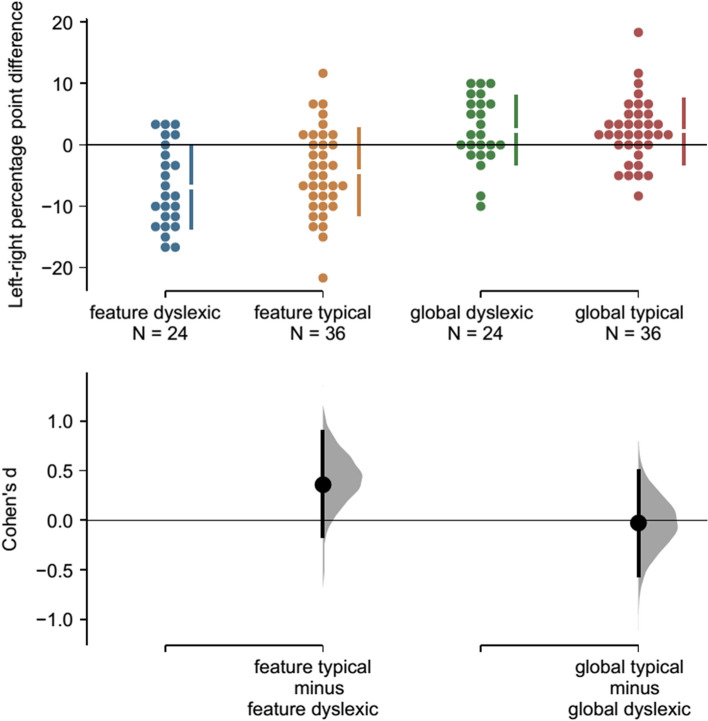
Faces and words are traditionally assumed to be independently processed. Dyslexia is also traditionally thought to be a non-visual deficit. Counter to both ideas, face perception deficits in dyslexia have been reported. Others report no such deficits. We sought to resolve this discrepancy. 60 adults participated in the study (24 dyslexic, 36 typical readers). Feature-based processing and configural or global form processing of faces was measured with a face matching task. Opposite laterality effects in these tasks, dependent on left-right orientation of faces, supported that they tapped into separable visual mechanisms. Dyslexic readers tended to be poorer than typical readers at feature-based face matching while no differences were found for global form face matching. We conclude that word and face perception are associated when the latter requires the processing of visual features of a face, while processing the global form of faces apparently shares minimal-if any-resources with visual word processing. The current results indicate that visual word and face processing are both associated and dissociated-but this depends on what visual mechanisms are task-relevant. We suggest that reading deficits could stem from multiple factors, and that one such factor is a problem with feature-based processing of visual objects.


Conflict of interest statement

The authors declare no competing interests.

Figures

Figure 1
Figure 1
A zoom-in on face stimuli in two face matching trials. A sample face appeared with two choice faces—one foil and one match. The task was to pick the choice face that most resembled the sample face. In feature-based face matching (example on left), the match shared features with the sample. In global form face matching (example on right), the match shared global form with the sample. The foil shared neither features nor global form with the sample. On each trial, all faces looked left (as shown), straight ahead, or to the right, and the match could be on the left (as shown) or right of screen center. Face stimuli are from Van Belle et al.. See https://ppw.kuleuven.be/en/research/lep/resources/face for more examples.
Figure 2
Figure 2
Performance of dyslexic (black) and typical (blue) readers on feature-based and global form face matching. Each dot corresponds to one participant. Marginal plots show density estimates for the two groups.
Figure 3
Figure 3
Performance by orientation of faces (facing direction). Accuracy for feature-based face matching was poorest for leftward-facing stimuli and greatest for rightward-facing stimuli. The opposite laterality pattern was seen for global form face matching. Upper panel: Density estimates for laterality effects (percent correct for left-facing stimuli minus percent correct for right-facing stimuli) in feature-based face matching (yellow) and global form face matching (blue). Mean laterality effects are shown as vertical dashed lines. Lower panels: Individual participants’ scores for left-facing and right-facing stimuli in feature-based face matching (left panel) and global form face matching (right panel) are shown as connected lines.
Figure 4
Figure 4
Cumming plot depicting laterality effects of dyslexic (blue and green dots) and typical readers (yellow and red dots). Upper panel: Each dot corresponds to one person’s laterality effect (accuracy for left-facing stimuli minus accuracy for right-facing stimuli); means and standard deviations are plotted as gapped lines. Lower panel: Effect sizes (Cohen’s d) are depicted as dots. Filled curves depict the resampled distribution of the group differences, given the observed data, and error bars represent 95% confidence intervals (bootstrapped). Image is based on code developed by Ho, Tumkaya, Aryal, Choi, and Claridge-Chang.

Similar articles

Cited by

References

    1. Cox DD. Do we understand high-level vision? Curr. Opin. Neurobiol. 2014;25:187–193. - PubMed
    1. Grill-Spector K, Weiner KS. The functional architecture of the ventral temporal cortex and its role in categorization. Nat. Rev. Neurosci. 2014;15:536. - PMC - PubMed
    1. Logothetis NK, Sheinberg DL. Visual object recognition. Annu. Rev. Neurosci. 1996;19:577–621. - PubMed
    1. Milner D, Goodale M. The Visual Brain in Action. Oxford: Oxford University Press; 2006.
    1. Ungerleider LG, Haxby JV. ‘What’and ‘where’ in the human brain. Curr. Opin. Neurobiol. 1994;4:157–165. - PubMed

Publication types