. 2021 Nov 26;11(1):23007.
doi: 10.1038/s41598-021-02443-4.

Three-dimensional morphological analysis of spermatogenesis in aged mouse testes

Affiliations

Three-dimensional morphological analysis of spermatogenesis in aged mouse testes

Taito Nakano et al. Sci Rep. .

Abstract

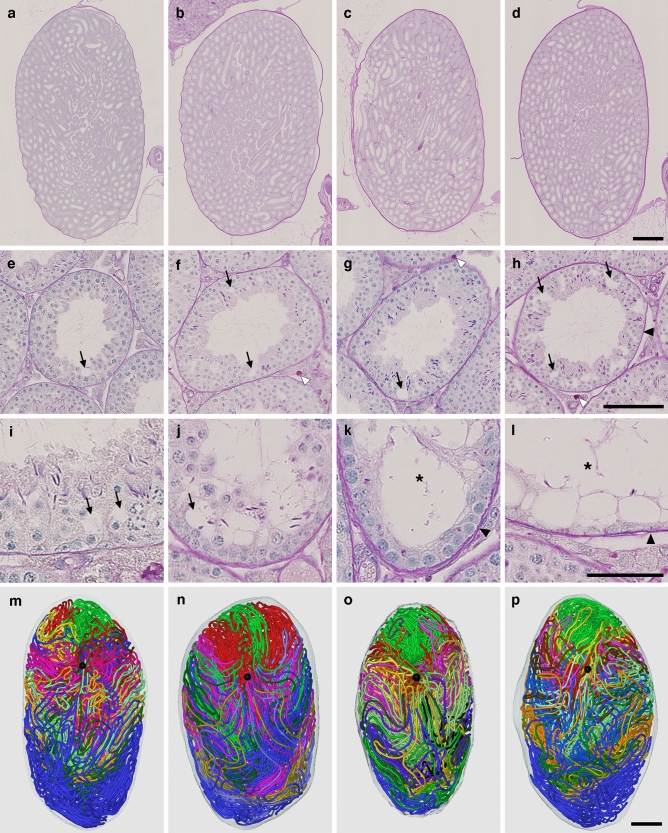
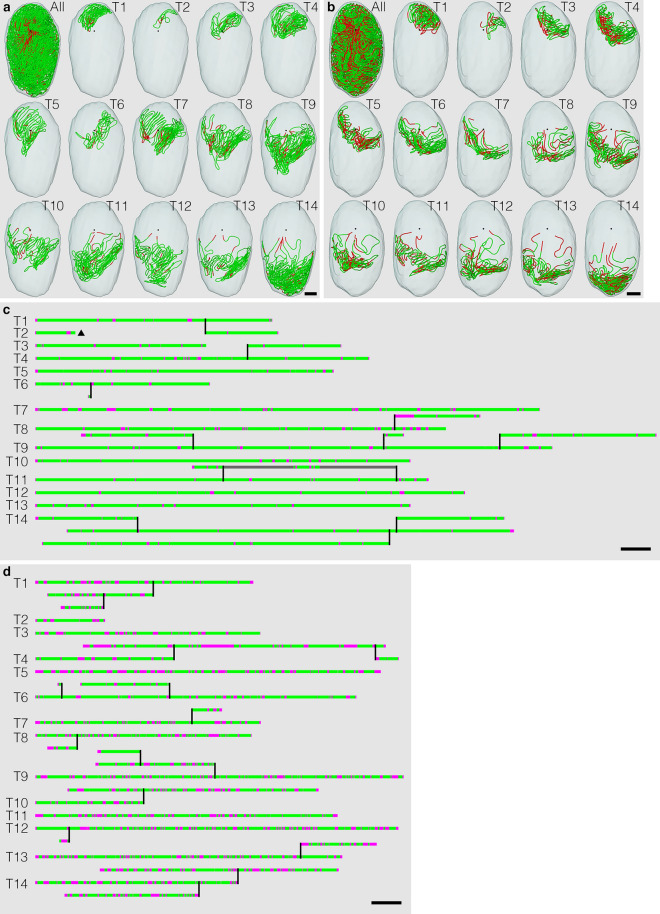
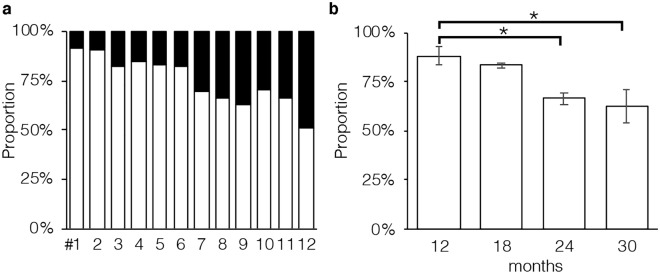
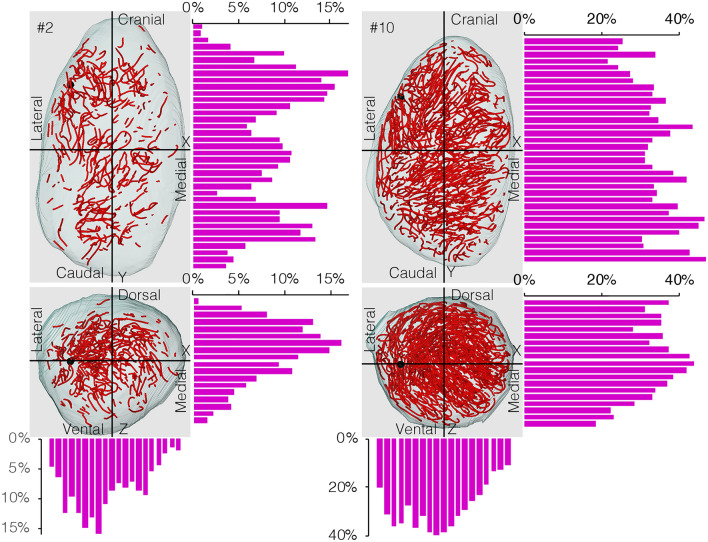
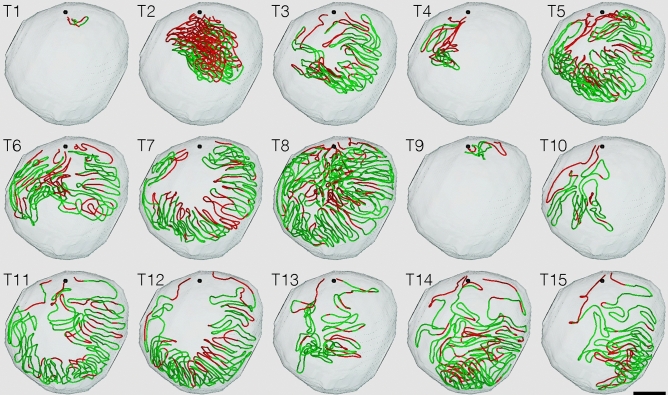
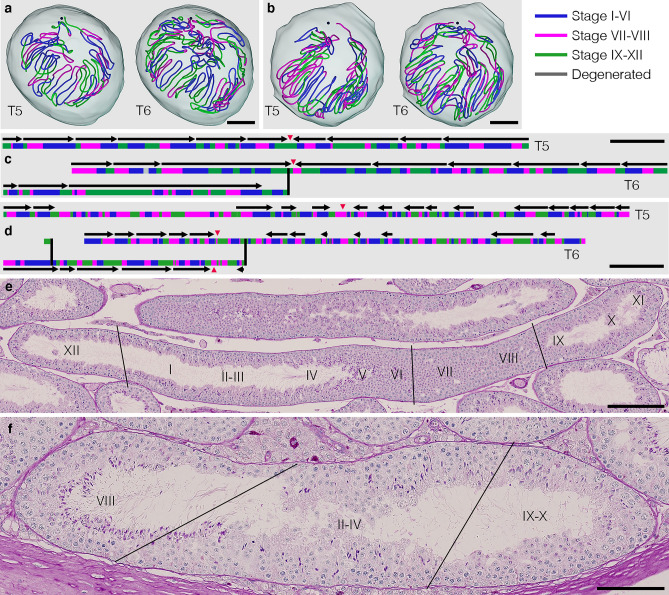
Spermatogenesis, which is a continuous process from undifferentiated spermatogonia to spermatozoa in the seminiferous tubules, declines with age. To investigate changes in spermatogenesis with aging, we reconstructed the seminiferous tubules of 12 mice aged 12 to 30 months from serial sections and examined age-related and region-specific alterations in the seminiferous epithelium and spermatogenic waves in three dimensions. The basic structure of the seminiferous tubules, including the numbers of tubules, terminating points, branching points, and total tubule length, did not change with age. Age-related alterations in spermatogenesis, primarily assessed by the formation of vacuoles in Sertoli cells, were detected in the seminiferous tubules at 12 months. The proportion of altered tubule segments with impaired spermatogenesis further increased by 24 months, but remained unchanged thereafter. Altered tubule segments were preferentially distributed in tubule areas close to the rete testis and those in the center of the testis. Spermatogenic waves became shorter in length with age. These results provide a basis for examining the decline of spermatogenesis not only with aging, but also in male infertility.


Conflict of interest statement

The authors declare no competing interests.

Figures

Figure 1
Figure 1
Reconstruction of all seminiferous tubules in representative testes at 12, 18, 24, and 30 months. (al) PAS-H-stained longitudinal sections of testes #2 (a,e,i), #5 (b,f,j), #7 (c,g,k), and #12 (d,h,l), which represent 12, 18, 24, and 30 months, respectively, are shown at low (ad) and high magnifications (el). (mp) The 3D core lines of all reconstructed seminiferous tubules marked with different colors are shown (m,n,o,p for testis #2, 5, 7, and 12, respectively) with the position of the rete testis (black sphere). Arrows, vacuoles in Sertoli cells; open arrowheads, PAS-positive materials in the interstitial compartment; closed arrowheads, thickening of the basement membrane; asterisks, tubules with severely impaired spermatogenesis. Scales, 1 mm (ad and mp), 100 µm (eh), and 50 µm (il).
Figure 2
Figure 2
Classification of areas of seminiferous tubules in aged mice. Tubule areas were divided into two types with their epithelia: normal (green) and altered (red). Altered areas were identified with the presence of vacuoles in Sertoli cells and/or impaired spermatogenesis. (a,b) The core lines of all reconstructed seminiferous tubules in the testis #1 (12 months) and #10 (30 months), with areas belonging to the above two types marked with the corresponding colors, are shown in a vertical view with the position of the rete testis (black sphere). (c,d) The schemes of all individual seminiferous tubules in testes #1 and #10 are shown. The segments composed of tubule areas belonging to the two types are marked with the corresponding colors. Branching points are shown with vertical bars. Tubules are numbered from T1 to T14 in the order of their initial connection with the rete testis from the top toward the bottom in the testis. Except for one blind end (a black triangle) of T2 in testis #1, all free extremities of the tubules were connected to the rete testis in the terminal points without forming blind ends. Scales, 1 mm (a,b), 10 mm (c,d).
Figure 3
Figure 3
Proportions of tubule areas belonging to two types marked with corresponding colors in individual mice (a) and in groups of mice (12, 18, 24, and 30 months) (b). In (b), each value represents the mean ± SD of three samples. *Significantly different (P = 0.02).
Figure 4
Figure 4
Proportions of altered tubule segments in different 3D positions in testes at 12 and 30 months. The proportions of the lengths of altered segments in testes #2 (12 months) and #10 (30 months) were measured in all tubule portions in 200-μm-thick serial slices of each testis parallel to the 3 planes formed by the x, y, and z axes. The altered segments and positions of the rete testis are shown in red and black spheres, respectively.
Figure 5
Figure 5
Distribution of normal and altered tubule segments at 24 months. The core lines of all reconstructed seminiferous tubules in testis #7 are shown in a horizontal view with the normal and altered segments shown in green and red, respectively, and the positions of the rete testis shown with black spheres. Tubules are numbered from T1 to T15 in the order of their connection with the rete testis from the top toward the bottom in the testis. Scale, 1 mm.
Figure 6
Figure 6
Distribution of spermatogenic stages and waves at 12 (a,c) and 30 (b,d) months. The core lines of reconstructed T5 and T6 tubules in testes #2 (12 months) and #10 (30 months) are shown in a horizontal view with the 3 + 1 different stage groups being marked in different colors and the positions of the rete testis being shown with black spheres (a,b). The different stage groups are as follows: stages I–VI (blue), stages VII–VIII (pink), stages IX–XII (green), and degenerated (gray). The schemes of the T5 and T6 tubules in testes #2 and #10 are shown in (c) and (d), respectively. The segments belonging to the 3 + 1 stage groups are marked with the corresponding colors. Horizontal arrows indicate the scopes and directions of waves. PAS-H-stained sections of testis #11 (30 months), with changes in stages with short intervals (e) and the irregular appearance of non-adjacent stages (f), are shown. The roman numerals in (e,f) represent stages I–XII. Scales, 1 mm (a,b), 10 mm (c,d), 200 µm (e), and 100 µm (f).

References

    1. Russell, L. D., Ettlin, R. A., Sinha-Hikim, A. P., & Clegg, E. D. Histological and Histopathological Evaluation of the Testis. (eds. Russell, L. D. & Ettlin, R. A.) (Cache River Press, 1990).
    1. Kerr, J. B., Loveland, K. L., O’Bryan, M. K., & de Kretser, D. M. Cytology of the testis and intrinsic control mechanisms. In Knobil and Neill’s Physiology of Reproduction, 3 ed. 827–947 (ed. Neill, J. D.) (Academic Press, 2006)
    1. Hermo L, Pelletier RM, Cyr DG, Smith CE. Surfing the wave, cycle, life history, and genes/proteins expressed by testicular germ cells. Part 2: Changes in spermatid organelles associated with development of spermatozoa. Microsc. Res. Tech. 2010;73:279–319. doi: 10.1002/jemt.20783. - DOI - PubMed
    1. Oakberg EF. A description of spermiogenesis in the mouse and its use in analysis of the cycle of the seminiferous epithelium and germ cell renewal. Am. J. Anat. 1956;99:391–414. doi: 10.1002/aja.1000990303. - DOI - PubMed
    1. Hess RA, Renato de Franca L. Spermatogenesis and cycle of the seminiferous epithelium. Adv. Exp. Med. Biol. 2008;636:1–15. - PubMed

Publication types