. 2022 Jan;54(1):40-51.
doi: 10.1038/s41588-021-00962-4. Epub 2021 Nov 26.

Deep learning enables genetic analysis of the human thoracic aorta

Affiliations

Deep learning enables genetic analysis of the human thoracic aorta

James P Pirruccello et al. Nat Genet. 2022 Jan.

Abstract

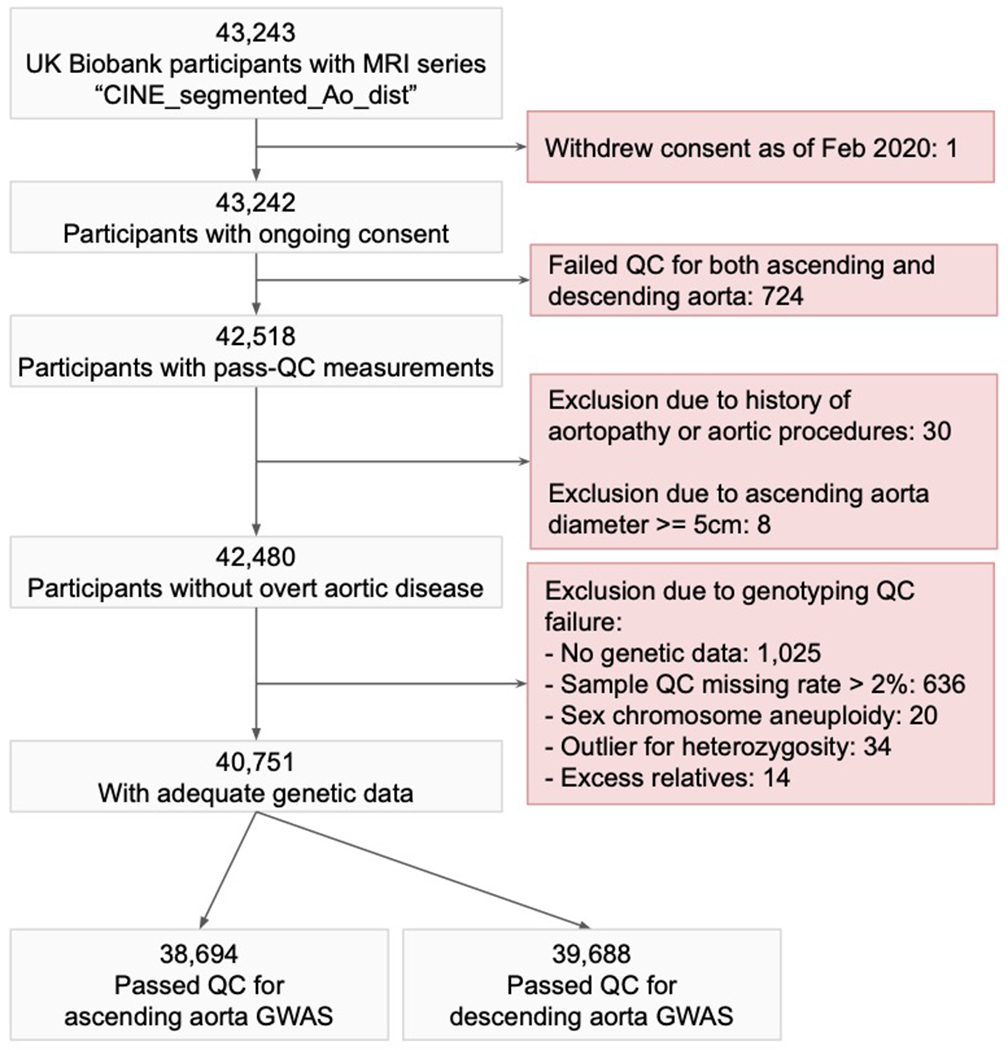
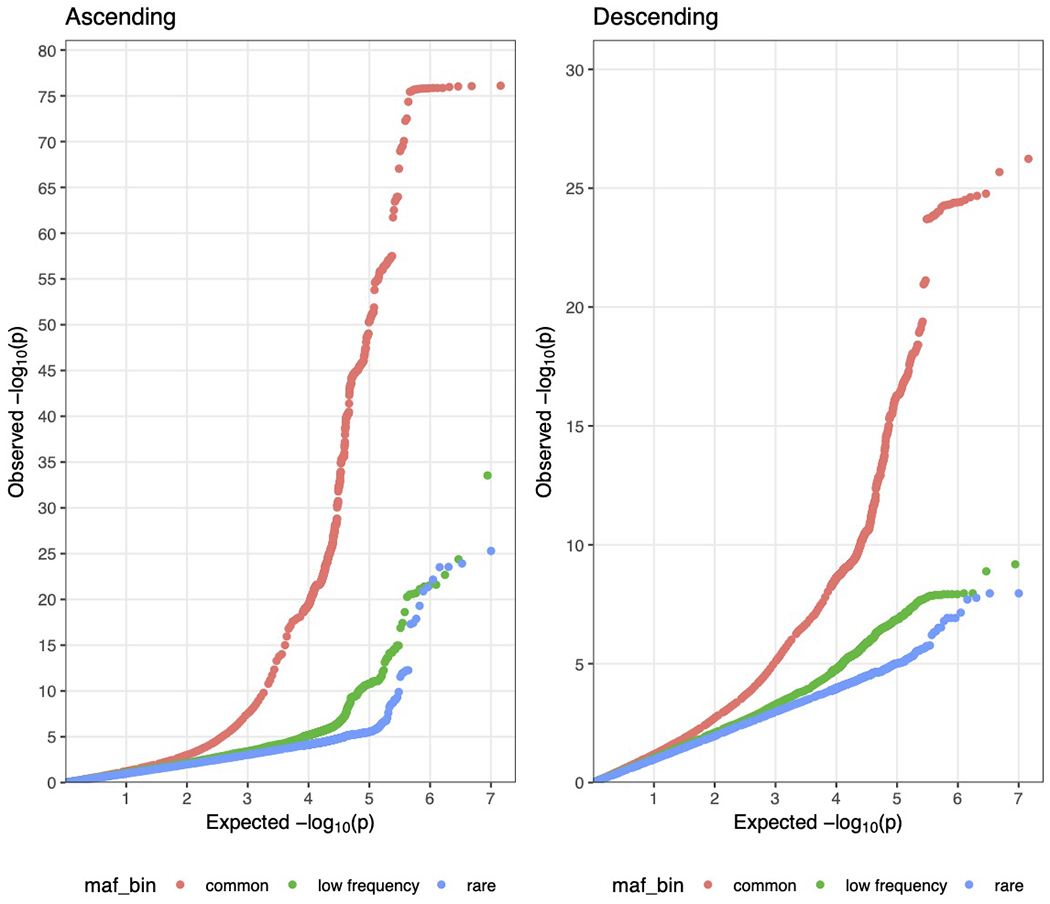
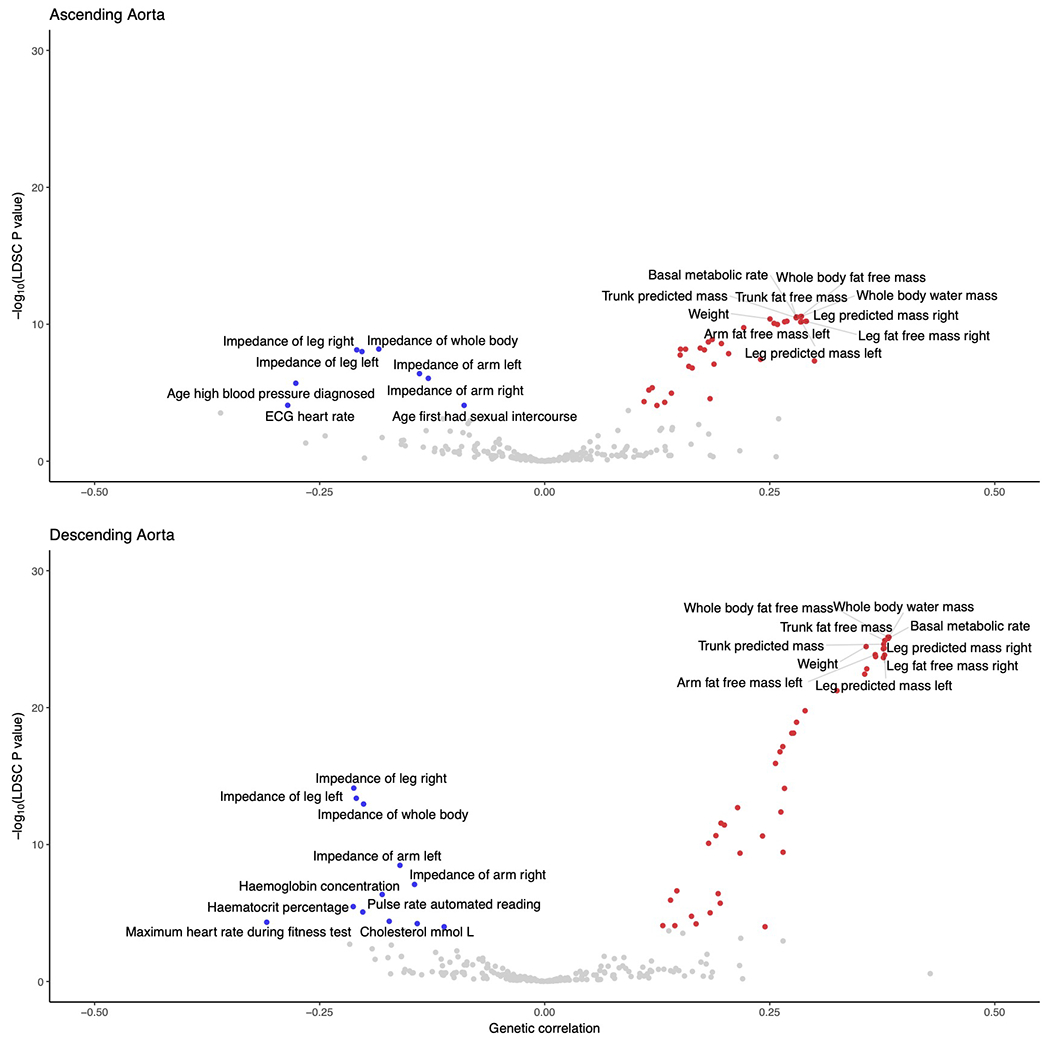
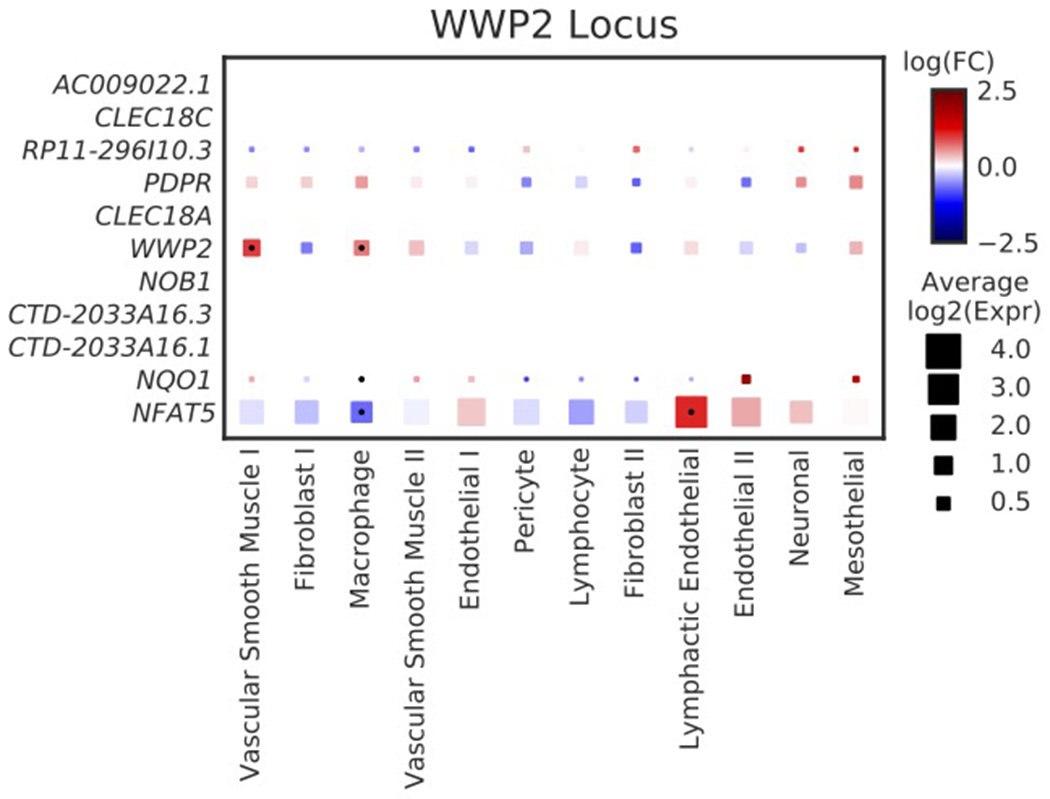
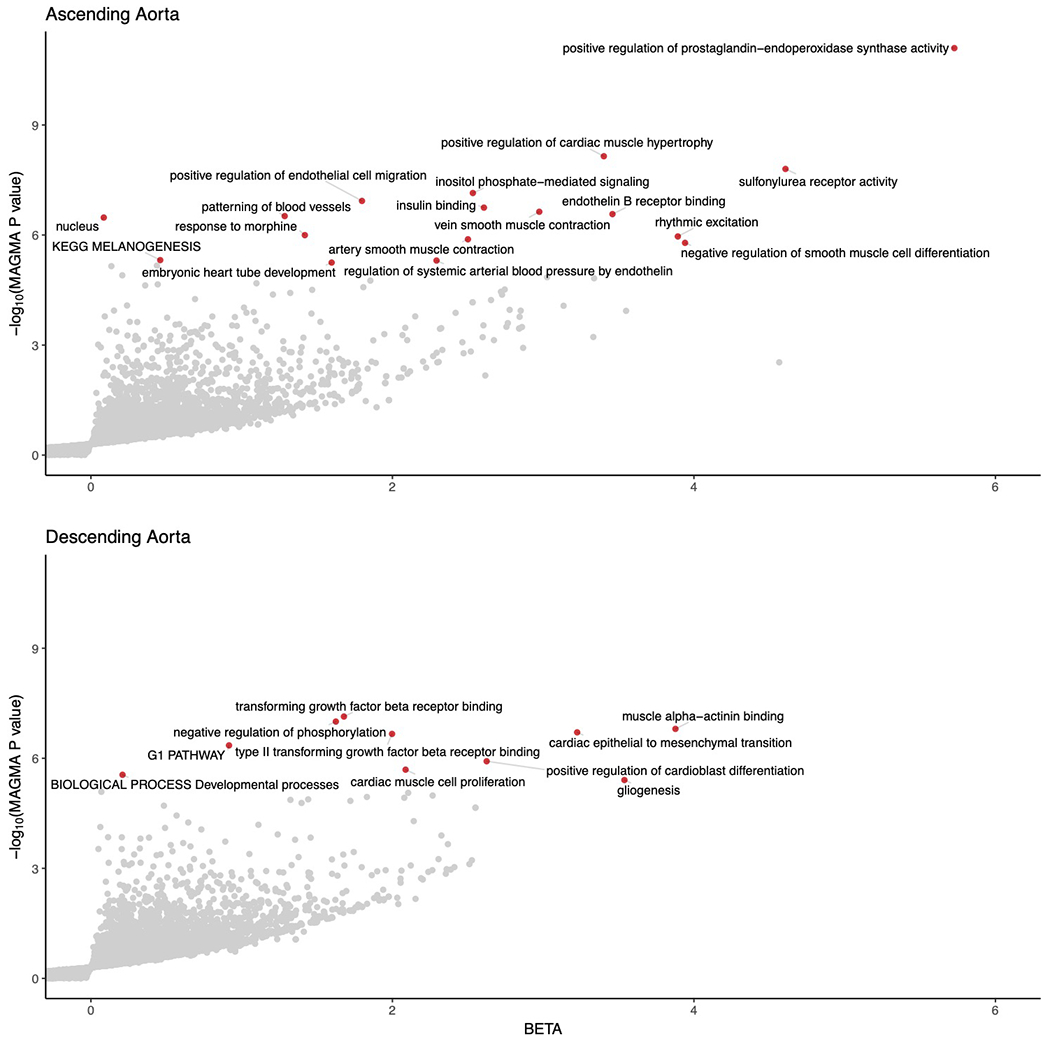
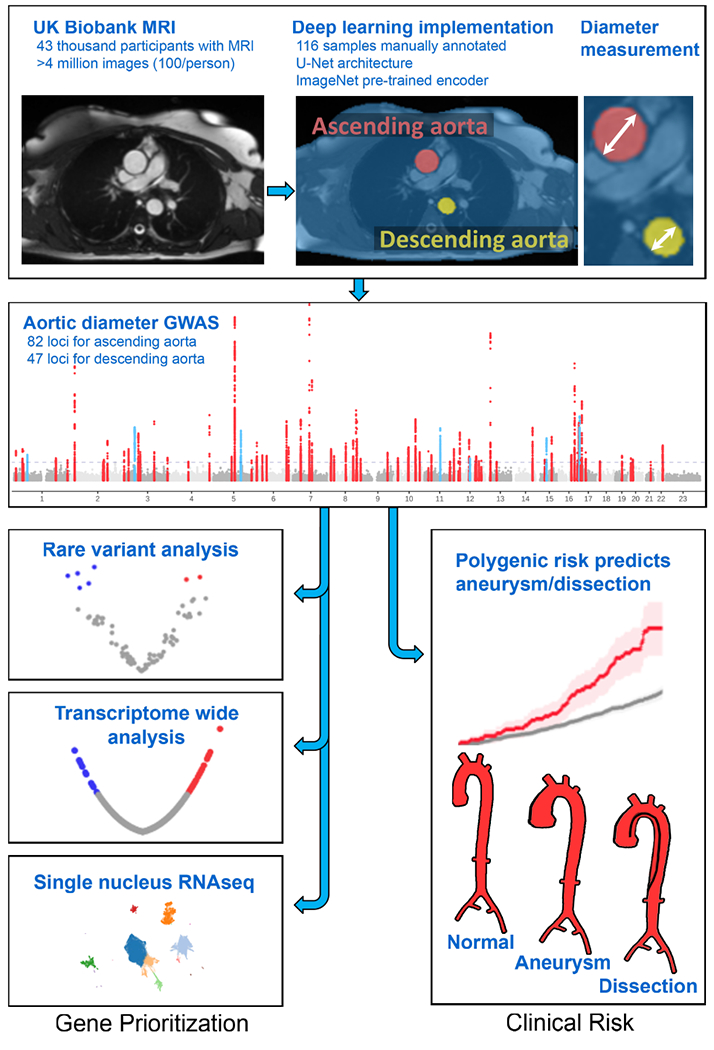
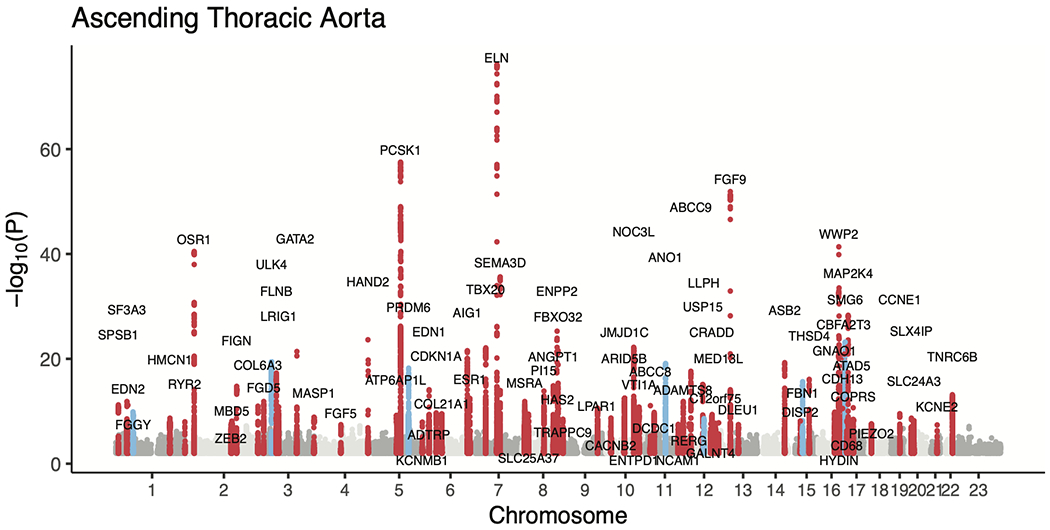
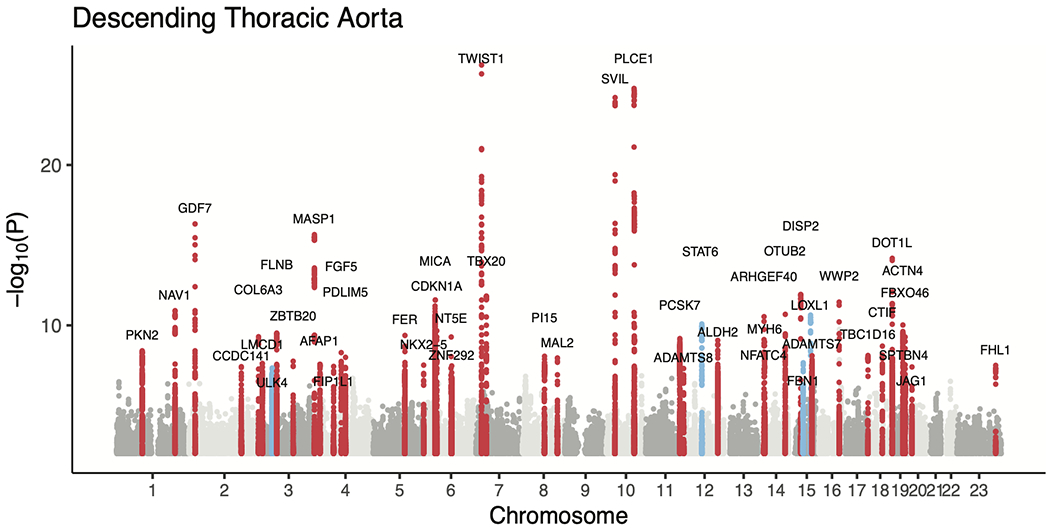
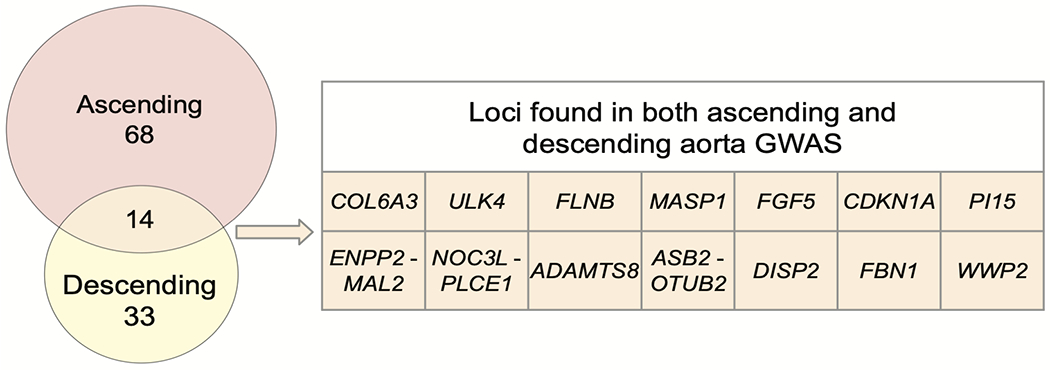
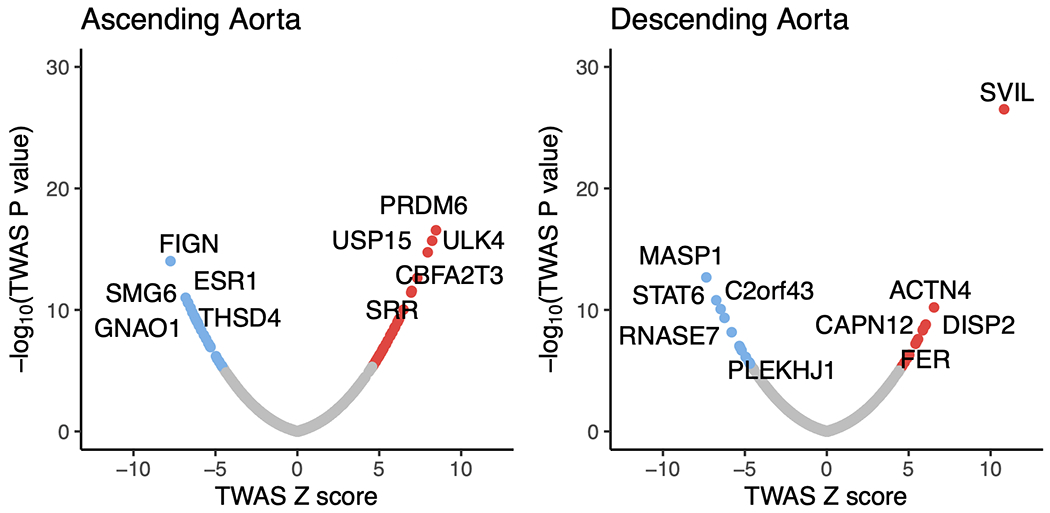
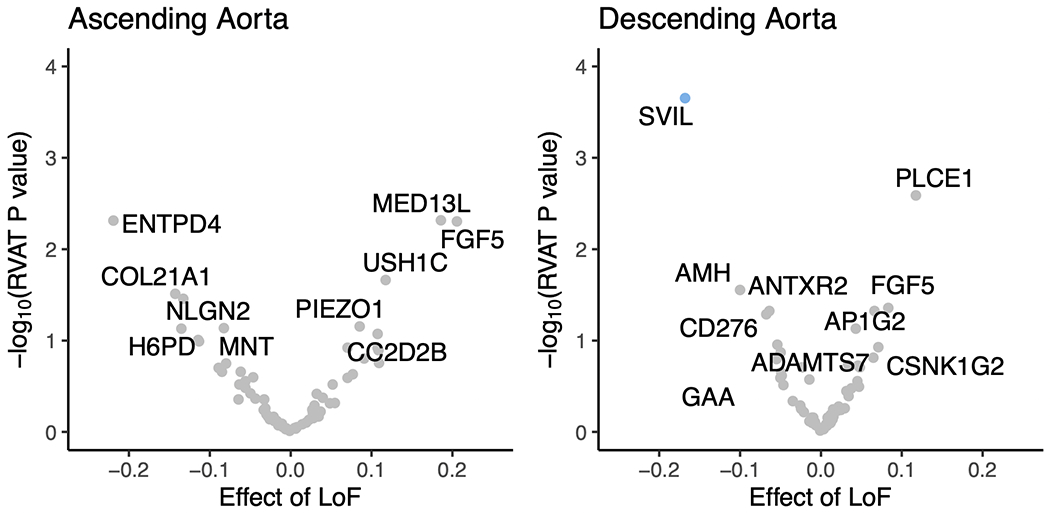
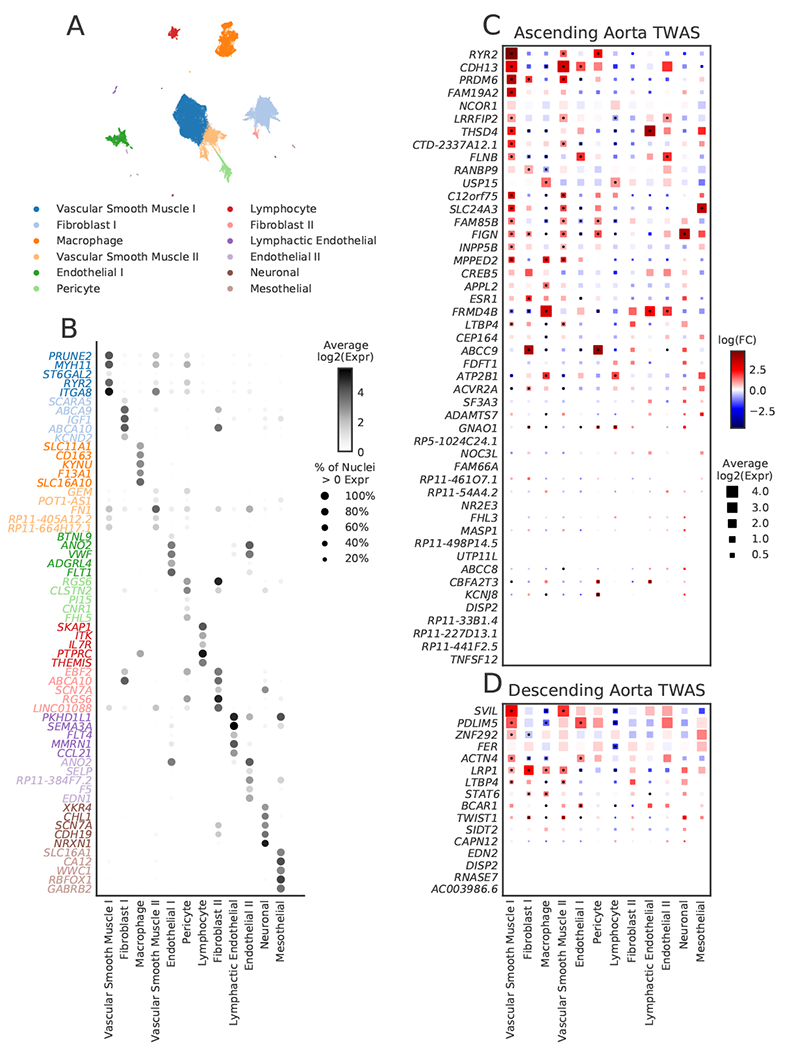
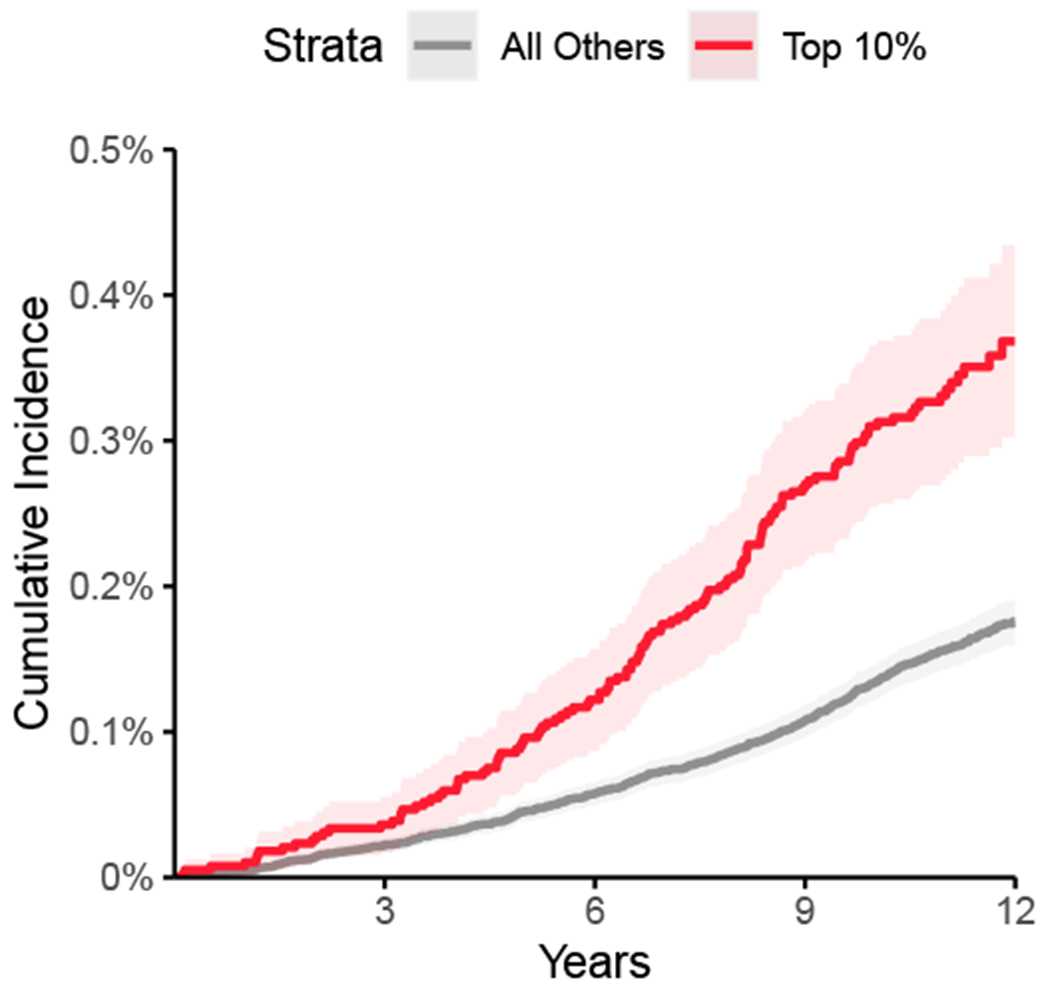
Enlargement or aneurysm of the aorta predisposes to dissection, an important cause of sudden death. We trained a deep learning model to evaluate the dimensions of the ascending and descending thoracic aorta in 4.6 million cardiac magnetic resonance images from the UK Biobank. We then conducted genome-wide association studies in 39,688 individuals, identifying 82 loci associated with ascending and 47 with descending thoracic aortic diameter, of which 14 loci overlapped. Transcriptome-wide analyses, rare-variant burden tests and human aortic single nucleus RNA sequencing prioritized genes including SVIL, which was strongly associated with descending aortic diameter. A polygenic score for ascending aortic diameter was associated with thoracic aortic aneurysm in 385,621 UK Biobank participants (hazard ratio = 1.43 per s.d., confidence interval 1.32-1.54, P = 3.3 × 10⁻²⁰). Our results illustrate the potential for rapidly defining quantitative traits with deep learning, an approach that can be broadly applied to biomedical images.


Figures

Extended Data Fig. 1
Extended Data Fig. 1. Aortic size by age and sex
The length of the minor elliptical axis of aorta at its maximum size during the cardiac cycle (i.e., the diameter) is shown for the ascending aorta (left) and the descending aorta (right). The x-axis represents the participant’s age at the time of cardiac MRI, and the y-axis represents the size of aorta. Each point represents one person’s measurements; men are plotted in turquoise and women in red. Sex-specific locally weighted scatterplot smoothing (LOESS) curves are overplotted. Each point represents one of the 42,518 participants who passed imaging quality control for at least one of the ascending or descending aorta measurements: 40,363 had accepted measurements for ascending aorta, and 41,415 had accepted measurements for descending aorta.
Extended Data Fig. 2
Extended Data Fig. 2. GWAS sample flow diagram.
The GWAS sample flow diagram depicts the sample filtering process that led to the specific samples being chosen for the ascending and descending aortic diameter GWAS.
Extended Data Fig. 3
Extended Data Fig. 3. GWAS QQ plots
Quantile-quantile plots showing the theoretical distribution of P values under a uniform distribution (x-axis) versus the observed distribution within the sample (y-axis) are displayed for the ascending and descending aorta GWAS summary statistics. The plots are stratified by minor allele frequency (‘maf_bin’): ‘common’ denotes SNPs with MAF > 0.05, low frequency with 0.005 < MAF ≤ 0.05, and rare with 0.001 < MAF ≤ 0.005. Variants with MAF < 0.001 were excluded from the analysis.
Extended Data Fig. 4
Extended Data Fig. 4. GWAS replication in the Framingham Heart Study
a,b, For lead SNPs from the main UK Biobank GWAS that could be identified in a GWAS from FHS, each SNP is plotted based on the UK Biobank Z score (x-axis) and the FHS Z score (y-axis). 72 SNPs for ascending aortic diameter (a) and 41 SNPs for descending aortic diameter (b) could be identified in FHS and are plotted here. SNPs where the direction of effect is in agreement between FHS and UK Biobank are plotted in blue, while those with opposite direction of effect are marked in red.
Extended Data Fig. 5
Extended Data Fig. 5. Genetic correlation with continuous traits
The genetic correlation between continuous traits and the ascending (top) and descending (bottom) thoracic aorta in the UK Biobank are represented in volcano plots. Of the 281 tested traits, genetic correlation with 257 traits was computable in the ascending aorta and with 256 traits in the descending aorta. The x-axis represents the magnitude of genetic correlation, while the y-axis represents the −log10 of the genetic correlation P value, based on ldsc. Traits achieving Bonferroni significance are colored red (for positive genetic correlation) or blue (for negative genetic correlation). The top 10 positively and negatively associated traits are labeled. The underlying data are available in Supplementary Table 10.
Extended Data Fig. 6
Extended Data Fig. 6. Cell type-specific gene expression at the WWP2 locus
Cell-type specificity of genes with expression data within 500 kb of the lead SNP near WWP2. As with Figure 4, the size of each square represents the average log2(Expr) for a gene across all nuclei in a given cluster. The color represents the log fold-change comparing the expression of the given gene in each cluster to all other clusters based on a formal differential expression model. A dot represents significant up- or down-regulation in the given cluster based on a Benjamini-Hochberg correction for multiple testing at FDR < 0.01. Expr, normalized nucleus-level expression calculated as the number of counts of a gene divided by the total number of counts in the nucleus and multiplied by 10,000; FC, fold-change.
Extended Data Fig. 7
Extended Data Fig. 7. MAGMA gene set associations
Gene sets enriched in MAGMA analysis of the GWAS of the ascending (top) and descending (bottom) thoracic aorta are represented in volcano plots. The x-axis represents the magnitude of estimated effect of a pathway-based gene set on the aortic trait, while the y-axis represents the −log10 of the MAGMA association P value. Pathways achieving Bonferroni significance are colored red and labeled. The underlying data are available in Supplementary Tables 17 and 18.
Figure 1 |
Figure 1 |
Study overview
Figure 2 |
Figure 2 |. Genome-wide association study results for ascending and descending thoracic aorta diameter.
a,b, Loci with P < 5 × 10⁻⁸ are shown in red (if not previously reported) or blue (if previously reported in common variant association studies for aortic size or disease status (aneurysm or dissection)). The X chromosome is represented as ‘23’. c, Venn diagram showing the number of loci uniquely associated at P < 5 × 10⁻⁸ with either the ascending or descending thoracic aorta. Those in orange are associated with both and are enumerated in the table to the right. Loci whose lead SNP’s nearest gene differs between ascending and descending are demarcated as “Ascending/Descending”.
Figure 3 |
Figure 3 |. Gene-level association tests.
In the top row, protein-coding genes associated with the size of the ascending (left) and descending (right) thoracic aorta based on an integrated gene expression prediction are shown. The x-axis represents the magnitude of the TWAS Z score, while the y-axis represents the −log10 of the TWAS P value. Genes achieving Bonferroni significance are colored red (positive correlation) or blue (negative correlation). The top five positively and negatively correlated genes are labeled. In the bottom row, rare variant collapsing burden test results are depicted for the genes within a 500-kb window around GWAS loci (67 for ascending and 55 for descending). Loss-of-function carrier status in each gene was tested for association with the size of the ascending (left) and descending (right) thoracic aorta. The x-axis represents the effect size of LoF in each gene on aortic size, while the y-axis represents the −log10 of the association P value in a logistic model. SVIL, which achieved P < 0.05/55 in the descending aorta, is colored blue. The top five positively and negatively correlated genes are labeled.
Figure 4 |
Figure 4 |. Single nucleus RNA sequencing analyses in human aorta.
Single nucleus RNA-seq was performed on paired ascending and descending thoracic aortic tissue from three humans. a, Uniform manifold approximation and projection (UMAP) revealed 12 main clusters. Each dot represents an individual nucleus, colored and labeled by putative cell type as identified from Leiden clustering. b, The top five most selectively expressed genes for each cluster were identified as those with the largest fold-change difference in expression comparing the given cluster with all other clusters, only considering genes expressed in at least 30% of nuclei and with a Benjamini-Hochberg corrected P < 0.01. The shade of the dot represents the average log2 expression for a gene across all nuclei in a given cluster and the size of the dot represents the percentage of nuclei in the cluster with non-zero expression. The cell type labels were created by comparing selectively expressed genes in each cluster of nuclei with the literature. c,d, Cell-type specificity of genes with expression data supported by the TWAS in the ascending (c) and descending (d) aorta. The size of each square represents the average log2(Expr) for a gene across all nuclei in a given cluster. The color represents the log fold-change comparing the expression of the given gene in each cluster to all other clusters based on a formal differential expression model. A dot represents significant up- or down-regulation in the given cluster based on a Benjamini-Hochberg correction for multiple testing at FDR < 0.01. Expr, normalized nucleus-level expression calculated as the number of counts of a gene divided by the total number of counts in the nucleus and multiplied by 10,000; FC, fold-change.
Figure 5 |
Figure 5 |. Cumulative incidence of thoracic aortic aneurysm or dissection stratified by polygenic score.
The cumulative incidence (1 minus the Kaplan-Meier survival estimate) of a diagnosis of aortic aneurysm or dissection (y-axis) is plotted against the number of years since UK Biobank enrollment (x-axis). Individuals in the top tenth percentile of the polygenic score for ascending aorta size are shown in red; the remaining 90% are shown in gray. The 95% confidence intervals (from the cumulative hazard standard error) are represented with lighter colors.

References

    1. Benjamin EJ et al. Heart disease and stroke statistics—2019 update: a report from the American Heart Association. Circulation 139, e56–e528 (2019). - PubMed
    1. Isselbacher EM Thoracic and abdominal aortic aneurysms. Circulation 111, 816–828 (2005). - PubMed
    1. Owens DK et al. Screening for abdominal aortic aneurysm: US Preventive Services Task Force Recommendation Statement. JAMA 322, 2211–2218 (2019). - PubMed
    1. Fann JI Descending thoracic and thoracoabdominal aortic aneurysms. Coron. Artery Dis 13, 93–102 (2002). - PubMed
    1. Guo D-C, Papke CL, He R & Milewicz DM Pathogenesis of thoracic and abdominal aortic aneurysms. Ann. N. Y. Acad. Sci 1085, 339–352 (2006). - PubMed

Methods-only References

    1. Sudlow C et al. UK Biobank: an open access resource for identifying the causes of a wide range of complex diseases of middle and old age. PLoS Med. 12, e1001779 (2015). - PMC - PubMed
    1. Petersen SE et al. Imaging in population science: cardiovascular magnetic resonance in 100,000 participants of UK Biobank - rationale, challenges and approaches. J. Cardiovasc. Magn. Reson 15, 46 (2013). - PMC - PubMed
    1. Petersen SE et al. UK Biobank’s cardiovascular magnetic resonance protocol. J. Cardiovasc. Magn. Reson 18, 8 (2016). - PMC - PubMed
    1. He K, Zhang X, Ren S & Sun J Deep residual learning for image recognition. ArXiv151203385 Cs (2015).
    1. Krizhevsky A, Sutskever I & Hinton GE ImageNet classification with deep convolutional neural networks. Communications of the ACM 60, 84–90 (2017).

Publication types