. 2022 Feb;113(2):660-673.
doi: 10.1111/cas.15224. Epub 2021 Dec 5.

Decreased expression of T-cell-associated immune markers predicts poor prognosis in patients with follicular lymphoma

Affiliations

Decreased expression of T-cell-associated immune markers predicts poor prognosis in patients with follicular lymphoma

Shinya Rai et al. Cancer Sci. 2022 Feb.

Abstract

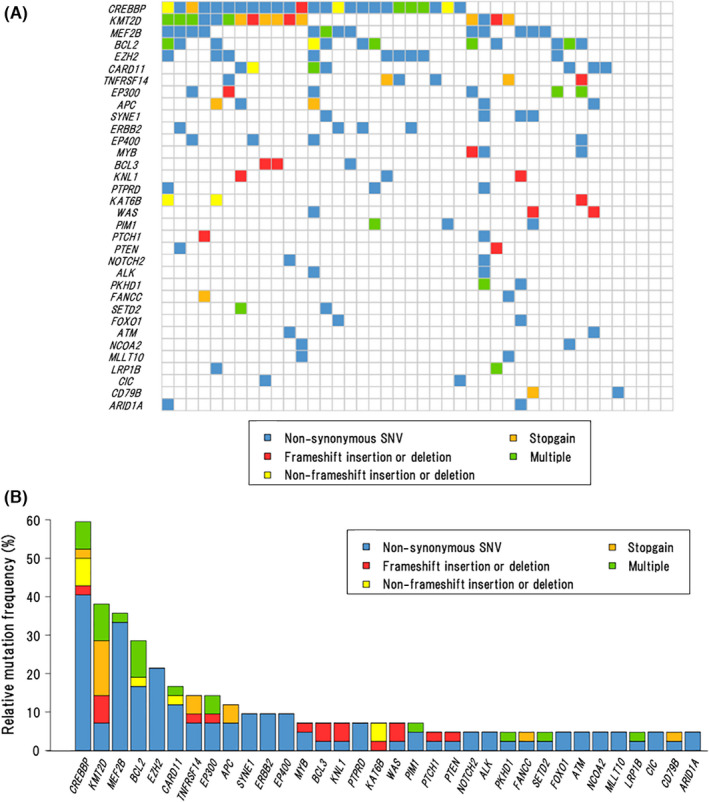
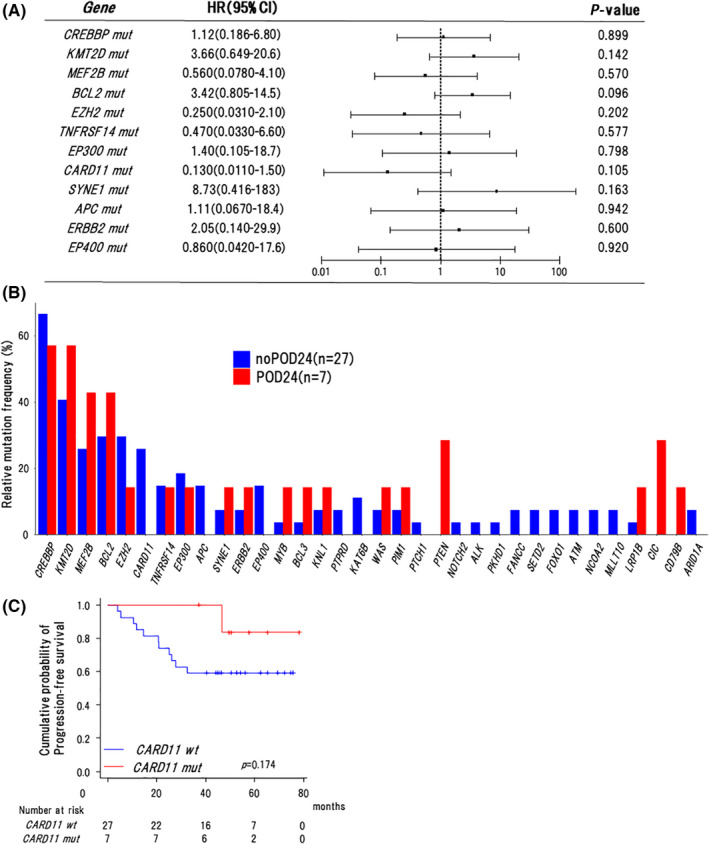
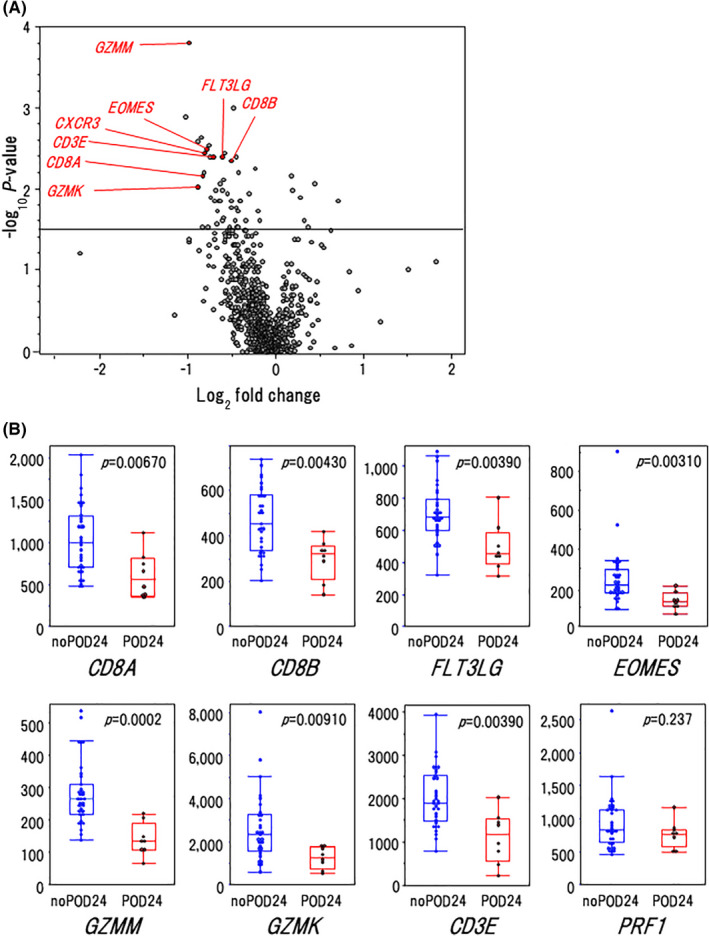
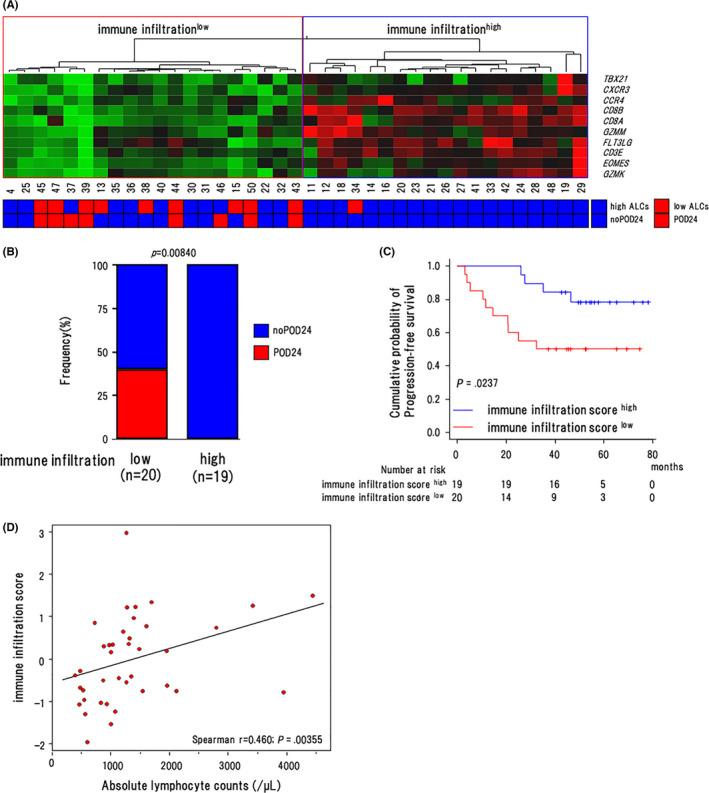
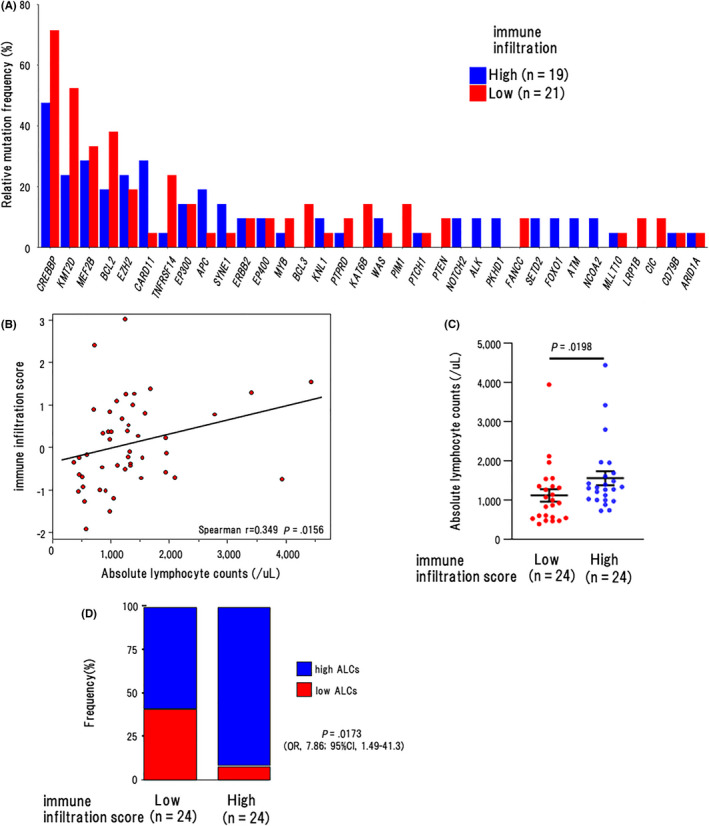
We previously examined the utility of rituximab-bendamustine (RB) in patients with follicular lymphoma (FL) exhibiting less than optimal responses to 2 cycles of the R-CHOP chemotherapy regimen. The aim of this study was to identify molecular biomarkers that can predict prognosis in RB-treated patients in the context of the prospective cohort. We first analyzed the mutational status of 410 genes in diagnostic tumor specimens by target capture and Sanger sequencing. CREBBP, KMT2D, MEF2B, BCL2, EZH2, and CARD11 were recurrently mutated as reported before, however none was predictive for progression-free survival (PFS) in the RB-treated patients (n = 34). A gene expression analysis by nCounter including 800 genes associated with carcinogenesis and/or the immune response showed that expression levels of CD8+ T-cell markers and half of the genes regulating Th1 and Th2 responses were significantly lower in progression of disease within the 24-mo (POD24) group (n = 8) than in the no POD24 group (n = 31). Collectively, we selected 10 genes (TBX21, CXCR3, CCR4, CD8A, CD8B, GZMM, FLT3LG, CD3E, EOMES, GZMK), and generated an immune infiltration score (IIS) for predicting PFS using principal component analysis, which dichotomized the RB-treated patients into immune IIShigh (n = 19) and IISlow (n = 20) groups. The 3-y PFS rate was significantly lower in the IISlow group than in the IIShigh group (50.0% [95% CI: 27.1-69.2%] vs. 84.2% [95% CI: 58.7-94.6%], P = .0237). Furthermore, the IIS was correlates with absolute lymphocyte counts at diagnosis (r = 0.460, P = .00355). These results suggest that the T-cell-associated immune markers could be useful to predict prognosis in RB-treated FL patients. (UMIN:000 013 795, jRCT:051 180 181).

Keywords: POD24; bendamustine; follicular lymphoma; lymphopenia; tumor microenvironment.


Conflict of interest statement

IM has received research funding from Chugai and Eizai Pharmaceuticals. SR has received payment for lectures from Chugai Pharmaceuticals. No other potential conflicts of interest were reported.

Figures

FIGURE 1
FIGURE 1
Landscape of somatic mutations. A, Co‐mutation plot showing the spectrum of recurrently mutated genes across all cases (n = 42). B, Frequencies and types of somatic mutations in 34 recurrently mutated genes (found in ≥2 cases) for all cases (n = 42)
FIGURE 2
FIGURE 2
Association of mutation profile with clinical outcomes in the nOR group. A, Forest plot for progression‐free survival in univariate analyses. HR, hazard ratio. Mut, mutations. B, Frequencies of mutations in 34 recurrently mutated genes in cases with or without POD24 in the nOR group (n = 34). C, Kaplan‐Meier curves for progression‐free survival of cases with or without CARD11 mutations in the nOR group (n = 34). Log‐rank P‐values are shown in the graphs. Wt, wild type. Mut, mutations
FIGURE 3
FIGURE 3
Association of m7‐FLIPI with clinical outcomes. Comparison of progression‐free survival between the cases in the low‐risk and high‐risk categories classified by m7‐FLIPI for (A) all cases (n = 42) and (B) nOR group (n = 34). Log‐rank P‐values are shown in the graphs. Int, intermediate. C, The proportions of the low‐risk and high‐risk categories classified by m7‐FLIPI in the cases with and without POD24 in the nOR group (n = 34). P‐values by Fisher exact test are shown in the graphs
FIGURE 4
FIGURE 4
Association of the 23‐gene expression levels with clinical outcomes. A, Heat map and unsupervised hierarchical clustering showing the genes along rows and cases along columns in all cases. Green denotes low and red indicates high gene expression. Clusters 1 and 2 were characterized by high expression of genes associated with favorable and poor outcome, respectively. B, Kaplan‐Meier curves for progression‐free survival of cases with clusters 1 and 2 in all cases (n = 48). C, the nOR group (n = 39). Log‐rank P‐values are shown in the graphs
FIGURE 5
FIGURE 5
Association of T‐cell‐associated gene expression with clinical outcomes. A, Volcano plot indicating differentially expressed genes in cases with or without POD24 in the nOR group (n = 39). B, Gene expression levels of the CD8+ T‐cell markers in the cases with POD24 and without POD24. P‐values by Fisher exact test are shown in the graphs. In the box plots, the center line and lower and upper hinges correspond to the median, and the first and third quartiles (25 and 75 percentiles), respectively. The upper and lower whiskers extend from the upper and lower hinges to the largest or smallest values no further than a 1.5× inter‐quartile range from the hinges
FIGURE 6
FIGURE 6
Association of the immune infiltration score with clinical outcomes. A, Heat map and unsupervised hierarchical clustering showing the genes along rows and cases along columns in the nOR group. Green denotes low and red indicates high gene expression. The regions indicate the low (shown in red) and high immune infiltration cluster (shown in blue). B, The proportion of cases with POD24 in the infillow and infilhigh clusters in the nOR group. P‐values by Fisher exact test are shown in the graphs (n = 39). C, Progression‐free survival of cases in the IISlow (n = 20) and IIShigh (n = 19) groups in the nOR group (n = 39). Log‐rank P‐values are shown in the graphs. D, Scattergram shows the correlation between ALCs (horizontal axis) and IIS (vertical axis). Spearman's correlation coefficients are estimated as continuous variables
FIGURE 7
FIGURE 7
Association of the T‐cell‐associated gene expression with their mutation profile. A, Mutation frequencies of recurrently mutated genes by infillow and infilhigh clusters in all cases (n = 40). B, Scattergram shows the correlation between ALCs (horizontal axis) and IIS (vertical axis). Spearman correlation coefficients were estimated as continuous variables. C, The number of ALCs in the IISlow (n = 24) and IIShigh (n = 24) groups. P‐values using Wilcoxon rank sum test are shown in the graphs. The graph shows the mean and SEM of data from the cases in the respective groups. D, The proportion of cases with low ALCs (< 869/μL) in the IISlow (n = 24) and IIShigh (n = 24) groups. P‐values using Fisher exact test are shown in the graphs

References

    1. Carbone A, Roulland S, Gloghini A, et al. Follicular lymphoma. Nat Rev Dis Primers. 2019;5:83. - PubMed
    1. Hiddemann W, Barbui AM, Canales MA, et al. Immunochemotherapy With Obinutuzumab or Rituximab for Previously Untreated Follicular Lymphoma in the GALLIUM Study: Influence of Chemotherapy on Efficacy and Safety. J Clin Oncol. 2018;36:2395‐2404. - PubMed
    1. Marcus R, Seymour JF, Hiddemann W. Obinutuzumab Treatment of Follicular Lymphoma. N Engl J Med. 2017;377:2605‐2606. - PubMed
    1. Federico M, Luminari S, Dondi A, et al. R‐CVP versus R‐CHOP versus R‐FM for the initial treatment of patients with advanced‐stage follicular lymphoma: results of the FOLL05 trial conducted by the Fondazione Italiana Linfomi. J Clin Oncol. 2013;31:1506‐1513. - PubMed
    1. Luminari S, Ferrari A, Manni M, et al. Long‐Term Results of the FOLL05 Trial Comparing R‐CVP Versus R‐CHOP Versus R‐FM for the Initial Treatment of Patients With Advanced‐Stage Symptomatic Follicular Lymphoma. J Clin Oncol. 2018;36:689‐696. - PubMed

MeSH terms