. 2022 Feb;109(4):1014-1027.
doi: 10.1111/tpj.15610. Epub 2021 Dec 11.

Monitoring calcium handling by the plant endoplasmic reticulum with a low-Ca2+ -affinity targeted aequorin reporter

Affiliations

Monitoring calcium handling by the plant endoplasmic reticulum with a low-Ca2+ -affinity targeted aequorin reporter

Enrico Cortese et al. Plant J. 2022 Feb.

Abstract

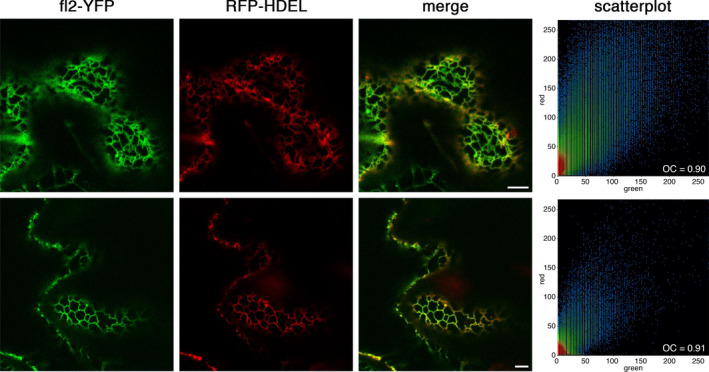
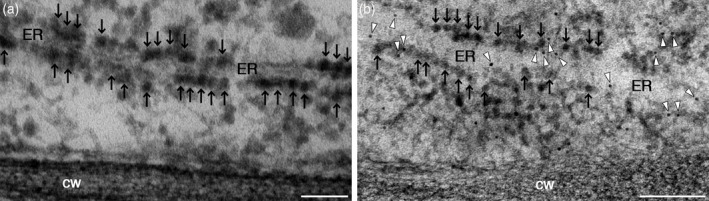
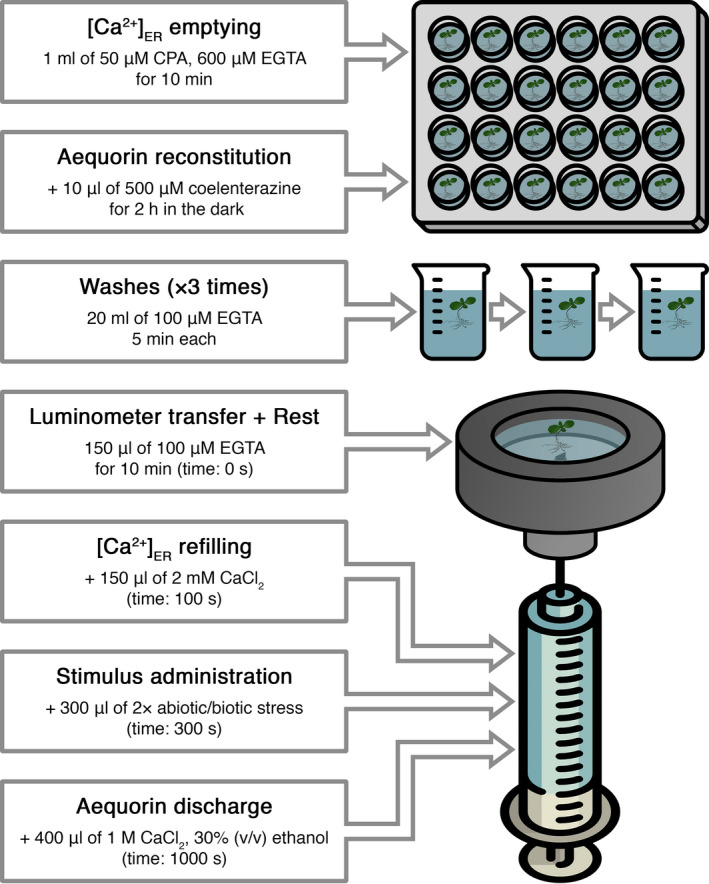
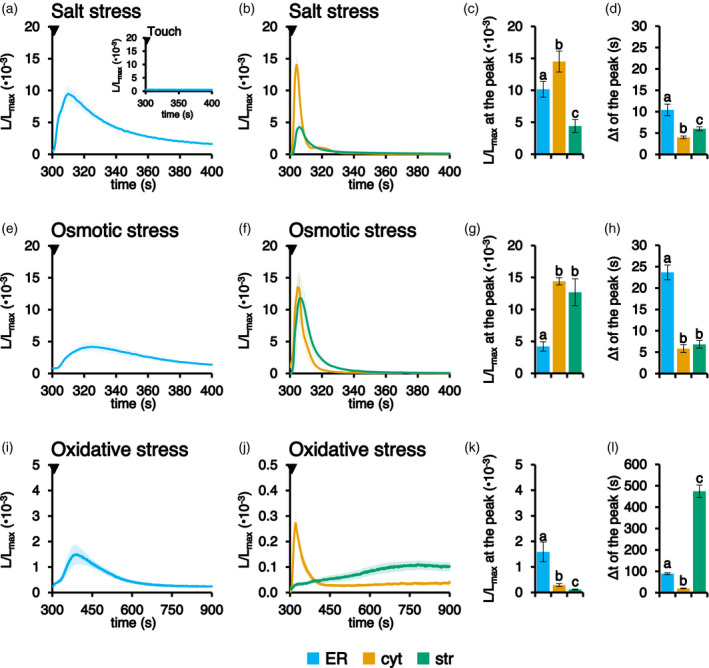
Precise measurements of dynamic changes in free Ca2+ concentration in the lumen of the plant endoplasmic reticulum (ER) have been lacking so far, despite increasing evidence for the contribution of this intracellular compartment to Ca2+ homeostasis and signalling in the plant cell. In the present study, we targeted an aequorin chimera with reduced Ca2+ affinity to the ER membrane and facing the ER lumen. To this aim, the cDNA for a low-Ca2+ -affinity aequorin variant (AEQmut) was fused to the nucleotide sequence encoding a non-cleavable N-terminal ER signal peptide (fl2). The correct targeting of fl2-AEQmut was confirmed by immunocytochemical analyses in transgenic Arabidopsis thaliana (Arabidopsis) seedlings. An experimental protocol well-established in animal cells - consisting of ER Ca2+ depletion during photoprotein reconstitution followed by ER Ca2+ refilling - was applied to carry out ER Ca2+ measurements in planta. Rapid and transient increases of the ER luminal Ca2+ concentration ([Ca2+ ]ER ) were recorded in response to different environmental stresses, displaying stimulus-specific Ca2+ signatures. The comparative analysis of ER and chloroplast Ca2+ dynamics indicates a complex interplay of these organelles in shaping cytosolic Ca2+ signals during signal transduction events. Our data highlight significant differences in basal [Ca2+ ]ER and Ca2+ handling by plant ER compared to the animal counterpart. The set-up of an ER-targeted aequorin chimera extends and complements the currently available toolkit of organelle-targeted Ca2+ indicators by adding a reporter that improves our quantitative understanding of Ca2+ homeostasis in the plant endomembrane system.

Keywords: Arabidopsis thaliana; aequorin; calcium homeostasis; chloroplasts; endoplasmic reticulum; environmental stresses; signal transduction.


Conflict of interest statement

The authors declare no conflict of interest.

Figures

Figure 1
Figure 1
Subcellular localization of fl2‐YFP in Nicotiana benthamiana. Confocal microscopy analysis of N. benthamiana agroinfiltrated epidermal cells co‐transformed with fl2‐YFP and the ER marker RFP‐HDEL. Fluorescence microscopy images with filters for YFP, RFP and an overlay of the two channels are shown. Scale bar = 5 μm. Scatterplots of colocalization of the signals from the two constructs are also shown. OC, overlay coefficient.
Figure 2
Figure 2
Subcellular localization of the fl2‐AEQmut Ca2+ probe in transgenic Arabidopsis seedlings. Immunogold labelling was carried out in roots of 2‐week‐old Arabidopsis seedlings stably transformed with fl2‐AEQmut using an anti‐aequorin antibody (dilution 1:500) followed by a secondary antibody conjugated with 10‐nm diameter gold particles (b). White arrowheads indicate gold particles, decorating ER profiles. Black arrows indicate ribosomes. As a negative control, samples were incubated with secondary antibody only (a). cw, cell wall. ER, endoplasmic reticulum. Scale bars = 100 nm.
Figure 3
Figure 3
Schematic representation of the protocol used for Ca2+ measurements with the plant ER‐targeted aequorin probe.
Figure 4
Figure 4
Comparison between [Ca2+] dynamics in the ER, cytosol and chloroplasts in response to environmental stimuli. Ca2+ measurements were performed in Arabidopsis seedlings stably expressing aequorin in the ER (light blue trace), cytosol (cyt, orange trace) or chloroplast stroma (str, green trace). Seedlings were challenged with different abiotic stresses: (a–d) 300 mm NaCl; (e–h) 600 mm mannitol; and (i–l) 10 mm H2O2. The time scale starts at 300 sec, the time point of stimulus addition (black arrowhead), after the [Ca2+]ER refilling protocol. The inset in (a) shows a touch control (injection of an equal volume of H2O). Data are the mean (solid lines) ± SE (shading) of ≥ 6 different seedlings derived from three independent growth replicates. Statistical analyses of L/L max at the peak (c, g, k) and delay of the peak after the stimulus injection (d, h, l) are shown. Bars labelled with different letters differ significantly (P < 0.05, Student’s t test).
Figure 5
Figure 5
Pharmacological approach to the analysis of salt stress‐induced ER Ca2+ fluxes. Ca2+ assays were conducted in Arabidopsis seedlings stably expressing the aequorin chimera targeted to the ER. (a) After the administration of 1 mm CaCl2 (at 100 sec, white arrowhead) to restore the steady‐state [Ca2+]ER, seedlings were incubated (at 300 sec, black arrow) with H2O (control, light blue trace) or with different inhibitors of Ca2+‐ATPases: 50 μm CPA (dark blue trace), 1 μm eosin Y (light grey trace) and 1 μm erythrosin B (dark grey trace). At 600 sec (black arrowhead), all samples were challenged with 300 mm NaCl. Data are the mean (solid lines) ± SE (shading) of six different seedlings derived from three independent growth replicates. (b) Statistical analyses of L/L max at the peak. Bars labelled with different letters differ significantly (P < 0.05, Student’s t test).
Figure 6
Figure 6
Effect of pre‐treatment with Ca2+ chelators on abiotic stresses‐triggered [Ca2+]cyt and [Ca2+]ER transients. Ca2+ assays were conducted in Arabidopsis seedlings stably expressing aequorin in the cytosol (a, c, e) or in the ER (b, d, f). Seedlings were incubated under control conditions (light traces) or pre‐treated with either 1 mm EGTA for 10 min (intermediate‐shade traces), 5 mm EGTA for 10 min (dark traces) or 50 μm BAPTA‐AM for 1 h (black traces), before challenge with different abiotic stresses (300 sec, black arrowhead): (a, b) 300 mm NaCl; (c, d) 600 mm mannitol; and (e, f) 10 mm H2O2. Data are the mean (solid lines) ± SE (shading) of ≥ 6 different seedlings derived from three independent growth replicates. Insets show statistical analyses of L/L max at the peak. Bars labelled with different letters differ significantly (P < 0.05, Student’s t test).
Figure 7
Figure 7
Determination of the [Ca2+] calibration curve for the plant ER‐targeted fl2‐AEQmut probe. Reconstituted protein crude extracts were obtained from Arabidopsis seedlings stably transformed with fl2‐AEQmut. Luminescence emitted at 22°C (L) upon injection of 200 µl of different Ca2+ concentrations to 50 µl of reconstituted extracts was measured. At the end of each experiment, the total residual luminescence (L max) was collected by allowing full consumption of the probe via the addition of 50 μl of 1 m CaCl2. The ratio L/L max was plotted against actual [Ca2+]free corresponding to the applied [CaCl2], which was measured under the same conditions using the fluorescent calcium indicator Calcium Green™‐5N. Data are the mean ± SE of three different biological samples, each including three technical replicates. The continuous curve corresponds to the best fit of the experimental data, as described in the Experimental Procedures.

References

    1. Alonso, M.T. , Rodríguez‐Prados, M. , Navas‐Navarro, P. , Rojo‐Ruiz, J. & García‐Sancho, J. (2017) Using aequorin probes to measure Ca2+ in intracellular organelles. Cell Calcium, 64, 3–11. - PubMed
    1. Baker, C.J. & Mock, N.M. (1994) An improved method for monitoring cell death in cell suspension and leaf disc assays using evans blue. Plant Cell, Tissue and Organ Culture, 39, 7–12.
    1. Bayer, E.M. , Sparkes, I. , Vanneste, S. & Rosado, A. (2017) From shaping organelles to signalling platforms: the emerging functions of plant ER‐PM contact sites. Current Opinion in Plant Biology, 40, 89–96. - PubMed
    1. Berridge, M.J. , Lipp, P. & Bootman, M.D. (2000) The versatility and universality of calcium signalling. Nature Reviews Molecular Cell Biology, 1, 11–21. - PubMed
    1. Block, M.A. & Jouhet, J. (2015) Lipid trafficking at endoplasmic reticulum‐chloroplast membrane contact sites. Current Opinion in Cell Biology, 35, 21–29. - PubMed

Publication types