. 2022 Jan;9(3):e2102945.
doi: 10.1002/advs.202102945. Epub 2021 Nov 26.

A Microclip Peripheral Nerve Interface (μcPNI) for Bioelectronic Interfacing with Small Nerves

Affiliations

A Microclip Peripheral Nerve Interface (μcPNI) for Bioelectronic Interfacing with Small Nerves

Cami C Rowan et al. Adv Sci (Weinh). 2022 Jan.

Abstract

Peripheral nerves carry sensory (afferent) and motor (efferent) signals between the central nervous system and other parts of the body. The peripheral nervous system (PNS) is therefore rich in targets for therapeutic neuromodulation, bioelectronic medicine, and neuroprosthetics. Peripheral nerve interfaces (PNIs) generally suffer from a tradeoff between selectivity and invasiveness. This work describes the fabrication, evaluation, and chronic implantation in zebra finches of a novel PNI that breaks this tradeoff by interfacing with small nerves. This PNI integrates a soft, stretchable microelectrode array with a 2-photon 3D printed microclip (μcPNI). The advantages of this μcPNI compared to other designs are: a) increased spatial resolution due to bi-layer wiring of the electrode leads, b) reduced mismatch in biomechanical properties with the nerve, c) reduced disturbance to the host tissue due to the small size, d) elimination of sutures or adhesives, e) high circumferential contact with small nerves, f) functionality under considerable strain, and g) graded neuromodulation in a low-threshold stimulation regime. Results demonstrate that the μcPNIs are electromechanically robust, and are capable of reliably recording and stimulating neural activity in vivo in small nerves. The μcPNI may also inform the development of new optical, thermal, ultrasonic, or chemical PNIs as well.

Keywords: 3D printing; bioelectronic medicine; peripheral nerve interfaces; stretchable microelectrode arrays.


Conflict of interest statement

The authors declare no conflict of interest.

Figures

Figure 1
Figure 1
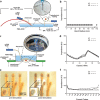
The μcPNI—a soft, flexible interface for small peripheral nerves. a) Rendering of the microclip with sMEA showing key components and features. b) sMEA component of the μcPNI electrode array after fabrication with segment descriptions. c) Photograph of the μcPNI after fabrication with sMEA compression bonded between PCBs with Omnetics connector. d) Schematic of the μcPNI implantation process: i) a sharpened tungsten point is inserted in the manipulation hole; ii) using the point , the μcPNI is advanced toward the nerve; iii) the nerve contacts the sMEA, elastically deforming the hinged uprights and allowing the electrodes to move into the microclip; iv) the sMEA wraps around the nerve as it enters the microclip; v) the point is retracted from the manipulation hole. Inset shows isometric and top views of nerve (gray) and relative electrode pad positions (yellow) after implant. e) photomicrograph of the μcPNI implanted on the TSN of a zebra finch. f) Photomicrograph of the μcPNI (right) and a Cortec silicone nerve cuff (left) each sized for 150 µm nerves. For comparison, the red circle shows the diameter of the 150 µm nerve.
Figure 2
Figure 2
Fabrication process flow for the μcPNI. a) Fabrication of the stretchable bi‐layer PDMS electrode. b) Integration of the 3D‐printed microclip. c) Schema for microclip clamping onto the electrode: μcPNI in final assembly state (left); cross‐section of the μcPNI showing the teeth‐like printed clamp on only one side and the electrode in a pre‐strained state that reduces the thickness of the substrate (center); following release from strain, the electrode thickness is restored and now mechanically fixed in the printed clamp (right).
Figure 3
Figure 3
Electrochemical characterization of the electrode array. a) Photomicrographs of μcPNI electrode sites before (top) and after (bottom) electroplating with Pt black. Inset shows the zoomed view of plated electrode pad. b) Electro‐impedance spectroscopy of the six channels on the μcPNI before (black) and after (red) electroplating with Pt black. Mean of L1 and L2 electrodes shown as dotted and dashed lines, respectively; standard deviation across a layer indicated by shaded regions. c) Baseline noise recordings of the six μcPNI channels before (black) and after (red) electroplating with Pt black. d) RMS of baseline noise across all channels (n = 3 each on L1 and L2) before (black) and after (red) electroplating. Markers identify individual channels; bars and error bars denote mean ± std across n = 3 channels. N.S. = not significant (P = 0.4 and 0.7, respectively). e) Mean power spectrum of baseline noise across channels before (black) and after (red) electroplating. Mean of L1 and L2 pads shown as dotted and dashed lines, respectively; standard deviation across a layer indicated by shaded regions.
Figure 4
Figure 4
Electromechanical characterization of the electrode array. a) Experimental setup to assess bending strain. b) Electrode impedance versus bending radius; L1 and L2 pads shown as dotted and dashed lines, respectively; markers identify individual channels. c) Experimental setup to assess bending fatigue. d) Electrode impedance versus bending cycles; L1 and L2 pads shown as dotted and dashed lines, respectively. e) Micrographs of μcPNI electrode recording/stimulation sites before (left) and after (right) injecting 10 000 pulses at 110 µA and 133 µs. f) Impedance versus number of stimulation pulses. Note the non‐uniform x‐axis.
Figure 5
Figure 5
Acute in vivo recording of stimulation‐evoked nerve activity. a) Schema for acute recording of evoked responses. Current‐controlled stimulation was delivered via bipolar silver hook electrodes; evoked responses were recorded by a μcPNI placed ≈20 mm caudally. b) Representative examples of responses evoked by graded stimulation currents. Stimulation (10–110 µA; biphasic pulses; 200 µs phase−1) applied at t = 0 ms. Each line shows the single‐trial response; line color indicates stimulation current as indicated in the color bar. Note that for clarity of presentation and to facilitate comparison of the pre‐ and post‐stimulation waveforms, the stimulation artifacts have been removed from this and other subpanels in this figure. c) Same as in (b), but showing mean response across trials (16–64 trials) at binned stimulation currents (bin width = 5 µA). Each line shows the mean response; line color indicates stimulation current as in (b). d) Evoked response peak‐to‐peak voltage (V pp) as a function of stimulation intensity. Each data point indicates the mean across trials within an animal (16–64 trials each). Gray symbols identify individual birds; black lines and error bars indicate the mean and standard deviation across animals (n = 4 birds). e) Representative examples of evoked response waveforms recorded simultaneously on each electrode. Stimulation (67 µA; biphasic pulses; 200 µs phase−1) applied at t = 0 ms. Each line shows the mean response across trials (n = 64 trials); line color indicates the recording channel. f) Example of evoked responses recorded before, during, and after local lidocaine application. Stimulation (64 µA; biphasic pulses; 200 µs phase−1) applied at t = 0 ms. Each line and shaded region show mean ± std for n = 24 trials. g) Evoked response V pp across conditions in (f). Each data point indicates the mean across 24 trials within an animal. Grey symbols identify individual birds; bars and error bars denote mean ± std across n = 4 birds per condition. **P < 0.01 Repeated‐measures ANOVA, P = 0.007; Dunnett's test, P = 0.009.
Figure 6
Figure 6
Chronic in vivo recording of nerve activity. a) Representative example of chronic TSN recording aligned to the song. (Top) Spectrogram of the bird's song; color indicates power intensity at each time‐frequency bin. (Bottom) Electrophysiology activity recorded from the TSN simultaneously with the song motif shown at top; timescale aligned to Figure 6b at the bottom. Color here and in all other subpanels indicates the recording channel. b) Mean song‐aligned TSN activity envelope over n = 10 consecutive motifs for each channel. Same animal as shown in (a). c) Matrix of pair‐wise correlations between mean song‐aligned activity envelopes from each channel (n = 50 each channel; 300 total) for the representative animal shown in (a). Row and column relations to channel indicated by colored lines at left and bottom. d) Mean pair‐wise correlation between nerve activity envelopes recorded within (left) and across (right) μcPNI electrode in n = 3 birds. In each, data points show mean across electrodes within a bird. Bars show mean across all birds; error bars indicate std. **P < 0.01 two‐tailed paired t‐test, P = 0.008. e) Metrics demonstrating stable performance of each μcPNI channel over time. (Left) Mean daily trial‐by‐trial Pearson's correlation to the average activity pattern on the 1st day of recording. (Center) Mean daily peak‐to‐peak voltage. (Right) Mean daily event rate. f) Same as in (e), but showing mean statistics across all electrode channels in n = 3 birds (two‐tailed paired t‐test; correlation: P > 0.17; V pp: P > 0.68; event rate: P > 0.37).
Figure 7
Figure 7
Acute in vivo stimulation of nerve activity. a) Schema for acute stimulation of evoked responses. Current‐controlled stimulation was delivered via μcPNI; evoked responses were recorded by an additional μcPNI placed ≈20 mm caudally. b) Representative examples of responses evoked by graded stimulation currents. Stimulation (10–110 µA; biphasic pulses; 200 µs phase−1) applied at t = 0 ms. Each line shows mean response across trials (8–40 trials) at binned stimulation currents (bin width = 5 µA). Line color indicates stimulation current as indicated in the color bar. c) Evoked response peak‐to‐peak voltage (V pp) as a function of stimulation intensity. Each data point indicates the mean across trials within an animal (8–40 trials each). Gray symbols identify individual birds; black lines and error bars indicate the mean and standard deviation across animals (n = 4 birds). d) Summary figure of stimulation voltage as a function of stimulation current across experiments (11 774 trials across experiments using n = 4 μcPNI). Pulses delivered by L1 and L2 electrode pads indicated by color.

References

    1. Bouton C., J. Intern. Med. 2017, 282, 37. - PubMed
    1. Raspopovic S., Capogrosso M., Petrini F. M., Bonizzato M., Rigosa J., Di Pino G., Carpaneto J., Controzzi M., Boretius T., Fernandez E., Granata G., Oddo C. M., Citi L., Ciancio A. L., Cipriani C., Carrozza M. C., Jensen W., Guglielmelli E., Stieglitz T., Rossini P. M., Micera S., Sci. Transl. Med. 2014, 6, 222ra19. - PubMed
    1. Andersson U., Tracey K. J., Cerebrum 2012, 3. - PMC - PubMed
    1. Birmingham K., Gradinaru V., Anikeeva P., Grill W. M., Pikov V., McLaughlin B., Pasricha P., Weber D., Ludwig K., Famm K., Nat. Rev. Drug Discovery 2014, 13, 399. - PubMed
    1. de Groat W. C., Tai C., Bioelectron. Med. 2015, 2, 25. - PMC - PubMed

Publication types

LinkOut - more resources