A pooled testing system to rapidly identify cattle carrying the elite controller BoLA-DRB3*009:02 haplotype against bovine leukemia virus infection
- PMID: 34837483
- PMCID: PMC9543338
- DOI: 10.1111/tan.14502
A pooled testing system to rapidly identify cattle carrying the elite controller BoLA-DRB3*009:02 haplotype against bovine leukemia virus infection
Abstract
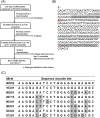
As genetically resistant individuals, the "elite controllers" (ECs) of human immunodeficiency virus infection have been focused on as the keys to developing further functional treatments in medicine. In the livestock production field, identifying the ECs of bovine leukemia virus (BLV) infection in cattle is desired to stop BLV transmission chains on farms. Cattle carrying the bovine leukocyte antigen (BoLA)-DRB3*009:02 allele (DRB3*009:02) have a strong possibility of being BLV ECs. Most of cattle carrying this allele maintain undetectable BLV proviral loads and do not shed virus even when infected. BLV ECs can act as transmission barriers when placed between uninfected and infected cattle in a barn. To identify cattle carrying DRB3*009:02 in large populations more easily, we developed a pooled testing system. It employs a highly sensitive, specific real-time PCR assay and TaqMan MGB probes (DRB3*009:02-TaqMan assay). Using this system, we determined the percentage of DRB3*009:02-carrying cattle on Kyushu Island, Japan. Our pooled testing system detected cattle carrying the DRB3*009:02 allele from a DNA pool containing one DRB3*009:02-positive animal and 29 cattle with other alleles. Its capacity is sufficient for herd-level screening for DRB3*009:02-carrying cattle. The DRB3*009:02-TaqMan assay showed high-discriminative sensitivity and specificity toward DRB3*009:02, making it suitable for identifying DRB3*009:02-carrying cattle in post-screening tests on individuals. We determined that the percentage of DRB3*009:02-carrying cattle in Kyushu Island was 10.56%. With its ease of use and reliable detection, this new method strengthens the laboratory typing for DRB3*009:02-carrying cattle. Thus, our findings support the use of BLV ECs in the field.
Keywords: BoLA-DRB3*009:02; TaqMan assay; allele-specific PCR; bovine leukemia virus; elite controllers; pooled samples.
© 2021 The Authors. HLA: Immune Response Genetics published by John Wiley & Sons Ltd.
Conflict of interest statement
The authors declare that they have no conflict of interest.
Figures


Similar articles
-
Identifying Pathogen and Allele Type Simultaneously in a Single Well Using Droplet Digital PCR.mSphere. 2023 Feb 21;8(1):e0049322. doi: 10.1128/msphere.00493-22. Epub 2023 Jan 10. mSphere. 2023. PMID: 36625728 Free PMC article.
-
Identification of bovine leukocyte antigen class II haplotypes associated with variations in bovine leukemia virus proviral load in Japanese Black cattle.Tissue Antigens. 2013 Feb;81(2):72-82. doi: 10.1111/tan.12041. Epub 2012 Dec 6. Tissue Antigens. 2013. PMID: 23216331
-
BoLA-DRB3 alleles influence proviral load and peripheral blood lymphocyte distribution in bovine leukaemia virus-infected cattle.Vet Rec. 2024 Dec 14;195(12):e4909. doi: 10.1002/vetr.4909. Epub 2024 Dec 11. Vet Rec. 2024. PMID: 39660663
-
Bovine leukemia virus proviral load is more strongly associated with bovine major histocompatibility complex class II DRB3 polymorphism than with DQA1 polymorphism in Holstein cow in Japan.Retrovirology. 2019 May 16;16(1):14. doi: 10.1186/s12977-019-0476-z. Retrovirology. 2019. PMID: 31096993 Free PMC article.
-
Graduate Student Literature Review: The DRB3 gene of the bovine major histocompatibility complex-Discovery, diversity, and distribution of alleles in commercial breeds of cattle and applications for development of vaccines.J Dairy Sci. 2024 Dec;107(12):11324-11341. doi: 10.3168/jds.2023-24628. Epub 2024 Jul 14. J Dairy Sci. 2024. PMID: 39004123 Review.
Cited by
-
Identifying Pathogen and Allele Type Simultaneously in a Single Well Using Droplet Digital PCR.mSphere. 2023 Feb 21;8(1):e0049322. doi: 10.1128/msphere.00493-22. Epub 2023 Jan 10. mSphere. 2023. PMID: 36625728 Free PMC article.
-
Investigating BoLA Class II DRB3*009:02 carrying cattle in Japan.Vet Anim Sci. 2025 Jan 4;27:100425. doi: 10.1016/j.vas.2025.100425. eCollection 2025 Mar. Vet Anim Sci. 2025. PMID: 39867943 Free PMC article.
-
A survey of bovine leukemia virus resistant bovine leukocyte antigen (BoLA)-DRB3*009:02 allele-carrying Japanese Black cattle in two prefectures in Japan.J Vet Med Sci. 2022 Nov 1;84(11):1457-1460. doi: 10.1292/jvms.22-0285. Epub 2022 Sep 28. J Vet Med Sci. 2022. PMID: 36171135 Free PMC article.
References
-
- Maeda N, Fan H, Yoshikai Y. Oncogenesis by retroviruses: old and new paradigms. Rev Med Virol. 2008;18(6):387‐405. - PubMed
Publication types
MeSH terms
Substances
LinkOut - more resources
Full Text Sources
Research Materials

