. 2021 Nov 27;19(1):396.
doi: 10.1186/s12951-021-01137-3.

Hepatic small extracellular vesicles promote microvascular endothelial hyperpermeability during NAFLD via novel-miRNA-7

Affiliations

Hepatic small extracellular vesicles promote microvascular endothelial hyperpermeability during NAFLD via novel-miRNA-7

Rui Zuo et al. J Nanobiotechnology. .

Abstract

Background: A recent study has reported that patients with nonalcoholic fatty liver disease (NAFLD) are more susceptible to coronary microvascular dysfunction (CMD), which may predict major adverse cardiac events. However, little is known regarding the causes of CMD during NAFLD. In this study, we aimed to explore the role of hepatic small extracellular vesicles (sEVs) in regulating the endothelial dysfunction of coronary microvessels during NAFLD.

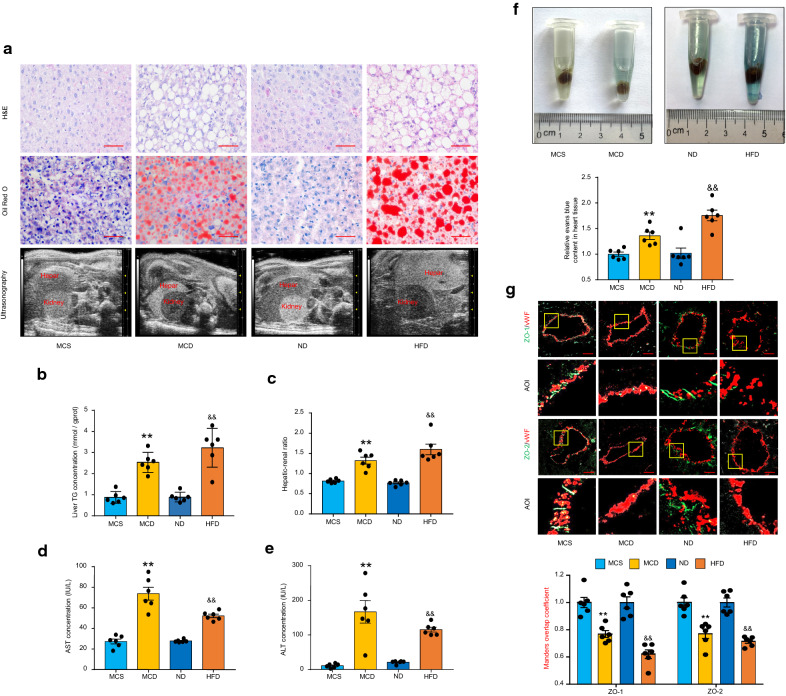
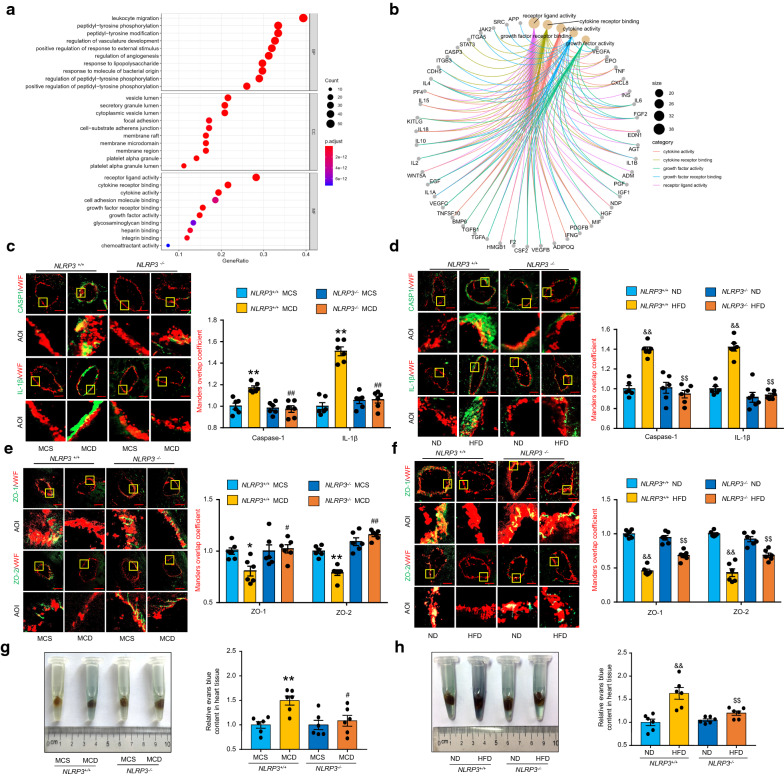
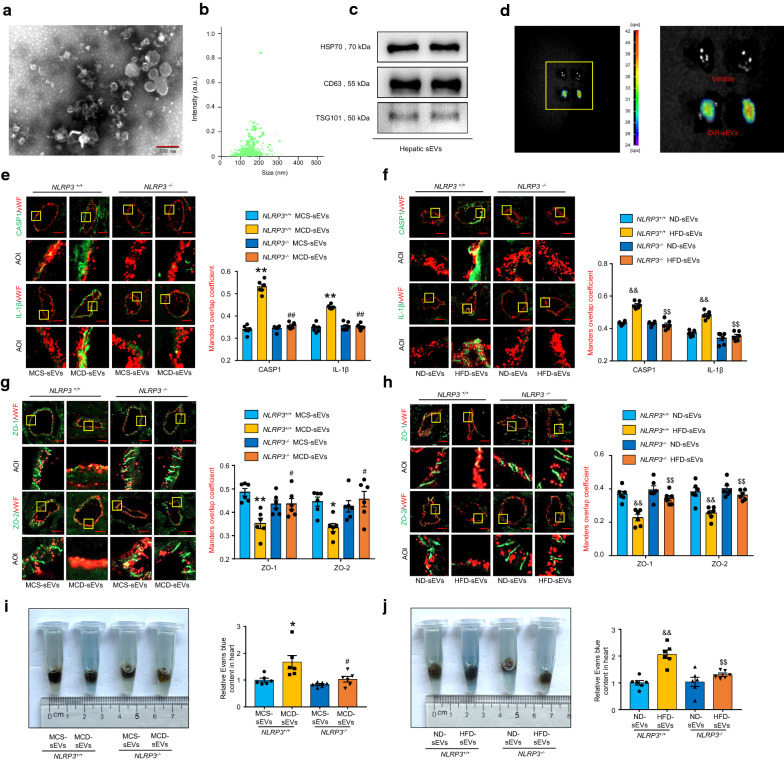
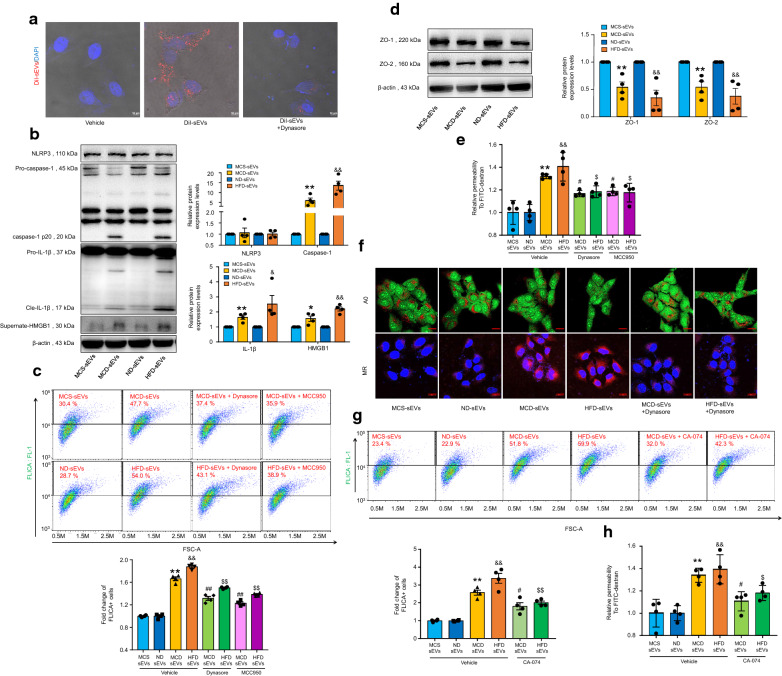
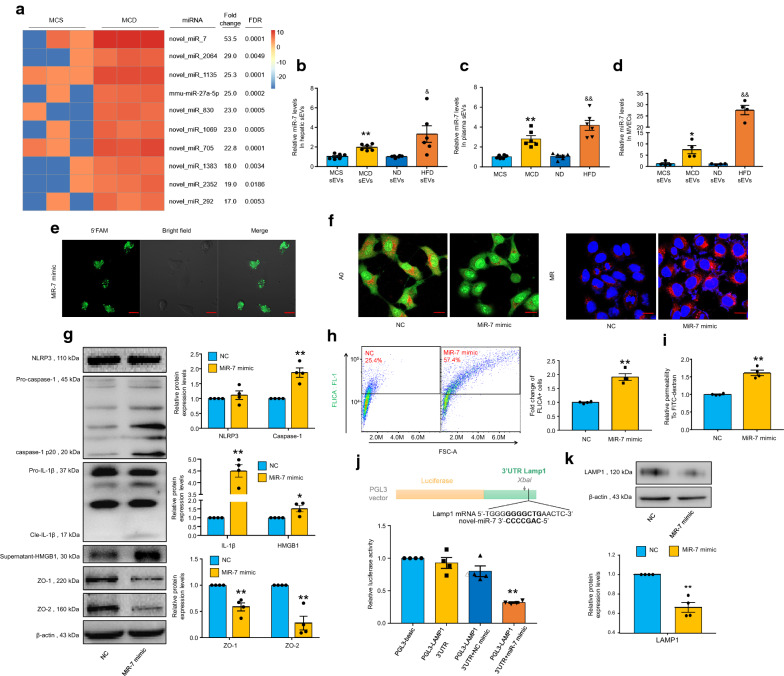
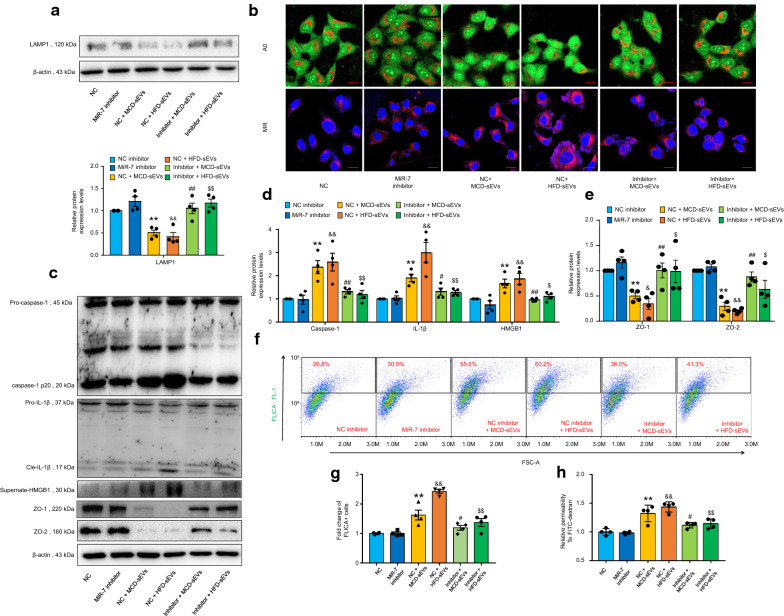
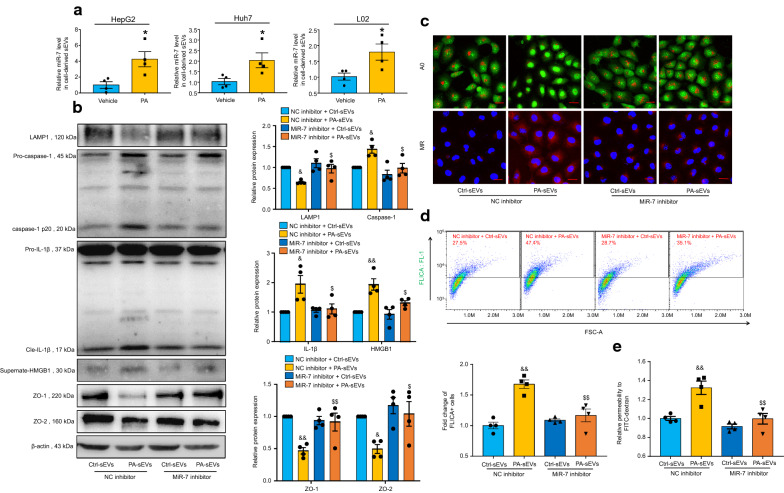
Results: We established two murine NAFLD models by feeding mice a methionine-choline-deficient (MCD) diet for 4 weeks or a high-fat diet (HFD) for 16 weeks. We found that the NOD-like receptor family, pyrin domain containing 3 (NLRP3) inflammasome-dependent endothelial hyperpermeability occurred in coronary microvessels during both MCD diet and HFD-induced NAFLD. The in vivo and in vitro experiments proved that novel-microRNA(miR)-7-abundant hepatic sEVs were responsible for NLRP3 inflammasome-dependent endothelial barrier dysfunction. Mechanistically, novel-miR-7 directly targeted lysosomal associated membrane protein 1 (LAMP1) and promotes lysosomal membrane permeability (LMP), which in turn induced Cathepsin B-dependent NLRP3 inflammasome activation and microvascular endothelial hyperpermeability. Conversely, a specific novel-miR-7 inhibitor markedly improved endothelial barrier integrity. Finally, we proved that steatotic hepatocyte was a significant source of novel-miR-7-contained hepatic sEVs, and steatotic hepatocyte-derived sEVs were able to promote NLRP3 inflammasome-dependent microvascular endothelial hyperpermeability through novel-miR-7.

Conclusions: Hepatic sEVs contribute to endothelial hyperpermeability in coronary microvessels by delivering novel-miR-7 and targeting the LAMP1/Cathepsin B/NLRP3 inflammasome axis during NAFLD. Our study brings new insights into the liver-to-microvessel cross-talk and may provide a new diagnostic biomarker and treatment target for microvascular complications of NAFLD.

Keywords: Inter-organ communication; Liver inflammation; Microvascular endothelial dysfunction; NLRP3 inflammasome; Tight junction.


Conflict of interest statement

All authors declared no conflict of interests.

Figures

Fig. 1
Fig. 1
Endothelial permeability is enhanced in coronary microvessels of NAFLD mice. Mice were fed a MCD diet for 4 weeks or HFD for 16 weeks to induce NAFLD. A Representative images of liver H&E staining, oil red O staining and B-scan ultrasonographic imaging, n = 6 per group. Scale bar: 200 μm. B Liver triglyceride (TG) content, n = 6 per group. C The ratio of hepatic-renal echo-intensity, n = 6 per group. D, E Plasma levels of aspartate aminotransferase (AST) and alanine aminotransferase (ALT), n = 6 per group. F Representative images and the summarized data of Evans blue concentration in heart tissues, n = 6 per group. G Representative fluorescent confocal images of ZO-1/2 (green) with vWF (red) and the summarized data of the Manders overlap coefficient of ZO-1/2 over vWF. The area of interest (AOI) is selected for higher magnification, n = 6 per group. Scale bar, 20 μm. Data are expressed as the mean ± SEM. Statistics: Student t-test, **P < 0.01 vs. the MCS group; &&P < 0.01 vs. the ND group
Fig. 2
Fig. 2
NLRP3 inflammasome mediates endothelial hyperpermeability of coronary microvessels in NAFLD mice. The human targets of microvascular hyperpermeability was gathered from the GeneCards database, and the Gene Ontology (GO) analysis was performed to analyze the main function of target genes. NLRP3+/+ and NLRP3−/− mice were fed a MCD diet for 4 weeks or HFD for 16 weeks to induce NAFLD. A, B GO enrichment analysis of the human targets of microvascular hyperpermeability. The size of the circles represents the number of child GO term. The color represents the significance of the enrichment or the category of molecular function. BP: Biological Process, CC: Cellular Component, MF: Molecular Function. CF Representative fluorescent confocal images of cleaved-caspase-1(CASP1), IL-1β, and ZO-1/2 (green) with vWF (red) and the summarized data of the Manders overlap coefficient. The area of interest (AOI) is selected for higher magnification, n = 6 per group. Scale bar, 20 μm. G, H Representative images and the summarized data of Evans blue concentrations in heart tissues, n = 6 per group. Data are expressed as the mean ± SEM. Statistics: One-way ANOVA, *P < 0.05, **P < 0.01 vs. NLRP3+/+ mice fed with MCS diet; #P < 0.05, ##P < 0.01 vs. NLRP3+/+ mice fed with MCD diet; &&P < 0.01 vs. NLRP3+/+ mice fed with ND; $$P < 0.01 vs. NLRP3+/+ mice fed with HFD
Fig. 3
Fig. 3
Circulating NAFLD hepatic sEV induces NLRP3 inflammasome-dependent endothelial hyperpermeability in coronary microvessels. NAFLD or control hepatic sEVs were isolated by differential ultracentrifugation, identified, and administered to naive NLRP3+/+ and NLRP3−/− mice via caudal vein injection. A Representative electron micrograph of sEVs reveals the morphology and size. Scale bar, 200 nm. B Size distribution analysis of sEVs by nanoparticle tracking analysis. C Western blot analyses of sEV markers, including CD63, HSP70, and TSG101. D In vivo optical imaging system-obtained fluorescence imaging of cardiac tissue, n = 6 per group. The pellet derived from the ultracentrifugation of DiR alone was used as a vehicle control. EH Representative fluorescent confocal images of cleaved-caspase-1(CASP1), IL-1β, and ZO-1/2 (green) with vWF (red) and the summarized data of the Manders overlap coefficient. The area of interest (AOI) is selected for higher magnification, n = 6 per group. Scale bar, 20 μm. I, J Representative images and the summarized data of Evans blue concentrations in heart tissues, n = 6 per group. Data are expressed as the mean ± SEM. Statistics: One-way ANOVA, *P < 0.05, **P < 0.01 vs. NLRP3+/+ mice injected with MCS hepatic sEVs; #P < 0.05, ##P < 0.01 vs. NLRP3+/+ mice injected with MCD hepatic sEVs. &&P < 0.01 vs. NLRP3+/+ mice injected with ND hepatic sEVs; $$P < 0.01 vs. NLRP3+/+ mice injected with HFD hepatic sEVs
Fig. 4
Fig. 4
NAFLD hepatic sEVs induce microvascular endothelial hyperpermeability by activating Cathepsin B-dependent NLRP3 inflammasome axis. A MVECs were pretreated with or without 20 μmol/L dynasore for 40 min, followed by incubation of 120 μg/mL DiI-labeled hepatic sEVs for 8 h. Representative fluorescent confocal images of DiI-labeled hepatic sEVs (red) with DAPI (blue), n = 4 per group. The pellet derived from the ultracentrifugation of DiI alone was used as a vehicle control. Scale bar, 10 μm. B Representative western blot bands and the summarized data determined by densitometric analysis, n = 4 per group. C Representative flow cytometry images of caspase-1 FLICA staining and the summarized data of the positive cells, n = 4 per group. The fold changes were obtained by calculating the ratio of the positive cells of the treated groups to the MCS or ND group. D Representative Western blot bands and the summarized data determined by densitometric analysis, n = 4 per group. E Relative permeability of endothelial monolayer to FITC-dextran, n = 4 per group. F Representative images of acridine orange (AO) and magic red (MR) staining, n = 4 per group. Scale bar, 20 μm. G MVECs were incubated with 120 μg/mL hepatic sEVs for 24 h with or without the presence of 5 μmol/L CA-074. Representative flow cytometry images of caspase-1 FLICA staining, n = 4 per group. The fold changes were obtained by calculating the ratio of the positive cells of the treated groups to the MCS or ND group. H Relative permeability of endothelial monolayer to FITC-dextran, n = 4 per group. Data are expressed as the mean ± SEM. Statistics: Student t-test (B, D) and One-way ANOVA (C, E, G, H), *P < 0.05, **P < 0.01 vs. MVECs incubated with MCS hepatic sEVs; #P < 0.05, ##P < 0.01 vs. MVECs incubated with MCD hepatic sEVs; &P < 0.05, &&P < 0.01 vs. MVECs incubated with ND hepatic sEVs; $P < 0.05, $$P < 0.01 vs. MVECs incubated with HFD hepatic sEVs
Fig. 5
Fig. 5
Novel-miR-7 is a key hepatic sEV cargo that promotes microvascular endothelial hyperpermeability by targeting LAMP1. Hepatic sEV miRNAs were profiled by the small RNA sequencing analysis. MVECs were incubated with 120 μg/mL hepatic sEVs for 24 h (D) or transfected with 50 nmol/L novel-miR-7 mimics or negative control (NC) mimic (EK). A The heat-map of the ten miRNAs with the most significant (fold change > 10, FDR < 0.05) abundance differences in hepatic sEVs derived from the MCD group versus the MCS group, n = 3 per group. B, C Quantitative PCR analysis of novel-miR-7 expression levels in hepatic sEVs and mouse plasma-derived sEVs, n = 6 per group. D Quantitative PCR analysis of novel-miR-7 expression levels in hepatic sEVs-treated MVECs, n = 4 per group. E Transfection efficiency of 5-FAM labeled novel-miR-7 mimics. Scale bar, 20 μm. F Representative images of acridine orange (AO) and magic red (MR) staining, n = 4 per group. Scale bar, 20 μm. G Representative Western blot bands and the summarized data determined by densitometric analysis, n = 4 per group. H Representative flow cytometry images of caspase-1 FLICA staining and the summarized data of the positive cells, n = 4 per group. The fold changes were obtained by calculating the ratio of the positive cells of the treated groups to the NC group. I Relative permeability of the endothelial monolayer to FITC-dextran, n = 4 per group. J LAMP1 reporter gene activity was performed using a dual-luciferase reporter assay system and normalized relative to Renilla luciferase activity, n = 4 per group. K Representative western blot bands and the summarized data determined by densitometric analysis, n = 4 per group. Data are expressed as the mean ± SEM. Statistics: Student t-test (BD, GI, K) and One-way ANOVA (J), *P < 0.05, **P < 0.01 vs. hepatic sEVs or plasma-sEVs derived from MCS group, or MVEC treated with MCS-sEVs, or NC mimic; &P < 0.05, &&P < 0.01 vs. hepatic sEVs or plasma-sEVs derived from ND group, or MVEC treated with ND-sEVs
Fig. 6
Fig. 6
Genetic inhibition of novel-miR-7 ameliorates NAFLD hepatic sEV-induced microvascular endothelial hyperpermeability. MVECs were transfected with 100 nmol/L novel-miR-7 inhibitor or negative control (NC) inhibitor and incubated with or without 120 μg/mL NAFLD hepatic sEVs for 24 h. A Representative western blot bands and the summarized data determined by densitometric analysis, n = 4 per group. B Representative images of acridine orange (AO) and magic red (MR) staining, n = 4 per group. Scale bar, 20 μm. C Representative western blot bands, n = 4 per group. D The summarized data of caspase-1, IL-1β and supernate HMGB1 of WB analysis determined by densitometric analysis, n = 4 per group. E The summarized data of ZO-1 and ZO-2 of WB analysis determined by densitometric analysis, n = 4 per group. F Representative flow cytometry images of caspase-1 FLICA staining, n = 4 per group. G The summarized data of the positive cells of FLICA staning, n = 4 per group. The fold changes were obtained by calculating the ratio of the positive cells of the treated groups to the NC inhibitor group. H Relative permeability of the endothelial monolayer to FITC-dextran, n = 4 per group. Data are expressed as the mean ± SEM. Statistics: One-way ANOVA, **P < 0.01 vs. NC inhibitor group; #P < 0.05, ##P < 0.01 vs. NC inhibitor plus MCD hepatic sEVs group; &P < 0.05, &&P < 0.01 vs. NC inhibitor group; $P < 0.05, $$P < 0.01 vs. NC inhibitor plus HFD hepatic sEVs group
Fig. 7
Fig. 7
Steatotic hepatocyte is a significant source of novel-miR-7-enriched sEV. Human hepatocyte cell line were treated with 100 μmol/L palmitic acid (PA) or vehicle for 18 h. Hepatocyte sEVs in the HepG2 cell culture media were collected by ultracentrifugation. Human microvascular endothelial cell line-1 (HMEC-1) was transfected with 100 nmol/L novel-miR-7 inhibitor or negative control (NC) inhibitor, and incubated with Ctrl-sEVs or PA-sEVs from HepG2 for 24 h. A HepG2, HuH7 and L02 were treated with 100 μmol/L PA or vehicle for 18 h. SEVs were collected from the supernatant and the expression levels of novel-miR-7 were measured by qPCR analysis, n = 4 per group. B Representative western blot bands and the summarized data determined by densitometric analysis, n = 4 per group. C Representative images of acridine orange (AO) and magic red (MR) staining, n = 4 per group. Scale bar, 20 μm. D Representative flow cytometry images of caspase-1 FLICA staining and the summarized data of the positive cells, n = 4 per group. The fold changes were obtained by calculating the ratio of the positive cells of the treated groups to the NC inhibitor group. E Relative permeability of the endothelial monolayer to FITC-dextran, n = 4 per group. Data are expressed as the mean ± SEM. Statistics: Student t-test (A) and One-way ANOVA (B, D, E), *P < 0.05, **P < 0.01 vs. vehicle group; &P < 0.05, &&P < 0.01 vs. NC inhibitor plus ctrl-sEVs group; $P < 0.05, $$P < 0.01 vs. NC inhibitor plus PA-sEVs

References

    1. Musso G, Cassader M, Gambino R. Non-alcoholic steatohepatitis: emerging molecular targets and therapeutic strategies. Nat Rev Drug Discov. 2016;15(4):249–274. doi: 10.1038/nrd.2015.3. - DOI - PubMed
    1. Vita T, Murphy D, Osborne M, Bajaj N, Keraliya A, Jacob S, et al. Association between nonalcoholic fatty liver disease at CT and coronary microvascular dysfunction at myocardial perfusion PET/CT. Radiology. 2019;291(2):330–337. doi: 10.1148/radiol.2019181793. - DOI - PMC - PubMed
    1. Pinarbaşi B, Demır K, Oflaz H, Ahishali E, Akyüz F, Elıtok A, et al. Measurement of the coronary flow velocity reserve in patients with non-alcoholic fatty liver disease. Turk J Gastroenterol. 2012;23(6):720–726. doi: 10.4318/tjg.2012.0489. - DOI - PubMed
    1. Yilmaz Y, Kurt R, Yonal O, Polat N, Celikel C, Gurdal A, et al. Coronary flow reserve is impaired in patients with nonalcoholic fatty liver disease: association with liver fibrosis. Atherosclerosis. 2010;211(1):182–186. doi: 10.1016/j.atherosclerosis.2010.01.049. - DOI - PubMed
    1. Vancheri F, Longo G, Vancheri S, Henein M. Coronary microvascular dysfunction. J Clin Med. 2020; 9(9). - PMC - PubMed

MeSH terms