. 2021 Nov 27;14(1):200.
doi: 10.1186/s13045-021-01207-x.

Amplification of spatially isolated adenosine pathway by tumor-macrophage interaction induces anti-PD1 resistance in hepatocellular carcinoma

Affiliations

Amplification of spatially isolated adenosine pathway by tumor-macrophage interaction induces anti-PD1 resistance in hepatocellular carcinoma

Jia-Cheng Lu et al. J Hematol Oncol. .

Abstract

Background: Immune checkpoint blockade resistance narrows the efficacy of cancer immunotherapies, but the underlying mechanism remains elusive. Delineating the inherent mechanisms of anti-PD1 resistance is important to improve outcome of patients with advanced HCC.

Method: The level of cricTMEM181 was measured in HCC patients with anti-PD1 therapy by RNA sequencing and then confirmed by qPCR and Sanger sequencing. Immune status in tumor microenvironment of HCC patients or mice models was evaluated by flow cytometry and IHC. Exosomes from HCC cell lines were isolated by ultracentrifugation, and their internalization by macrophage was confirmed by immunofluorescence. The underlying mechanism of HCC-derived exosomal circTMEM181 to macrophage was confirmed by SILAC, RNA FISH and RNA immunoprecipitation. The ATP-ADO pathway amplified by HCC-macrophage interaction was evaluated through ATP, AMP and ADO measurement and macrophage-specific CD39 knockout mice. The role of circTMEM181 in anti-PD1 therapy and its clinical significance were also determined in our retrospective HCC cohorts.

Results: Here, we found that circTMEM181 was elevated in hepatocellular carcinoma (HCC) patients responding poorly to anti-PD1 therapy and in HCC patients with a poor prognosis after operation. Moreover, we also found that high exosomal circTMEM181 favored the immunosuppressive microenvironment and endowed anti-PD1 resistance in HCC. Mechanistically, exosomal circTMEM181 sponged miR-488-3p and upregulated CD39 expression in macrophages. Using macrophage-specific CD39 knockout mice and pharmacologic approaches, we revealed a novel mode of anti-PD1 resistance in HCC. We discovered that cell-specific CD39 expression in macrophages and CD73 expression in HCC cells synergistically activated the eATP-adenosine pathway and produced more adenosine, thereby impairing CD8+ T cell function and driving anti-PD1 resistance.

Conclusion: In summary, HCC-derived exosomal circTMEM181 contributes to immunosuppression and anti-PD1 resistance by elevating CD39 expression, and inhibiting the ATP-adenosine pathway by targeting CD39 on macrophages can rescue anti-PD1 therapy resistance in HCC.

Keywords: ATP–adenosine pathway; CD39; Exosomal circRNA; Hepatocellular carcinoma; Macrophage.


Conflict of interest statement

All the authors declared that no competing interest exists.

Figures

Fig. 1
Fig. 1
CircTMEM181 is associated with poor prognosis in HCC patients. a Changes in tumor size in six patients after anti-PD1 treatment, evaluated by iRECIST. The blue line represents PR (partial response, n = 3), and the orange line represents PD (progressive disease, n = 3). b Heatmap of circRNA expression in tumor tissue biopsies from HCC patients showing PR or PD after anti-PD1 treatment. c Schematic illustration of circTMEM181 formation (Top). Sanger sequencing shows the back-splice sites (Bottom). d A total of 60 paired HCC tumor tissues (T) and para-tumor normal liver tissue (PT) were subjected to qPCR to detect circTMEM181 expression. e, f Representative images of H&E staining and in situ hybridization analysis of circTMEM181 expression in HCC tumor tissue or para-tumor normal liver. Statistical results show a higher level of cicTMEM181 in HCC tumor tissue (T) than in the paired para-tumor normal liver (PT) (n = 204; paired t test, ***: p < 0.001). g, h Kaplan–Meier estimate of overall survival or cumulative recurrence in the cohort with different levels of cirTMEM181 (n = 204, logrank test). i Heatmap of 204 HCC patients with their clinicopathologic characteristics grouped by circTMEM181 expression (blue indicates the high or positive group of the characteristic; the red frame indicates microvascular invasion and shows significant positive correlation to circTMEM181). Forest plot of univariate or multivariable Cox proportional hazard regression indicates the impact of different characteristics on overall survival (OS)
Fig. 2
Fig. 2
Accumulation of circTMEM181 forms an anti-PD1-resistant immune status in the HCC tumor microenvironment. a Levels of circTMEM181 were measured by qPCR in six different HCC cell lines. b Representative images of Transwell assays show metastatic ability after circTMEM181 manipulation in the two HCC cell lines (Left). Statistical results of Transwell assays are shown (Right, t test, ns: not significant). c Representative images of colony formation assay with crystal violet staining reveal the effects of circTMEM181 on the two HCC cell lines (Left). Statistical results of the colony formation assay are shown (Right, t test, ns: no statistical significance). d Representative fluorescence photography of the two groups at 22 days after anti-PD1 therapy in the orthotopic xenograft model of liver cancer (α-PD1: anti-PD1 therapy) (t test, **: p < 0.01). e Survival curves of six mice per group are shown (logrank test; death or tumor volume > 2.5 cm3 were defined as event happened). f H22 cell line overexpressing circTMEM181 (H22OE) shows more metastatic lung nodules than the control group (H22ctrl) in the C57 mouse model (n = 6 mice for each group, t test). g tSNE plot and statistical results depict different clusters of CD45+ tumor-infiltrating leukocytes from the H22OE and H22ctrl group after anti-PD1 therapy. h Representative mIHC images show macrophages and CD8+ T cells in tumors of the H22OE and H22ctrl group (Left). Statistical results show less CD8+ T cells and more CD163+ F4/80+ macrophages in the tumor microenvironment in the H22OE group than in the H22ctrl group after anti-PD1 therapy (t test). i IHC for CD4 T cells (CD4+), CD8 T cells (CD8+), NK cells (CD56+), B cells (CD19+), macrophages (CD68+), and M2 macrophages (CD163+) from two representative patients with different circTMEM181 expression from our 204 patient cohort. j Statistical results show a positive correlation between CD163+ macrophages and circTMEM181, but a negative correlation between CD8+ T cells and circTMEM181 in our 204 patient cohort (Pearson correlation)
Fig. 3
Fig. 3
Exosomal circTMEM181 from HCC is internalized by macrophage and sponged miR-488-3p in macrophage. a Schematic diagram: CD8+ T cells isolated from human PBMCs were co-cultured with Huh-7circOE, Huh-7ctrl, or THP-1 or the supernatant from THP-1 and Huh-7OE co-culture medium. b Flow cytometry analysis was used to evaluate proliferation of CFSE-labeled CD8+ T cells in different conditions (Sup.: supernatant of THP-1 and Huh-7OE co-culture medium; one-way ANOVA: ***: p < 0.001, **: p < 0.01, *: p < 0.05, ns: not significant). c Flow cytometry analysis of PD1, TIM3, and TIGIT expression on CD8+ T cells from different culture conditions. (MFI, mean fluorescent intensity; one-way ANOVA: ***: p < 0.001, **: p < 0.01, *: p < 0.05, ns: not significant). d Representative picture of exosomes enriched using ultracentrifugation from medium of Huh-7 by transmission electron microscopy (Left); Nanoparticle tracking analysis was performed to analyze the size distribution of enriched exosomes from different HCC cell lines (Right). e Exosomal markers CD63 and TSG101 were detected on enriched exosomes across four human HCC cell lines and two mouse HCC cell lines. f CircTMEM181 expression was analyzed in cell lysates or extracellular vesicles (EVs) across different manipulations of various cell lines (OE: overexpressing circTMEM181; Sh: circTMEM181 knock down). g CircTMEM181 expression was analyzed in THP-1 macrophages co-cultured with or without Huh-7ctrl or Huh-7OE or GW4869 (one-way ANOVA: ***: p < 0.001, **: p < 0.01, ns: not significant). h Immunofluorescence shows exosomes pre-labeled with PKH-67 (green) from Huh-7OE can be internalized by THP-1 (white arrow). i RNA immunoprecipitation with circTMEM181-specific probes shows enrichment of RNAs in THP-1 overexpressing circTMEM181 (THP-1circOE) compared to the control (THP-1ctrl). j Schematic diagram: putative binding sites of wild-type circTMEM181, hsa-miR-488-3p, hsa-miR-1298 and mutant circTMEM181. k Detection of wild-type circTMEM181-labeled luciferase (WT) or mutant circTMEM181-labeled luciferase (MU) activity in HEK293T cells after miR-488-3p or miR-1298 transfection (t test, *: p < 0.05, **: p < 0.01, ns: not significant). l RNA immunoprecipitation with circTMEM181-specific probes performed in HEK293T cells using biotin-labeled miR-488-3p mimics and a negative control (NC). m CD8+ T cells isolated from human PBMCs were co-cultured with supernatant of medium from co-culturing Huh-7OE and THP-1 overexpressing miR-488-3p (THP-1miR−OE). n FISH analysis of circTMEM181 (green) and miR-488-3p (red) demonstrates their colocalization in the THP-1 cytoplasm
Fig. 4
Fig. 4
Multi-omics analysis identifies CD39 expression as a target in the circTMEM181-miR-488-3p axis in macrophages. a Volcano plot shows varied protein profiles between heavy (H) and light (L) medium. Significantly upregulated proteins in the heavy group are colored in red, while significantly down-regulated proteins in light group are in blue. THP-1 co-cultured with exosomes from HepG2OE (THP-1co−exoOE) and paired THP-1 co-cultured with exosomes from HepG2Ctrl (THP-1co−exoCtrl) were subjected to SILAC. THP-1co−exoOE were co-cultured with heavy medium (HOE), and THP-1co−exoCtrl with light medium (LCtrl) (Left). THP-1co−exoCtrl were co-cultured with heavy medium (HCtrl), and THP-1co−exoOE with light medium (LOE) (Right). b Venn diagrams show that 165 proteins were upregulated in the intersection of these two forward–reverse experiments (Left). Pathway enrichment of the differentiated proteins according to KEGG and GO analysis (Right). c Venn diagrams show 12 mRNAs in the overlap of mRNAs that miRNA 488-3p can target and upregulated proteins in THP-1circOE. d ENTPD1 and PLAC8 connect to miR-488-3p by TargetScan prediction. e, f The level of ENTPD1 was detected in different conditions manipulating circTMEM181, GW4869, or miR-488-3p (t test, ***: p < 0.001, **: p < 0.01, *: p < 0.05). g Summary of three scRNAseq samples of human HCC tumor tissues from GEO datasets (GSE140228 (10 ×), GSE140228 (Smartseq2) ,and GSE125449). Monocytes/macrophages in the HCC tumor microenvironment show high expression of CD39 across the three datasets. h UMAP analysis showing scRNAseq data of different tumor-infiltrating immune cells in HCC (GSE140228 (10 ×)). Tumor-infiltrating macrophages express a high level of CD39 (ENTPD1) but do not express CD73 (NT5E)
Fig. 5
Fig. 5
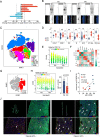
Spatially isolated activation of the ATP–adenosine pathway by macrophages and HCC cell cooperation impairs antitumor immunity. a WB analysis shows CD39, CD73, and GAPDH expression across the six HCC cell lines (Huh-7, PLC/PRF/5, Li-7, HepG2, 97H, and HCCLM3) and THP-1circOE. b Flow cytometry analysis shows CD39 expression on THP-1 or TAM increased after co-culturing with Li-7OE, but was rescued after incubating with GW4869. CD73 was detected on Li-7OE co-cultured with/without THP-1, but not detected on TAM or THP-1 with/without co-culturing conditions. c Heatmap shows the level of eATP, AMP, and ADO in medium with different conditions. d Detection of the function of sorted TAM after co-culturing with Li-7OE or with CD39 inhibitor POM-1. TAM showed an M2 polarization, expressing higher CD163, secreting more IL-10 and less TNFα after co-culturing with Li-7OE (one-way ANOVA: ***: p < 0.001, **: p < 0.01, *: p < 0.05). e, f Flow cytometry analysis and statistics show proliferation of CFSE-labeled CD8+ T cells in medium with different conditions. Top left to right: CD8+ T cells cultured with the supernatant from THP-1 (Ctrl), CD8+ T cells cultured with ADO (ADO), CD8+ T cells cultured with the supernatant from THP-1 and Li-7OE co-cultured medium (SPNT(Co)), CD8+ T cells cultured with the supernatant from THP-1 and Li-7OE co-cultured medium pre-adding POM1 (SPNT(Co + POM1)). Bottom left to right: CD8+ T cells cultured with Li-7OE (Ctrl(co-Li-7OE)), CD8+ T cells cultured with Li-7OE and AMP (AMP(co-Li-7OE)), CD8+ T cells cultured with Li-7OE and ADP (ADP(co-Li-7OE)), CD8+ T cells cultured with Li-7OE and ATP (ATP(co-Li-7OE)) (one-way ANOVA: ***: p < 0.001, **: p < 0.01, *: p < 0.05, ns: not significant). g Flow cytometry analysis of PD1, TIM3 expression on CD8+ T cells with/without ADO. (MFI, mean fluorescent intensity; t test: **: p < 0.01, *: p < 0.05). h Multi-label immunofluorescence showing CD39 expression (red) on CD68+ macrophages (purple), and CD73 expression (yellow) on CK8+ HCC tumor cells (Green) in the HCC tumor microenvironment (white arrow indicates spatial isolated CD73+ CK8+ HCC cells and CD39+ CD68+ macrophages; dotted line circle indicates the niches where CD39+ CD68+ macrophages are surrounded by CD73+ CK8+ HCC tumor cells). i Graphical abstract showing the activation of the spatial isolated ATP–adenosine pathway by tumor–macrophage communication in the HCC tumor microenvironment
Fig. 6
Fig. 6
Targeting CD39 on macrophages is a potential therapeutic strategy to overcome immunotherapy resistance in HCC. a Tumor size was measured over time after H22Ctrl (H22 overexpressing Control) or H22OE (H22 overexpressing circTMEM181) were used to construct tumor xenografts in the C57wt (C57BL/6 wild-type) or C57Entpd1−/− (C57BL/6 Entpd1-knocked-out) mouse models (n = 6 for each group; one-way ANOVA: ***: p < 0.001, **: p < 0.01, *: p < 0.05, ns: not significant). b Flow cytometry analysis shows the proportion of CD8+ T cells and GZMB+ CD8+ T cells in the tumor microenvironment of HCC mouse models (one-way ANOVA: ***: p < 0.001, **: p < 0.01, *: p < 0.05, ns: not significant). c Tumor size was measured over time following PD1 antibody (αPD1), POM1 or combination therapy (αPD1 + POM1) in C57 mouse models (n = 6 for each group; one-way ANOVA: ***: p < 0.001, ns: not significant). d Flow cytometry analysis shows proportion of CD8+ T cells and GZMB+ CD8+ T cells in the tumor microenvironment of HCC mouse models (one-way ANOVA: ***: p < 0.001, **: p < 0.01, *: p < 0.05, ns: not significant). e Tumor size was measured over time following treatment with PD1 antibody + infusion of exosome enriched from H22OE medium (αPD1 + i.v. ExoOE) or H22 Ctrl medium (αPD1 + i.v. ExoCtrl) in C57wt mouse models (n = 5 for each group; t test). f Flow cytometry analysis of the tumor microenvironment indicates a significant increase in CD39 expression on TAM (CD11b+ F4/80+) after infusion of exosomes enriched from H22OE medium and the CD39high TAM tended to be co-expressed with CD163high (Top). Statistical results show the proportion of CD8+ T cells and GZMB+ CD8+ T cells in the tumor microenvironment of HCC mouse models (t test). g Representative fluorescence photography of the two indicated groups at different time points after anti-PD1 therapy in the orthotopic xenograft model of liver cancer (t test, **: p < 0.01). h tSNE plot of different major clusters in CD45+ tumor-infiltrating immune cells from the two indicated groups. i tSNE plot of CD39 fluorescence intensity in different clusters between the two indicated groups. j Flow cytometry analysis shows proportion of CD8+ T cells and GZMB+ CD8+ T cells in the tumor microenvironment (t test). k Flow cytometry analysis shows CD73 expression on CD45 H22 tumor cell in the HCC mouse model (t test). l Measurement of serum ATP and ADO concentrations 20 days after anti-PD1 therapy in the orthotopic xenograft model of liver cancer (t test)
Fig. 7
Fig. 7
HCC patients whose spatial isolated ATP–adenosine pathway was activated by tumor–macrophage communication show poor response to PD1 antibody therapy. a Bar plot indicating the change in tumor size in the nine patients after treatment with PD1 antibody nivolumab. Evaluation by iRECIST, the blue bar represents PR (partial response, n = 4) and the red line represents PD (progressive disease, n = 5). b Representative PET-CT results show tumor size of two patients before and after PD1 antibody therapy (left patient: PD; right patient: PR). c tSNE plot of different major immune cell clusters in PBMCs from the nine patients (CD4 T: CD11b CD4+ CD8 cells; CD8 T: CD11b CD4 CD8+ cells; NK: CD11b CD56+ cells; B cell: CD11b CD19+ cells; cDC: CD11b CD141+ cells; M1 like: CD11b+ CD163 cells; M2 like: CD11b+ CD163+ cells; unas.: unassigned cells). d Violin plot of different immune cell clusters in PBMCs from the nine PD, PR HCC patients after anti-PD1 therapy (CD4 T%: rate of CD4+ CD8 cells in gated CD11b cells; CD8 T%: rate of CD4 CD8+ cells in CD11b gated cells; NK%: rate of CD56+ cells in gated CD11b cells; B %: rate of CD19+ cells in gated CD11b cells; cDC %: rate of CD141+ cells in gated CD11b cells; M1 like%: rate of CD163 cells in gated CD11b+ cells; M2 like%: rate of CD163+ cells in gated CD11b+ cells; Mann–Whitney test: *: p < 0.05, ns: not significant). e Fluorescence intensities of CD163 (PE-cy7) in CD11b+ cells from the nine patients are displayed as heatmap statistics by flow cytometry analysis. f Heatmap shows the correlation trends between level of exosomal circTMEM181 in blood serum and different immune cell clusters (Spearman correlation coefficient is indicated by heatmap). g tSNE plot of CD39+ cell clusters (red) in PBMCs from the nine patients. h Fluorescence intensities of CD39 (PE) in CD11b+ cells from the nine patients are displayed as heatmap statistics of flow cytometry analysis (Left). The statistical results show the mean fluorescence intensity (MFI) difference between the PD and PR groups among the nine patients (Right; Mann–Whitney test: p = 0.032). i Correlation between level of exosomal circTMEM181 in blood serum and MFI of CD39 (PE) in CD11b+ cells from PR or PD patients (simple linear regression: R2 = 0.45, p = 0.048). j Representative multi-label-immunofluorescence image showing CD39 expression on macrophages (CD68+), and CD73 expression on tumor cells (CK8+) in the tumor microenvironment of PD or PR HCC patients after PD1 antibody therapy

References

    1. Sung H, Ferlay J, Siegel RL, Laversanne M, Soerjomataram I, Jemal A, et al. Global cancer statistics 2020: GLOBOCAN estimates of incidence and mortality worldwide for 36 cancers in 185 countries. CA Cancer J Clin. 2021;71(3):209–249. doi: 10.3322/caac.21660. - DOI - PubMed
    1. Fitzmaurice C, Allen C, Barber RM, Barregard L, Bhutta ZA, Brenner H, et al. Global, regional, and national cancer incidence, mortality, years of life lost, years lived with disability, and disability-adjusted life-years for 32 cancer groups, 1990 to 2015: a systematic analysis for the global burden of disease study. JAMA Oncol. 2017;3(4):524–548. doi: 10.1001/jamaoncol.2016.5688. - DOI - PMC - PubMed
    1. Havel JJ, Chowell D, Chan TA. The evolving landscape of biomarkers for checkpoint inhibitor immunotherapy. Nat Rev Cancer. 2019;19(3):133–150. doi: 10.1038/s41568-019-0116-x. - DOI - PMC - PubMed
    1. Garon EB, Rizvi NA, Hui R, Leighl N, Balmanoukian AS, Eder JP, et al. Pembrolizumab for the treatment of non-small-cell lung cancer. N Engl J Med. 2015;372(21):2018–2028. doi: 10.1056/NEJMoa1501824. - DOI - PubMed
    1. Hamid O, Robert C, Daud A, Hodi FS, Hwu WJ, Kefford R, et al. Safety and tumor responses with lambrolizumab (anti-PD-1) in melanoma. N Engl J Med. 2013;369(2):134–144. doi: 10.1056/NEJMoa1305133. - DOI - PMC - PubMed

Publication types

MeSH terms