

Associations of Post-Acute COVID syndrome with physiological and clinical measures 10 months after hospitalization in patients of the first wave
- PMID: 34838369
- PMCID: PMC8612867
- DOI: 10.1016/j.ejim.2021.10.031
Associations of Post-Acute COVID syndrome with physiological and clinical measures 10 months after hospitalization in patients of the first wave
Abstract
Background: For a better understanding of the factors underlying the Post-Acute COVID Syndrome, we studied the relationship between symptoms and functional alterations in COVID-19 patients 10 months after hospitalization.
Methods: One-hundred-one patients hospitalized between March 1st and June 30th 2020 participated in a follow-up visit for an assessment of clinical history, comorbidities, lung function, physical capacity and symptoms, including the SGRQ for health-related quality of life, PHQ-9-D for depression, and SOMS-2 J for somatoform disorders. Data were analyzed by univariate comparisons and multiple logistic regression analyses.
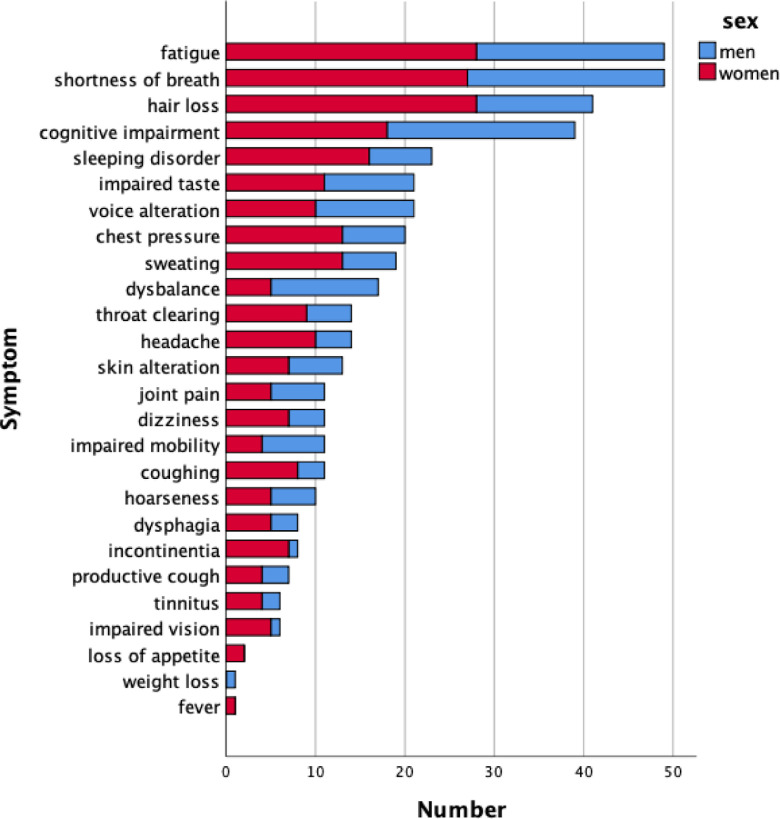
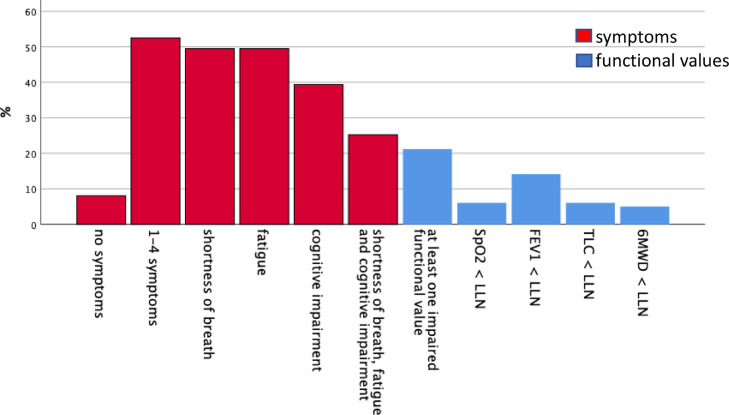
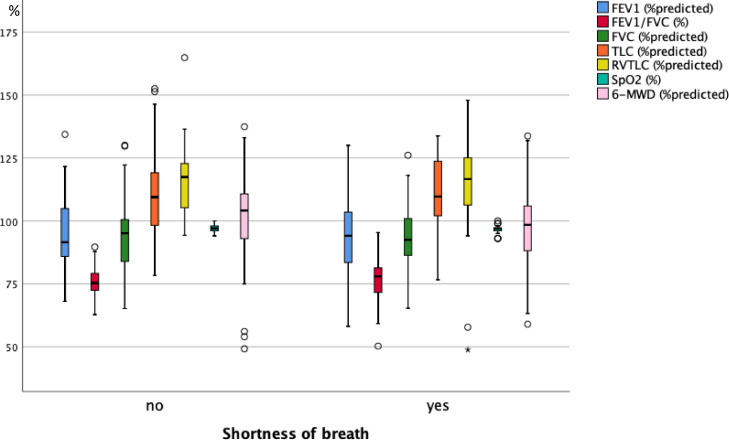
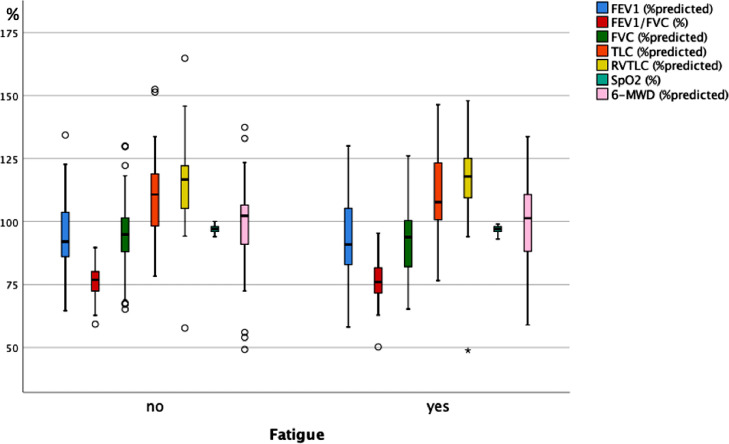
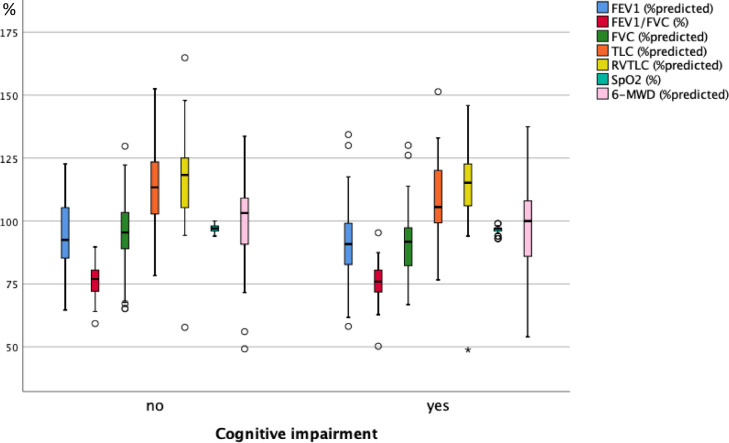
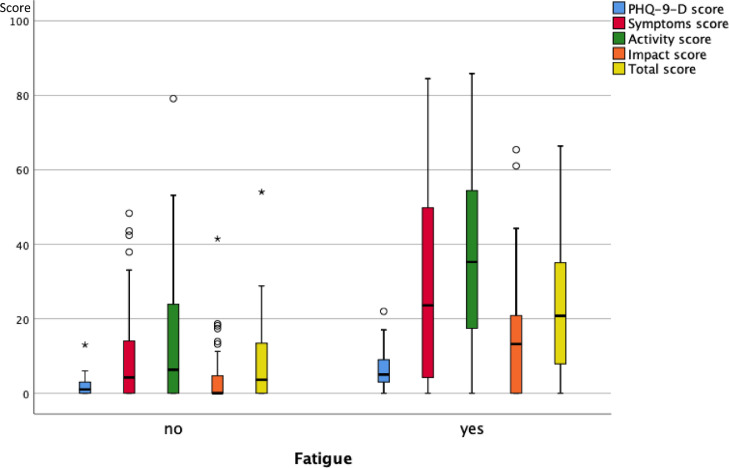
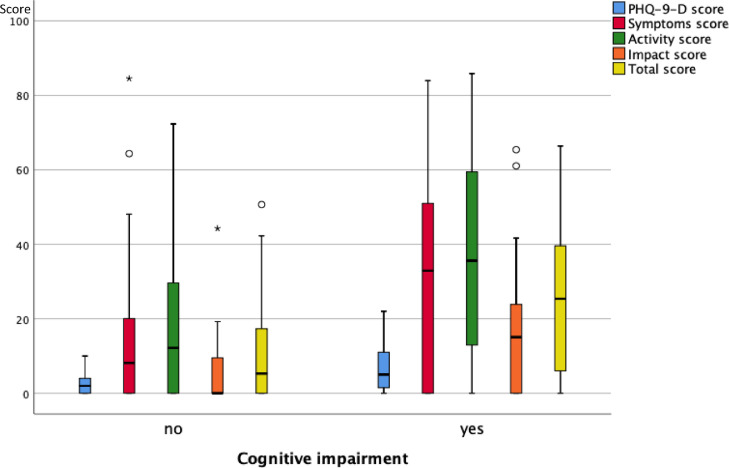
Results: Median age was 60 years, 42% were female, 76% had at least one comorbidity, the median length of the hospital stay was 8 days, 19% had been on the ICU. The most prevalent symptoms included shortness of breath (49%), fatigue (49%) and cognitive impairment (39%). Signs of major depression (PHQ-9-D ≥ 10) occurred in 28%/2% (p < 0.05) of patients with/without self-reported cognitive impairment, with median total SGRQ score being 25.4/5.3 (p < 0.05). There were associations between shortness of breath and BMI, SGRQ and hemoglobin levels; between fatigue, SGRQ and PHQ-9-D; and between cognitive impairment and PHQ-9-D (p < 0.05 each) but not with lung function or physical capacity. Characteristics of the acute disease were not related to symptoms.
Conclusions: The findings demonstrate that 10 months after discharge from a hospital stay due to COVID-19, the percentages of patients with symptoms were high. Symptoms showed a consistent pattern but could not be attributed to altered lung function or physical capacity. Our results suggest a role for alternative etiologies including psychosocial factors.
Keywords: Depression; HrQoL; Lung function; Post-Acute COVID Syndrome; Somatization; Symptoms.
Copyright © 2021. Published by Elsevier B.V.
Conflict of interest statement
None.
Figures

Similar articles
-
Four-Month Clinical Status of a Cohort of Patients After Hospitalization for COVID-19.JAMA. 2021 Apr 20;325(15):1525-1534. doi: 10.1001/jama.2021.3331. JAMA. 2021. PMID: 33729425 Free PMC article.
-
Risk factors for fatigue and impaired function eight months after hospital admission with COVID-19.Dan Med J. 2022 Mar 16;69(4):A08210633. Dan Med J. 2022. PMID: 35319451
-
Psychological distress and health-related quality of life in patients after hospitalization during the COVID-19 pandemic: A single-center, observational study.PLoS One. 2021 Aug 11;16(8):e0255774. doi: 10.1371/journal.pone.0255774. eCollection 2021. PLoS One. 2021. PMID: 34379644 Free PMC article.
-
Post-acute COVID-19 syndrome (PCS) and health-related quality of life (HRQoL)-A systematic review and meta-analysis.J Med Virol. 2022 Jan;94(1):253-262. doi: 10.1002/jmv.27309. Epub 2021 Sep 7. J Med Virol. 2022. PMID: 34463956 Free PMC article.
-
Post-COVID-19 syndrome: epidemiology, diagnostic criteria and pathogenic mechanisms involved.Rev Neurol. 2021 Jun 1;72(11):384-396. doi: 10.33588/rn.7211.2021230. Rev Neurol. 2021. PMID: 34042167 Review. English, Spanish.
Cited by
-
Association between COVID-19 symptoms, COVID-19 vaccine, and somatization among a sample of the Lebanese adults.Pharm Pract (Granada). 2023 Jan-Mar;21(1):2763. doi: 10.18549/PharmPract.2023.1.2763. Epub 2022 Dec 21. Pharm Pract (Granada). 2023. PMID: 37090451 Free PMC article.
-
Pulmonary function and chest computed tomography abnormalities 6-12 months after recovery from COVID-19: a systematic review and meta-analysis.Respir Res. 2022 Sep 6;23(1):233. doi: 10.1186/s12931-022-02163-x. Respir Res. 2022. PMID: 36068582 Free PMC article.
-
Factors associated with phenotypes of dyspnea in post-COVID-19 condition: a cross-sectional study.Sci Rep. 2024 Jun 11;14(1):13387. doi: 10.1038/s41598-024-64370-4. Sci Rep. 2024. PMID: 38862585 Free PMC article.
-
A biopsychosocial analysis of risk factors for persistent physical, cognitive, and psychological symptoms among previously hospitalized post-COVID-19 patients.Sci Rep. 2025 Apr 24;15(1):14234. doi: 10.1038/s41598-025-99176-5. Sci Rep. 2025. PMID: 40275067 Free PMC article.
-
Global prevalence of post-COVID-19 condition: a systematic review and meta-analysis of prospective evidence.Health Promot Chronic Dis Prev Can. 2025 Mar;45(3):112-138. doi: 10.24095/hpcdp.45.3.02. Health Promot Chronic Dis Prev Can. 2025. PMID: 40073162 Free PMC article.
References
-
- Robert Koch Institut (2021), COVID-19: Fallzahlen in deutschland und weltweit, in: rki.de, 11/08/2021, https://www.rki.de/DE/Content/InfAZ/N/Neuartiges_Coronavirus/Fallzahlen...., accessed: 11/08/2021.
-
- European Centre for disease prevention and control (2021), COVID-19 situation update for the EU/EEA, as of 10 August 2021, in: ecdc.europa.eu, 10/08/2021, https://www.ecdc.europa.eu/en/cases-2019-ncov-eueea, accessed: 08/08/2021.
MeSH terms
LinkOut - more resources
Full Text Sources
Medical
